An assessment of the Innovation
Union Scoreboard as a tool to
analyse national innovation
capacities: The case of Switzerland
Dominique Foray
1,* and Hugo Hollanders
21
College of Management, EPFL, Lausanne 1015, Switzerland and2Maastricht Economic Research Institute on Innovation and Technology (UNU-MERIT), Maastricht University, Keizer Karelplein
19, 6211 TC Maastricht, The Netherlands *Corresponding author. Email: Dominique.foray@epfl.ch
This article investigates the Innovation Union Scoreboard (IUS) as a tool to carry out case studies about national innovation capacities in the case of given countries. It clarifies what this statistical framework can offer in terms of information and insights on strengths and weaknesses of a given country relative to the other countries which are also involved in this statistical exercise. The investigation is carried out through the case study of Switzerland; a country that is leading the IUS ranking for many years. The approach will therefore start with the full analysis of the IUS results for Switzerland. Then other statistical evidence as well as qualitative insights will be added to the discussion to identify what really matters to explain success and the potential weaknesses the Swiss policy should care about. The conclusion is that if the IUS can be considered as an important tool to inform innovation policies, it should not be applied in an isolated manner or
without relying on other types of indicators and information on the system considered. Keywords: innovation; innovation union scoreboard; composite indicator; evaluation.
1. Introduction
1This article investigates the Innovation Union Scoreboard (IUS) as a tool to carry out case studies about national innovation capacities (NICs) in the case of given countries. NIC is defined by Furman et al. (2002) as ‘the ability of a country to produce and commercialize a flow of innovative technology over the long term’. It is, therefore, a broad concept that aims to capture most of the factors that matter as determinant of innovation performance at national level. Because the notion of ‘factors that matter’ can be subject to some variations among economists and innovation experts, the concept of NIC is certainly less simple or easy than other related ones such as scientific capacities or R&D capacities. However, in most interpret-ations of what an NIC needs to capture are the following determinants: (1) the framework economic conditions such as finance, competition, labour market, openness to inter-national trade; (2) the science and knowledge infrastructure
[Universities and public research organizations (PROs), transfer of technology]; (3) the capabilities of companies in terms of knowledge absorption and production (R&D intensity, cooperation, cluster-specific innovation environ-ment); (4) the level and composition of human capital.
Our article aims at clarifying what the IUS statistical framework can offer in terms of information and insights on strengths and weaknesses of the NIC of given country relative to the other countries which are also involved in this statistical exercise. But this article invites also readers to think beyond this statistical framework. Indeed, its strengths—synthetic character, temporal stability, and inter-national comparability represent also potential weaknesses of the indicator: several crucial factors and conditions are not easily observable within this statistical framework. This is why the measures of strengths and weaknesses of the country must be completed by other measures as well as enriched with more contextual data and information in
order to get a better picture of the ‘fundamentals’ of the country that can explain its capacity of innovation and help to predict its innovative performance.
Our conclusion is that if the IUS can be considered as an important tool to inform innovation policies, it should not be applied in an isolated manner or without relying on other types of indicators and information on the system considered. Our demonstration is carried out through the case study of Switzerland; a country that is leading the IUS ranking for many years. Looking at its performance as measured by the IUS, it would be tempting to think that Switzerland is ‘well served’ by the IUS. However, some fundamentals as well as best practices that characterize the Swiss innovation capacity are not so well observable and measured in the IUS framework.
The approach will start with the full analysis of the IUS results for Switzerland: ‘let IUS talk first and signal weaknesses and strengths’. Then other statistical evidence as well as qualitative insights will be added to the discussion to identify what really matters to explain success and the potential weaknesses the Swiss policy should care about.
2. The IUS’ design and underlying structure
2.1 IUS: a short presentation of its structure and operation
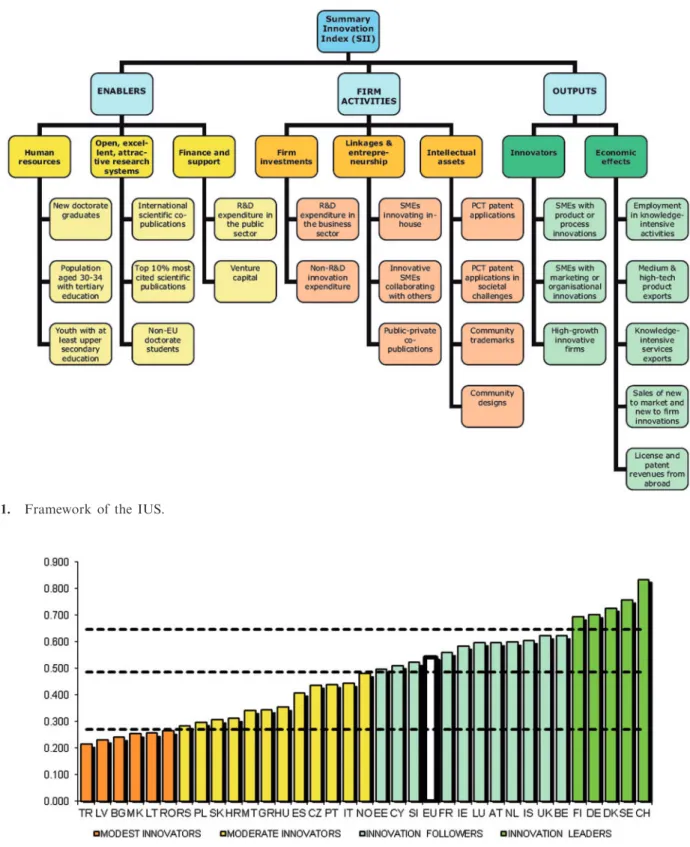
This section provides general insights about the IUS. The IUS provides a comparative assessment of the innovation performance of the European Union’s (EU) 28 member states and the relative strengths and weaknesses of their research and innovation systems. IUS uses 25 research and innovation-related indicators and covers the EU 28 member states as well as Macedonia, Serbia, Turkey, Iceland, Norway, and Switzerland.
The indicators are grouped into three main categories (see Fig. 1):
. ‘Enablers’, the basic building blocks which allow in-novation to take place.
. ‘Firm activities’ which show how innovative Europe’s firms are.
. ‘Outputs’ which show the benefits for the economy at large.
Descriptions for each category can be found in the Annex of the IUS report.2
Based on the underlying structure presented above and the data series for each country, the following approach is used in the IUS to calculate innovation performance (see Supplementary Appendix 1).
(1) Identify and replace positive and negative outliers. (2) Set reference years (those years for which most recent
data are available).
(3) Impute missing values (but only if data are available for at least 1 year over the 5-year observation period).
(4) Determine the highest and lowest scores for all countries.
(5) Transform those indicators for which the data distri-bution is highly skewed.
(6) Normalize the data by recalculating all data to the same 0–1 range by first subtracting the lowest score and then dividing by the difference between the highest and lowest score.
(7) The Summary Innovation Index (SII) is the average of the normalized scores for all indicators.
On the basis of this calculation, each country’s innovation performance is captured by a composite index measuring innovation performance, the SII. Based on the index value, countries can be classified in one of four performance groups (leaders, followers, moderate, and modest). The results of the IUS 2011 are presented in the Fig. 2.3
One important contribution of the innovation index is not only about static comparisons but about the possibility of having a dynamic view of countries’ innovation per-formance. In other words, the IUS structure provides the possibility to estimate growth rates of the index (see Supplementary Appendix 2).
2.2 A little warning: on the usual mistakes made by policymakers in the interpretation of results
Indicators have to be interpreted with care. It is obvious that ‘more’ is not always better. No country would benefit if all of its people would have a completed tertiary educa-tion or if R&D expenditures would amount to 50% of GDP. Clearly, for most indicators, there must be some kind of U-shape performance curve where at low levels it is worthwhile to improve the performance level but from
some level onwards further improvements lead to
inefficiencies. This directly applies to all the IUS indicators which are expressed as percentage scores between 0% and 100%. Having a high share of innovating firms seems de-sirable, but if all firms innovate without all of them having the capacities to do so will lead to an inefficient allocation of the resources available for innovation. The difficulty is that for none of the indicators this turning point in the U-curve is known. If a country has already passed this turning point, it could well be that policies should aim at decreasing performance instead of improving it. A possible case is the high R&D intensities in Finland and Sweden. Although a significant share of these countries’ GDP is spent on R&D activities, per capita income is not among the highest in Europe. One could argue that these countries have been overinvesting in their R&D activities.
For several countries, the share of their population aged 30–34 years having completed tertiary education might be reaching the above-mentioned turning point. In Ireland, Cyprus, Luxembourg, Finland, Sweden, and Norway, the indicator is already above 45%, and in Switzerland, the 44.2% might also be close to this turning point.
Educational policies might therefore better aim at improving the quality of graduates instead of fur-ther increasing the number of graduates. A similar argument could be made for new doctorate graduates where Sweden and Switzerland are the only countries with a share above 3%.
Differences in indicator scores can also be explained by differences in institutional settings. Depending on e.g. the industrial structure, a country having high shares of R&D-intensive industries will almost automatically perform better in patent applications (and to a lesser extent in scientific publications). Government policies simply
Figure 1. Framework of the IUS.
promoting firms to apply for patents where the industry mix is focused towards R&D-extensive industries are doomed to fail. More long-run oriented industrial policies would be needed to trigger structural change leading to an increase in R&D and/or knowledge-intensive industries.
Another mistake commonly made is that policies aim at companies or people within a particular country but borders as such are becoming less and less important due to the increasing globalization. With companies and people being able to move their activities almost freely from one country to another, national policies are becoming less and less effective as they are in open competition with similar policies in neighbouring countries. Increasing R&D subsidies will fail to be effective if all countries do so and will only lead to replacing privately funded by publicly funded business R&D. A harmonized cross border approach might be more effective, e.g. as the European Commission (EC) is trying to do for the EU member states. Other indicators favour small countries compared to large countries, such as the indicator on international co-publications. For these indicators, performance compari-sons should be made only with countries of a similar size. Not choosing the proper set of benchmark countries will lead to erroneous conclusions and, even worse, to inappro-priate or ineffective policies. This argument is relevant for Switzerland in particular which—given its relatively small size and specialized industrial structure—cannot and should not be directly compared with larger countries like Germany and the UK.
2.3 Strengths and weaknesses of IUS
It would be inaccurate to say that IUS provides a biased view of innovation. The set of indicators that are mobilized here are not emphasizing only science-driven innovation; they are not only capturing formal R&D and patents; finally the underlying structure does not reflect the famous linear model of innovation, which was discarded a long time ago by scholarly works of Rosenberg, Nelson, etc. With IUS, and given observation and measurement constraints and limitations, one tries to reflect the multidi-mensional nature of innovation conditions, inputs, proced-ures, and outputs.
However, a composite indicator is by its very nature complex and can raise issues dealing with the relationship between the indicator and the underlying concept of interest (NIC). Jaffe (1999) identifies a set of criteria for a ‘good’ indicator. Among these criteria, a ‘good’ indicator:
- Should be as precise as possible, that is, it should bear a tight relationship with the underlying concept or have a high ‘signal-to-noise ratio’.
- Should not be susceptible to manipulation. In other words, we must be concerned about the possibility
that the act of measurement may influence the process being observed.
- Should be as transparent as possible. Potential users (i.e. policymakers) can understand its mode of produc-tion and can use it properly for future policy decisions. Of course—there is no surprise here—a composite indi-cator will hardly meet these three characteristics. However, this fact has to be accepted and managed as the unavoid-able consequence of a challenging measurement problem: capturing the multi-dimensionality of a concept and at-tempting to translate it into a single metric.
By its very nature a composite indicator makes the
weighting scheme very critical, and final results
(rankings) can be very sensitive to weighting variations. A robustness analysis using randomly sampled weights has shown that countries have relatively stable ranks which only fluctuate within groups consisting of a small number of countries (Hollanders and Tarantola 2011). Sajeva et al. (2005) analysing an earlier version of the IUS have also shown that the use of different weighting schemes has no real effect on the ranking of countries. A scheme using equal weights for each of the indicators is the
most easy and transparent weighting scheme (see
Supplementary Appendix 3).
It is also true that the use of IUS for policy purposes is subject to severe limitations, and there are many mistakes that can be made by ‘over-interpreting’ the results (see above). And even in an ideal world of reliable and consist-ent data series and of rigorous statistical treatmconsist-ents, the IUS will miss some strengths and some weaknesses in a particular country’s case. After all, the IUS is a standard framework designed to accommodate a huge diversity of national contexts and situations and it is likely that it will miss some specific aspects in any country.
Finally, several things that matter in terms of innovation performance are imperfectly captured for obvious reasons of data and measurement problems. The statistical picture as provided by IUS needs, therefore, to be completed by looking beyond the ‘IUS observation perimeter’. This is what will be done in the next sections. Section 3 describes what IUS only is telling us about Swiss strengths and weaknesses while section 4 will complete the picture with additional data sources and qualitative insights.
2.4 Identifying the feasibility space of innovation policy
It is also useful to note that some of the indicators reflect facts that can be changed through good policymaking in the long term or even in the short term. Some other indi-cators are reflecting facts that are more ‘resistant’ to any policy intervention simply because policy in these cases would have to aim at structural changes and major trans-formations. Such a taxonomy—which is beyond the scope of this article—would help to identify the ‘feasibility space’
of the innovation policy of any considered country. This space is not only defined by the relative positions (strength and weaknesses) of the country that matter in terms of policy but also by the fact that some indicators reflect features that can be improved ‘easily’ while some others reflect structural features of the system on which policy will only have little influence even in the long term (see Supplementary Appendix 4). In other words, there is gap between the frame of indicators and the ‘feasibility’ of the policy. This gap needs to be understood by pol-icymakers (Arundel and Hollanders 2005).
2.5 The competitive advantages of IUS today vis-a-vis other approaches
Given the several limitations just mentioned, it is logical to ask whether other approaches to measure NIC are ‘super-ior’, that is to say can manage in a better way the tension between the need to capture a multi-dimensional and complex phenomenon and the criteria that are required to have a good indicator (precision, transparency, etc.).
For instance, Furman et al. (2002) propose an approach to measure NICs—consisting in the nation’s common innov-ation infrastructure, the cluster-specific environment for in-novation and the strength of linkages between these two. The goal of the approach is to estimate the relationship between international patenting and observable contributors to national innovative capacity. While challenging and interest-ing as an academic exercise and even as a set of guidelines and instructions for studying one particular country’s innov-ation performance, this approach will fail in a similar way at meeting all criteria of precision, transparency, and non-manipulability. Furthermore, the underlying structure of variables (to measure national innovative capacity) makes this approach not easy to repeat over time so as to get inter-temporal comparisons and to measure progress over time and between countries.
In the business of indicators, the proof is in the use and in the practice: IUS is supported by an international data infrastructure which is shared and maintained by an ex-panding community of experts and practitioners. It has proven its ability to be produced in a very large number of countries and to be repeated every year while not raising any major issue of stability of the relationship between the indicator and the underlying concept. IUS has been suc-cessful in passing the initial phase of conception and pilot study (the first IUS was piloted in 2000) which always entails high fixed costs. It has also passed successfully the phase of enrolling first users and adopters and increasing the size of the community of countries interested in being involved in the project. As such it entered a phase of increasing returns: as the IUS indicator is adopted and used in a wider community, more complementary activities (training) and services (statistics provision) are developing, and higher attraction is generated on additional users and policymakers who are eager to use it to be ‘comparable’.
In that sense, IUS has today a clear competitive advantage on most other composite indexes which never got so much attraction. The most recent attempt undertaken by a con-sortium of institutions (Cornell University, INSEAD, WIPO 2014) to develop a Global Innovation Index is just a good illustration of the fact that the first phase of
building and using a new indicator—which has
demonstrated its relevance and some practical merits—is extremely perilous. Many failures characterize the market for indicators, most of them stemming from problems of increasing returns (Foray 2007). Because the IUS has acquired a dominant position (at least in Europe), it will be difficult for alternatives to compete successfully whatever merits they can show.
In addition, IUS is one of the few reports which consist-ently have been using data from innovation surveys, in particular the Community Innovation Survey which collects firm-level data on innovation activities for most European countries. Only innovation survey data can ad-equately capture the effects or output of innovation. Reports not using such data, as the Global Innovation Index, fail in capturing the output of innovation (Hollanders and Janz 2013).
3. IUS insights: what can we learn from the
statistics about the Swiss innovation
capacity?
The first step involves ‘only’ extracting information
and signals from IUS about strengths and
weaknesses: how the system is performing as we know it from the IUS 2011 report? This approach involves three steps.
3.1 Which indicators are primarily responsible for the proper position of Switzerland in the ranking of IUS? Each of the 24 IUS 2011 indicators (for one indicator— fast-growing innovative firms—data are not available) contributes equally to the SII. The relative contribution of each of the indicators can easily be shown in a radar graph. An indicator with a normalized value above (below) the SII score contributes more (less) to the SII. The indi-cators with the lowest normalized scores will contribute ‘negatively’ to the SII; those with the highest normalized scores contribute ‘positively’. Figure 3 shows the indicators which are responsible for the strong performance of Switzerland in the IUS.
For each of these ‘strong’ indicators, we compare Switzerland with the top-5 best performing countries to identify possible performance gaps to better performing countries (the data in the tables below first show the real indicator and in brackets the normalized score):
. New doctorate graduates: Switzerland is already the best performing country with 3.6 new doctorate graduates.
As this value is higher than the mean score across all countries plus 2 times the standard deviation, the value for Switzerland is considered an outlier, and in the nor-malization process, Switzerland receives a score of 1.000 just as Sweden.
Switzerland Sweden Finland Portugal Germany
3.6 (1.000) 3.1 (1.000) 2.9 (0.935) 2.7 (0.871) 2.6 (0.839)
. International scientific co-publications: Switzerland is the second-best performing country with 2,309 interna-tional scientific co-publications only just below Iceland’s 2,311 publications.
Iceland Switzerland Denmark Sweden Norway
2,311 (1.000) 2,309 (1.000) 1,533 (0.984) 1,485 (0.952) 1,386 (0.887)
. Top 10% most cited scientific publications worldwide: Switzerland is already the best performing country with 15.6 publications among the most cited publications
worldwide having a significant lead over the
Netherlands.
Switzerland Netherlands Denmark Belgium UK
15.6 (0.991) 14.9 (0.943) 14.8 (0.932) 13.4 (0.833) 12.8 (0.790)
. Non-domestic doctorate students: Switzerland is already the best performing country with 47% of doc-torate students coming from abroad. The strong Swiss performance however needs to be interpreted with care as the indicator measures the share of non-EU doctor-ate students for the EU member stdoctor-ates. For EU member states, it is thus more difficult to score as high as Switzerland does.
Switzerland UK Norway Norway Iceland
47.0 (1.000) 31.6 (1.000) 34.3 (1.000) 29.1 (0.973) 23.0 (0.863)
. R&D expenditure in the business sector: Switzerland is the third-best performing country. Finland and Sweden spent a higher share of their GDP on business R&D.
Finland Sweden Switzerland Denmark Germany
2.69 (1.000) 2.35 (1.000) 2.20 (0.935) 2.08 (0.884) 1.90 (0.806)
. Public–private scientific co-publications: Switzerland is already the best performing country with almost 200 public–private co-publications.
Switzerland Iceland Denmark Sweden Norway
198.5 (1.000) 170.0 (1.000) 123.2 (0.987) 117.3 (0.960) 110.6 (0.930)
. Patent Cooperation Treaty (PCT) patents applications: Switzerland’s 8.18 patent applications put the country in the third place significantly below the performance of Finland and Sweden.
Sweden Finland Switzerland Denmark Germany
10.53 (1.000) 9.57 (1.000) 8.18 (0.945) 7.52 (0.900) 7.04 (0.866)
. PCT patent applications in societal challenges: Switzerland’s 2.56 patent applications put the country in second place, just below Denmark.
Denmark Switzerland Sweden Netherlands Germany
2.65 (1.000) 2.56 (1.000) 2.02 (1.000) 1.11 (0.783) 1.00 (0.745)
. Community trademarks: Switzerland performs well below Malta and Luxembourg. These countries’ high performance could be due to their very small country size, making it impossible for Switzerland to match.
Luxembourg Malta Cyprus Switzerland Austria
24.03 (1.000) 16.31 (1.000) 13.43 (1.000) 11.46 (0.923) 9.87 (0.794)
. Community designs: Switzerland is the third-best per-forming country, and performance is very close to that of Germany but the gap with Austria is more significant.
Austria Germany Switzerland Denmark Italy
8.64 (1.000) 7.90 (0.934) 7.81 (0.924) 7.43 (0.879) 6.86 (0.812)
. Small and medium-sized enterprises (SMEs) introducing product or process innovations: Switzerland is already the best performing country with 57% of SMEs having introduced a product or process innovation.
Switzerland Germany Portugal Belgium Estonia
57.0 (1.000) 53.6 (0.981) 47.7 (0.834) 44.0 (0.741) 43.9 (0.738)
. Employment in knowledge-intensive activities:
Switzerland is in the second place with almost 20% of employment in knowledge-intensive activities Luxembourg is the best performer with more than 25% of employment in such activities.
Luxembourg Switzerland Ireland Iceland Sweden
25.7 (1.000) 19.9 (1.000) 19.5 (0.974) 18.1 (0.881) 17.1 (0.815)
. Sales of new-to-market and new-to-firm innovations: Switzerland is in the second place with almost 25% of firms’ turnover coming from innovations. Only Greece is showing a better performance.
Greece Switzerland Czech Republic Germany Hungary
25.6 (1.000) 24.9 (1.000) 18.7 (0.961) 17.4 (0.872) 16.4 (0.807)
. Licence and patent revenues from abroad: Switzerland is already the best performing country followed by the Netherlands.
Switzerland Netherlands Iceland Sweden Luxembourg
3.62 (1.000) 2.77 (1.000) 1.17 (0.825) 1.12 (0.807) 0.96 (0.746)
3.2 Best and worst performing countries
The SII is a relative performance measure where a country’s normalized score depends on the performance of the best and worst performing country in the sample. We have identified these best and worst performing countries for each indicator and have shown the impact of an improvement of 10% of the best performing country or a worsening of 10% of the worst performing country on the Swiss SII score.
Table 1 below summarizes these results.4 It is obvious that there is not much to gain for Switzerland’s SII score if the worst performing countries would perform even worse. Switzerland has more to lose if the best performing countries improve their performance, in particular for the share of population aged 30–34 years with completed tertiary education, PCT patent applications, and the em-ployment share in knowledge-intensive activities.
3.3 Are there in the current results already visible signs of weakening?
A direct comparison of the SII scores of Switzerland and
the other innovation leaders (Fig. 4) shows that
Switzerland has increased its lead to Sweden and Denmark and has kept a stable lead over Germany and Finland. Similar comparisons can be made for each of the individual indicators to indicate areas where Switzerland might be losing its lead to competing countries.
There are no clear signs in the IUS 2011 report that Switzerland is weakening, a result which is confirmed by Fig. 5 showing current IUS performance on the vertical axis and IUS growth performance on the vertical axis.5 Switzerland’s innovation performance is improving as fast as that of the EU 27 (represented by the two dotted lines).
3.4 Due to what reasons/indicators could Switzerland lose its leading position in Europe?
From a statistical point of view, those indicators with a below average normalized value and growing at a negative rate are endangering the good position of Switzerland. Table 2 shows three indicators in particular that put Switzerland at risk from a ‘narrow IUS’ point of view: Share of SMEs innovating in-house; share of innovative SMEs collaborating with others; and share of knowledge-intensive services exports.
It is obvious that the narrow view developed in this section has to be interpreted with care before drawing more general conclusions. Switzerland might have a relative weak performance in SMEs innovating in-house and SMEs collaborating with others, but the country is performing among the best countries when it comes to the share of firms introducing a product or process innov-ation. Ultimately, the share of innovating firms is more important than how they innovate, so further investigation is needed to better understand the weak performance in the first two indicators and whether this weak performance is
relevant at all.6At the same time, collaboration is import-ant as it enables firms to tap into a broader range of know-ledge and as it will stimulate knowknow-ledge diffusion between the collaborating firms.
4. From statistical to policy relevance
Some IUS indicators—either strong or weak—need to be carefully analysed before any interpretation and recom-mendation can be given. In particular, they need to be put in context. A contextual analysis can show that specific weaknesses might not be problematic while strengths might involve elements of fragility. We are de-veloping this contextual analysis in the case of Switzerland for four indicators below. It is also useful to try to generate new insights beyond the IUS ‘observation perimeter’ to highlight key features that are only partially measured within the IUS framework. Finally, we have to take into account that while some indicators reflect facts that can be changed through policies, some other indicators are Table 1. The effect on the Swiss SII of a 10% improvement of the best
performing or 10% worsening of the worst performing country
IUS indicator Best country Worst
country
+10% 10%
New doctorate graduates 0.004 /
Population aged 30–34 years with completed tertiary education
0.005 0.000
Youth aged 20–24 years with at least upper secondary level education
0.003 +0.002
International scientific co-publications 0.000 0.000 Top 10% most cited scientific
publications worldwide
/ 0.000
Non-EU/domestic students / 0.000
R&D expenditure in the public sector 0.003 0.000
Venture capital 0.004 0.000
R&D expenditure in the business sector 0.004 0.000 Non-R&D innovation expenditures 0.003 0.000
SMEs innovating in-house 0.003 0.000
Innovative SMEs collaborating with others 0.002 0.000 Public–private scientific co-publications / 0.000
PCT patents applications 0.007 0.000
PCT patent applications in societal challenges
0.004 0.000
Community trademarks 0.004 0.000
Community designs 0.004 0.000
SMEs introducing product or process innovations
/ 0.000
Employment in knowledge-intensive activities
0.006 0.000
Medium and high-tech product exports 0.002 0.000 Knowledge-intensive services exports 0.002 0.000 Sales of new-to-market and
new-to-firm innovations
0.000 0.000
Licence and patent revenues from abroad
/ /
Table 2. Indicators that are endangering the position of Switzerland
IUS indicator Performance
relative to EU (EU = 100)
Growth rate (%)
New doctorate graduates 207 0.0
Population aged 30–34 years with completed tertiary education
132 6.0
Youth aged 20–24 years with upper secondary level education
104 1.3
International scientific co-publications 517 0.0 Top 10% most cited scientific
publications worldwide
145 1.7
Non-EU/domestic doctorate students 160 0.0
R&D expenditure in the public sector 97 2.1
Venture capital 113 1.3
R&D expenditure in the business sector 179 0.0 Non-R&D innovation expenditures 163 6.0
SMEs innovating in-house 93 4.8
Innovative SMEs collaborating with others 84 6.1 Public–private scientific co-publications 349 0.0
PCT patent applications 217 1.2 PCT patent applications in societal challenges 282 0.0 Community trademarks 205 12.0 Community designs 164 1.5
SMEs introducing product or process innovations
159 0.7
SMES introducing marketing or organizational innovations
n/a n/a
Employment in knowledge-intensive activities 147 0.54 Medium-high and high-tech product exports 132 0.2 Knowledge-intensive services exports 64 2.2 Sales of new-to-market and
new-to-firm innovations
145 15.8
reflecting facts that are more resistant to any policy inter-vention. It is therefore important to draw the ‘feasibility space’ of the Swiss innovation policy.
4.1 Some IUS indicators need to be put in context 4.1.1 High business R&D expenditures: is there a pharma effect? One could argue that the strong indica-tor about business R&D expenditures is an effect of the high specialization of Switzerland in the pharmaceutical industry; a sector which is notoriously known for its high business R&D intensity.
As in many countries, we observe a large company effect in Switzerland. About three-fourth of intramural expenditures in R&D of the business sector takes place in large companies, while SMEs account for merely a fourth of expenditures (Erawatch 2011, Switzerland) (Fig. 6). However, the share of large companies in business R&D expenditure in Switzerland is not excep-tionally high. In Finland, the USA, and Sweden shares are close to 85% and in Germany even 90%. But beyond this large company effect, there is indeed a pharma/ specialization effect which is more specific. Switzerland does have a very high share of almost 40% of business R&D expenditure coming from the pharma industry. This feature can create an element of fragility for the whole system, making it quite dependent of strategic de-cisions and economic health within one single sector of the economy.
However, it is also important to note that the relatively low contribution of SMEs to the indicator does not neces-sarily mean weakness in innovation capacities of these companies, as other indicators (for instance SMEs introducing product or process innovations) tell us another story (which is the quite usual story of SMEs which are relying quite effectively on several other
sources of knowledge than in-house R&D to innovate, e.g. by purchasing or licencing patents or buying advanced machinery, equipment, or software).
4.1.2 What is the real meaning of the weakness ‘youth aged 20–24 upper secondary level education’ and the close to average ‘population aged 30–34 with tertiary education?’ A first nuance is that the strong indicator on new doctorate graduates tells us that at least the features identified by the two weak indicators should not affect the future population of highly skilled workers (scientists and engineers) too much as Switzerland is strongly relying on immigration of highly skilled workers. And perhaps a more important nuance is that these weak indicators reflect (in hollow so to speak) the very strong vocational education and training system (not captured in IUS). We will introduce below the importance of the vocational edu-cation and training system in Switzerland as one of the key factors explaining the strong innovative performance of the country.
4.1.3 Venture capital is clearly a weakness in the IUS framework and this is not a disputable fact. However, inferring from this indicator a statement on the financial conditions of the Swiss innovation system is likely to lead to some misinterpretations. The measure of general financial development (private credit+capitalization of financial markets/GDP) places the country in top position (first place ahead of UK, the Netherlands, USA, and Japan) (OECD 2012). And good financial de-velopment obviously facilitates company financing—from
their creation to their growth. To summarize,
Switzerland does not have more financing solutions spe-cifically adapted to the life of start-ups than other European countries (the VC indicator in IUS is weak),
but the general financial foundations are clearly favourable.
4.2 New organizational principles of some IUS indicators combined with other evidence: discovering the critical building blocks of the Swiss innovation system
To complete the picture offered by the IUS indicators, it is useful to generate new insights beyond the IUS ‘observa-tion perimeter’. It is useful here to work with some ‘organ-isational principles’ of IUS indicators and other evidence.
When grouped together, the evidence is describing import-ant building blocks of the Swiss innovation system. Those building blocks encapsulate processes that strongly impact the innovative performance of the whole system. These processes are only partially measured within the IUS framework.
4.2.1 Transfer of knowledge and public–private
research collaborations. IUS does not measure know-ledge and technology transfer between public/academic research and industry and services. The lack of a reliable
Figure 5. Current IUS performance and IUS growth performance for all countries.
and single headline indicator and the difficulty of data col-lection in this area for many countries explain why such an important measure is missing.
Partial and non-systematic evidence suggests that know-ledge and transfer activities between universities and industries are strengths of the Swiss innovation system.
Such evidence involves the massive presence of companies on the campus, the high number of co-publications between academic and industrial researchers, the numerous collab-oration networks between universities and companies as well as the performance of the Swiss Offices of Transfer of Technology (TTOs). Public–private scientific co-publica-tions are a strong indicator for Switzerland in the IUS. We can take it as a good proxy for the importance of collabor-ation and coopercollabor-ation between academic research and industry/services. As for TTO’s efficiency, we note the presence of very effective and professional transfer struc-tures—one per university or campus. This has been observed thanks to the CEMI survey that revealed the higher productivity of these entities relative to TTOs in other European countries (Conti and Gaule´ 2009). The questions recently raised by certain members of the Swiss parliament regarding the effectiveness of technology transfer in Switzerland are in our opinion unjustified.7
4.2.2 Size diversity, anchor tenant, and R&D
globalization. An important characteristic of the Swiss innovation system is the size diversity of the private sector involving an amazingly high number of very large R&D intensive companies operating as global leaders in their fields as well as a high number of innovative SMEs (IUS indicator). Each category (large firms developing im-portant in-house R&D activities and SMEs that are innov-ation oriented) generates important positive externalities and enhances the general innovation performance of the system.
First, the anchor tenant theory explains that large R&D intensive firms, specialized in certain technological fields, create externalities within the local system of innovation.8 Anchor tenants enhance the national/regional innovation system; they enhance local university research and thicken the local market for research services and technologies by operating on both the supply and the demand side. Presence of anchor tenants is empirically associated with significant positive effect on the local innovation system. Switzerland is benefitting of the presence of anchor tenants in most sectors in which it is specialized: pharmaceuticals, agro-food, instrument and control, transport technology, watch, as well as financial and insurance services. In section 5.1, we will simulate the impact of a relocation of some business activities of an anchor tenant outside of Switzerland. This impact will be measured within the IUS framework.
Second, for innovation performance at system level, both categories of firms (the very large companies and
the SMEs) have to be considered together (Agrawal et al. 2010). One type of local innovation externality generated by large firm is the spawning of spin-offs
(which often occurs due to the development of
technologies that are subsequently deemed unrelated to the firm’s overall business). Another type of local innov-ation externality is generated by small firms. It arises from the demand they create for the third-party provision of technology-oriented ancillary services that lowers the cost of entry for others. Thus, this small-firm externality is par-ticularly salient in the presence of one or more large firms that have the potential to produce spin-offs. Large- and small-firm externalities are complements, and diversity in the sizes of firms engaged in innovation (as in the Swiss system) is associated with significant positive effects on the dynamism of innovation in the country. Size distribution of local innovators appears to be important as a whole, not just one or other tail. One strength of the Swiss system lies within such a size diversity (involving a significant number of large R&D-oriented firms). It plays an important role in driving the performance of the Swiss innovation economy. However, there are some possible unintended conse-quences of this strong market structure. The presence of a high number of large industrial labs (relative to the size of the country) results in a high outward R&D intensity (measured as outward R&D/total BERD). Switzerland over time is consistently first in terms of the overall
outward R&D intensity (well ahead of Sweden,
Germany, and USA) (European Commission 2012). Such a feature is raising many issues. While a location of R&D in other countries is responding to strong rationale (large market proximity, proximity to the supply of various R&D inputs such as highly skilled workers including technicians, engineers, researchers and scientists, great universities, and high-tech clusters) and has a positive effect on these firm’s profitability, the conse-quences of such a high outward R&D intensity on the home country are less obvious. Delocalization of R&D is likely to deprive the home country of some of the externalities that are potentially generated by the anchor tenant (above). Damages could be higher if delocalization involves R&D related to entirely new fields. In such case, some key driving forces and coordination mechanisms missing in the home country would impede the capacity of the local/national system to move collectively towards these new fields (Foray and Van Ark 2008).
This is an important issue for the Swiss innovation capacity. The unique size diversity of innovative firms (unique given the size of the country) is a precious feature but is likely to increase the overall outward R&D intensity; the consequences of which on the Swiss innov-ation system are unclear. An important question here is
whether knowledge spillovers and other types of
externalities occur from the R&D located abroad to other firms and universities located in Switzerland. This question remains largely unexplored.
4.2.3 Skill’s pyramid and labour markets. IUS captures the highly skilled dimension of human capital well [New doctorate graduates, top 10% most cited scientific publi-cations, non-domestic doctorate students, employment in knowledge intensive activities]. However, these indicators only describe the tip of the skills’ pyramid. Therefore, the fact that Switzerland produces the right skills pyramid is only partially measured by IUS. The Swiss pyramid is neither too flat (a solid base of qualification and profes-sional skills but few elite in terms of research to produce cutting-edge knowledge) nor too slender (the breakthrough knowledge produced by advanced research is poorly ex-ploited by industry in the absence of a solid foundation of professional skills). The well-proportioned Swiss pyramid is the result of two factors. The first one, not measured by IUS, involves the vocational education and training system—a true treasure of the country! It is characterized by dual training, something all countries talk about but few are capable of practising. For it to work, as demonstrated by Wolter et al. (2003), companies have to play the game and be really training-oriented (which involves cost and requires an organization devoted to these learning processes). It does not seem easy to establish the right incentives to which companies will respond positively in terms of apprentice training and in most countries companies are not truly training-oriented (Mu¨hlemann et al. 2007). We must also note the existence of a very well developed and equipped tertiary vocational education, which means that when you opt to follow the vocational path at a still fairly young age you can go very far and very high.9So much for the base of the pyramid that gives industry access to a very well-trained population. As for its tip, the factors that count are well captured by IUS: they are about the exceptional attraction of the Swiss scientific arena in the eyes of the best foreign researchers. The high salaries naturally play an essential role but also the openness of the system. There is not, as in France or Italy, a system of academic corporate bodies (the National Council of Universities that qualifies or disqualifies candi-dates). Entries into the Swiss system are naturally governed by the labour market, the supply, and the demand that operate in each institution. This attraction and openness produce very international campuses and areas with a high intensity of scientific immigration.
The well-proportioned skills pyramid reflects a balance between the different types of training, completed by the system’s high degree of attraction and openness to the world’s scientific elite. These proportions reflect great harmony between advanced research and the economy’s capacity to absorb its results, to materialize the research spill-overs.
Finally, the great vocational and training system and the high degree of the Swiss labour market flexibility are com-plements. Flexible labour markets facilitate innovation when the latter includes a dimension of « creative destruc-tion » (Saint Paul 2002). The flexibility of the labour
market which is a true characteristic of the Swiss economy (OECD 2012) reduces the costs of this creative destruction, thus encouraging innovation. But thanks to the high quality of the training system, the social costs of flexibility are contained because of workers’ ability to redeploy their skills across activities. Easy destruction (good for innovation) is socially acceptable and econom-ically efficient only if individuals have acquired the capabilities to confront constant changes and to transfer their skills from one learning setting to another.
4.2.4 Entrepreneurship, clusters, and smart
specialization. While IUS provides an important de-scription of strengths of the Swiss innovation capacity, it of course does not reflect the industrial dynamics that build on the various features of the system.
One important dynamic is an historical trait, apparent throughout the 20th century—the formation, development, and intelligent evolution of specialized clusters that combine research and innovation capacities in a specific field. These clusters ensure their development, thanks to the basis of col-lective skills and knowledge accumulated, « first-rate indus-trial commons » that resist delocalization. Pharmaceuticals, watchmaking, medical technologies, control and measuring instruments, and a few others are the « Wirtschaftswunder », the Swiss economic wonders, to quote the title of a recent work (Breiding and Schwarz 2011). And yet these wonders are not under state control insomuch as they owe nothing to the state. They are the product of research and company dynamics, which develop in close collaboration and generate smart specializations, i.e. specializations generated by an entrepreneurial dynamic that are not rigid but evolve and change as entrepreneurs discover new opportunities (Foray et al. 2010).
Another dynamic, much more recent, is the blossoming of start-ups and young technological companies. This phe-nomenon is present in IUS but not measured for Switzerland because of data issues. This is why it is difficult to assess its importance and magnitude in Switzerland. Anecdotal evidence suggests that a kind of new technology and innovation rush might be emerging, especially around the two Polytechnics in Lausanne and Zu¨rich (Kenward 2011). This is the result of the high density of organizations and institutions involved in the financing of research, de-velopment, the forming of companies, and their growth. The meeting of campuses in a permanent state of efferves-cence with very effective transfer offices, the very high general financial development of the economy, and generous public financing of coaching programmes for new entrepreneurs produce this creative exuberance cur-rently in evidence throughout Switzerland. These are quali-tative facts, and it is not clear whether the start-up phenomenon is a strong aspect of the Swiss innovation capacity (while the dynamic of smart specialization described above is clearly one).
4.2.5 Summary The various building blocks described above —(1) transfer of knowledge and public–private research interactions; (2) size diversity and anchor tenants; (3) skill’s pyramid and labour markets; (4) entre-preneurships, clusters, and smart specialization—are im-portant to know and to study. They encapsulate key processes of knowledge transfer, human capital formation, agglomeration economies, and smart specialization. The way these processes are operating in Switzerland seems to positively impact the whole innovation performance of the country. But some elements of fragility are associated with these various processes: there is a dark side of the virtuous dynamics of size diversity, anchor tenant, and positive external effects (i.e. the potential fragility created by the highest outward R&D intensity among OECD countries); there is a dark side as well of the strong attrac-tion of the country towards the highly skilled workers (i.e. a strong reliance on the global market for highly skilled workers). All these elements of fragility will be discussed below in section 5.
5. What are the evolutions that really matter
for policy? Thinking out of the ‘IUS box’
In this section, we again question and challenge the policy relevance of a few indicators’ trends which are statistically meaningful both as forces that are weakening the Swiss position and as forces that are improving this position. However, it is clear that the potential weaknesses identified above are either not so relevant or will require long-run policy intervention to fix them.
It is obvious that the IUS delivers quite a pretty picture of Switzerland’s innovation performance, in particular for recent years! Moreover, all our statistical estimations do not show real signs of weakening and therefore there is not so much concern about Switzerland losing its leading position in the near future. But again, this is what we can infer from a full development of the statistics within the ‘narrow IUS’ point of view. It is, therefore, useful to conclude this article with some thoughts ‘out of the IUS box’ in order to highlight potential weaknesses that are not easily captured by the IUS framework while they are policy relevant.
5.1 System’s building blocks: where are the vulnerable points?
In section 4, we proposed organizational principles of in-dicators in order to highlight some critical processes that impact the overall Swiss innovation capacity. We identified four processes:
- 1 ‘knowledge and technology transfers’;
- 2 ‘size diversity, anchor tenant and R&D off shoring’; - 3 ‘skills pyramid and labour market’;
- 4 ‘entrepreneurship, clusters and smart specialisations’.
The way these various processes are working and im-pacting the whole innovative performance makes all of them strengths of the system rather than weaknesses. However, potential problems are also likely to arise from these various processes.
The most salient potential problem is located in the building block number 2 and concerns the unintended con-sequence of having several R&D global leaders. This is of course a very good thing (anchor tenant theory) but creates issues about foreign R&D location. Partial evidence tends to suggest that the outward R&D involves complementary assets (to R&D located in the home country), not substitute (Arvanitis and Hollenstein 2012). This means that if those capacities had not been created abroad, they would not exist in any case. However, the question remains whether such R&D offshoring is likely to deprive the home country of some of the externalities described in section 4.2.
In Box 1 we question the stability and robustness of IUS in case of a major R&D relocation outside the country.
Box 1 The impact of a relocation of business activities outside of Switzerland
Switzerland’s R&D position is considered to be sensi-tive to that of a few large multinational companies only. The impact of a hypothetical relocation of R&D activities abroad can be analysed using the IUS framework and data:
Scenario A: 25% of business R&D leaves the country including a 25% decrease in patent applications for both patent indicators. The innovation index would drop to 0.820 which is still significantly above that of Sweden. Scenario B: 50% of business R&D leaves the country including a 50% decrease in patent applications for both patent indicators. The innovation index would drop to 0.794 which is still significantly above that of Sweden.
The results of both scenarios show that Switzerland would still be the most innovative country even if a relatively large share of business R&D activities would be relocated abroad.
More severe scenarios could be constructed:
Scenario C1: a 25% drop in the performance scores: for business R&D expenditures and PCT patent applications and PCT patent applications in societal challenges and trademarks and designs. The innovation index for Switzerland would change into 0.800.
Scenario C2: a 25% drop in the performance scores for the indicators listed under scenario C1 and medium-high-tech product exports and knowledge-intensive services exports. The innovation index for Switzerland would change into 0.782.
Scenario C3: a 25% drop in the performances scores for the indicators listed under scenario C2 and licence and patent revenues from abroad and the share of product/ process innovators and the share of new-to-market and new-to-firm sales. The innovation index for Switzerland would change into 0.768.
Scenario C4: a 25% drop in the performance scores for the indicators listed under scenario C3 and the share of SMEs innovating in-house and the share of SMEs collaborating with others and non-R&D innovation expenditures. The innovation index for Switzerland would change into 0.747.
But only for scenario C4 Switzerland would lose it position as most innovative country to Sweden, but such a scenario is very unlikely to happen.
Another potential problem is linked to the fact that Switzerland is strongly relying on the international highly skilled labour market to secure the human capital supply.
A simple example shows the greater reliance of
Switzerland as compared to countries of similar size: Switzerland and the Netherlands have got roughly the same (high) number of ERC advanced grants in 2012 (re-spectively, 26 and 28). But of the 28 grants going to the Netherlands 22 grantees are Dutch citizens while only 8 grantees of the 26 going to Switzerland are Swiss citizens (ERC 2012).10These numbers are not necessarily ‘bad’ for Switzerland; but they put a strong question mark behind the future evolution of the international labour market for highly skilled people and scientists (Wyckoff and Schaaper 2006).
6. Suggestions for improvements in the light
of the Swiss case
Towards the end of this article, it is useful to use the Swiss case in order to develop some suggestions and ideas about possible improvements of IUS indicator. We suggest two areas for improvement. The first one deals with the produc-tion of the indicator; the second one is concerned with its use.
6.1 On the production side
Of course, every expert in the field would have a different idea about a key dimension which is missing (not measured) and would make the argument that the addition of this dimension would greatly improve the quality of the indicator. It is clear that in the case of Switzerland, the absence of any measure of vocational training is a big failure. Not only is a crucial factor for innovation performance notably in SMEs totally invisible (and this is not a good signal for countries that greatly need to improve their vocational training system) but this also may create a misunderstanding and a misinter-pretation of the rather weak performance of Switzerland on the tertiary education indicator (our comment above, section 4.1). Measuring and integrating vocational training in IUS is probably an unavoidable task to improve the relationship between the indicator and the underlying concept of interest (and this would be true for all countries, not only Switzerland).
6.2 On the user side
IUS needs to be taken not so much as a tool capable to generate one single number allowing to produce a ‘clear’ rankings but rather as a heuristic framework to identify further needs for statistical and case study-based investi-gations. In others words, investigations and reflections should not stop at the production of the IUS for a given country but start with it!
For example, in Box 1 we use IUS to predict that the Swiss innovation capacities is quite robust and resilient in the sense that any major R&D relocation outside of the country will not alter the leadership position of Switzerland in IUS. This is an interesting result telling something about a good property of the system which seems to be mostly independent of the actions and strategies of any one firm. However, Swiss policymakers should not just take this result and sleep! What IUS is showing here is a statistical result which has obvious limi-tations. The best of what IUS can do here is to stimulate further research, for example, to compare this prediction with what happened during the last periods after a couple of R&D relocation outside of the country (such as Merck-Serono or Novartis moves). This is a good epistemology to check systematically what the statistical framework
predicts with a few real-world cases which have
happened in most recent history. This is the kind of inves-tigation that results and insights obtained within the IUS statistical framework should stimulate.
7. Conclusion
Switzerland is one of the innovation leaders and the most innovative country in the IUS due to a strong all-round performance on most of the IUS indicators. Potential areas of weakness include the educational at-tainment level of the Swiss population, R&D expend-itures by the public sector, venture capital, non-R&D innovation expenditures, the share of SMEs innovating in-house or collaborating with others, and exports of knowledge-intensive services.
Switzerland’s position as most innovative country is a robust finding which does not depend on the IUS weighting scheme of assigning equal weights to each of the IUS indicators. Simulations using different weighting schemes favouring other countries’ best indicators keep Switzerland in first rank and only in a few cases the
country would drop to second rank. Simulations
allowing for a fixed increase (decrease) for each indicator in the performance of the best (worst) country show that the impact on the Swiss IUS innovation index is minor, except for the share of population aged 30–34 years with completed tertiary education, PCT patent applications and the employment share in knowledge-intensive activities.
Forecasts of current Swiss growth performance up until 2020 show that for most indicator performance is expected
to improve.11Only for venture capital, PCT patent appli-cations, and exports of knowledge-intensive services we expect that performance for Switzerland will deteriorate.
Currently there are no signs that the Swiss leading position is under threat. On the contrary, Switzerland has managed to improve its performance relative to the other IUS innovation leaders.
In this article, we have also tried to think out of the IUS box in order to identify fundamental processes and struc-tures that are hard to observe and measure but might strongly impact the overall innovation performance of the country and should therefore represent critical targets for innovation policy. We tried to explore a ‘factors’ space’ between the space of micro-evidence and data (as repre-sented by IUS as well as the Community Innovation Survey) and the space of narratives and success stories as collected in journalistic works (such as what is presented in
the book ‘Wirtschaftswunder’). We have therefore
identified important building blocks that encapsulate key processes of human capital formation, knowledge transfer, agglomeration economies, and smart specialization. The way these processes are operating in Switzerland seems to positively impact the whole innovation performance of the country—so they need to be carefully analysed and further evidence-based policy research needs to be carried out for each of them.
Supplementary data
Supplementary data is available at REEVAL Journal online.
Notes
1. The authors gratefully thank two anonymous referees for their very useful comments and suggestions. 2. http://ec.europa.eu/enterprise/policies/innovation/
policy/innovation-scoreboard/index_en.htm
3. The IUS 2011 report has been used as at the time of writing this was the most recent report available. 4. Full details are available from the authors upon
request.
5. This graph is similar to Fig. 5 in the IUS 2011 report. 6. The weakness of the indicator on SME’s collaborative activities in the case of Switzerland seems to be due to the fact that the Swiss data measures collabor-ation according to a very narrow definition (R&D cooperation) while most other countries have a broader definition that includes a wide range of ‘networking’ activities (see Arvanitis and Hollenstein 2012: 54–5).
7. In addition to Conti and Gaule´ evidence about the efficiency of Swiss TTO (relative to their European equivalents), Arvanitis et al. (2008) use Swiss data to show that in Switzerland, transfer of technology
activities with research institution (and/or universities) seem to improve the innovation performance of firms considerably both in terms of sales of new or consid-erably improved products. The most recent survey undertaken by B. Hotz produces similar conclusions about the quality and efficiency of the knowledge transfer activities in Switzerland.
8. The classical and initial anchor tenant example is about the large department store in a retail shopping centre that creates demand externalities for the other smaller shops. The anchor tenant theory has been extended to the context of innovation by Agrawal and Cockburn (2003).
9. The great success of professional training in Switzerland in turn explains the relative weakness of the two IUS indicators that measure educational achievement by young people. The weak scores should not be interpreted too negatively (section 4.1) 10. These numbers cannot be taken as only reflecting a
stricter citizenship policy in Switzerland. Although we could not investigate very deep in exploring the history of citizenship for every ‘Dutch’ winner (for legal reasons), it is clear (from the names of the winners) that at least half of the Dutch winners are not recent migrants who would have acquired the Dutch citizenship recently.
11. These forecasts are not presented in this article but are available from the authors upon request.
References
Agrawal, A. and Cockburn, I. (2003) ‘The anchor tenant hy-pothesis: exploring the role of large, local, R&D intensive firms in regional innovation systems’, International Journal of Industrial Organization, 21: 1227–53.
Agrawal, A., Cockburn. I and Oettl, A. (2010) Innovation and the Firm Size Diversity Hypothesis, Preliminary Draft, Boston University.
Arundel, A. and Hollanders, H. (2005) 2005 European Innovation Scoreboard - Policy, Indicators and Targets: Measuring the Impacts of Innovation Policies. Brussels: European Commission, DG Enterprise.
Arvanitis, S. and Hollenstein, H. (2012) Innovationsaktivita¨ten in der Schweizer Wirtschaft–Determinanten, Auswirkungen, Fo¨rderpolitik, Reihe, Kompaktwissen, Band 15, Ru¨egger Verlag, Zu¨rich/Chur.
Arvanitis, S., Sydow, N. and Woerter, M. (2008) ‘Do specific forms of university-industry knowledge transfer have different impacts on the performance of private enterprises? An empir-ical analysis based on Swiss data’, Journal of Technology Transfer, 33: 504–33.
Breiding, R. J. and Schwarz, G. (2011) Wirtschaftswunder Schweiz–Ursprung und Zukunft eines Erfoldsmodells. Zu¨rich: Verlag Neue Zu¨rcher Zeitung.
Conti, A. M. and Gaule´, P. (2009) ‘Is Switzerland doing well in university technology transfer?’, College of Management, draft report, EPFL.
Cornell University, INSEAD and WIPO (2014) The Global Innovation Index. Ithaca and Geneva: Fontainebleau.
Erawatch (2011) http://erawatch.jrc.ec.europa.eu/erawatch/ opencms/information/country_pages/ch/country.
ERC (2012) ERC Advanced Grants 2012 Outcome: Indicative Statistics. Brussels: European Research Council.
European Commission (2012) Internationalisation of Business Investments in R&D and Analysis of Their Economic Impact. DG Research and Innovation, EUR 25195.
Foray, D. (2007) ‘Enriching the indicator base for the eco-nomics of knowledge, in OECD’, Science, technology and Innovation Indicators in a Changing World. Paris: OECD. Foray, D. and Van Ark, B. (2008) ‘Knowledge for Growth:
European issues and policy challenges’, in Knowledge for Growth. European Commission, EUR 23725.
Foray, D., David, P. A. and Hall, B. (2010) ‘Smart specialisation: the concept’, Knowledge for Growth: Prospects for Science, Technology and Innovation. European Union, EUR 24047. Furman, J., Porter, M. and Stern, S. (2002) ‘The determinants
of national innovation capacity’, Research Policy, 31: 899–933.
Hollanders, H. and Janz, N. (2013) ‘Scoreboards and indicator reports’. In: Gault, F. (ed.) Handbook of Innovation Indicators and Measurement, pp. 279–97. Cheltenham: Edward Elgar. Hollanders, H. and Tarantola, S. (2011) ‘Innovation Union
Scoreboard 2010 - methodology report’, INNO Metrics 2011-2012 report. Brussels: European Commission, DG
Enterprise http://ec.europa.eu/enterprise/policies/innovation/ files/ius-methodology-report_en.pdf.
Jaffe, A. (2002) Measuring Knowledge, Nsf-Oecd Seminar on The Knowledge Economy, Washington DC.
Kenward, M. (2011) ‘Swiss innovation is on a roll’, Science/ Business, originally published on www.sciencebusiness.net on 16 May 2011.
Mu¨hlemann, S., Schweri, J., Winkelmann, R. and Wolter, S. (2007) ‘An empirical analysis of the decision to train appren-tices’, Labour, 21: 419–41.
OECD (2012) Science, Technology and Industry Outlook 2012. Paris: OECD.
Saint Paul, G. (2002) ‘Employment protection, international specialisation and innovation’, European Economic Review, 46: 375–95.
Sajeva, M., Gatelli, D., Tarantola, S. and Hollanders, H. (2005), EIS Methodology Report, 2005 Trend Chart report. Brussels: European Commission, DG Enterprise.
Wolter, S., Mu¨hlemann, S. and Schweri, J. (2003) Why Some Firms Train Apprentices and Many Others Do Not, Bonn: IZA DP no. 916.
Wyckoff, A. and Schaaper, M. (2006) ‘The changing dynamics of the global market for the highly skilled’. In: Kahin. and Foray. (eds) Advancing Knowledge and the Knowledge Economy. Cambridge, MA: MIT Press.