HAL Id: hal-02109053
https://hal.archives-ouvertes.fr/hal-02109053
Submitted on 24 Apr 2019
HAL is a multi-disciplinary open access
archive for the deposit and dissemination of
sci-entific research documents, whether they are
pub-lished or not. The documents may come from
teaching and research institutions in France or
abroad, or from public or private research centers.
L’archive ouverte pluridisciplinaire HAL, est
destinée au dépôt et à la diffusion de documents
scientifiques de niveau recherche, publiés ou non,
émanant des établissements d’enseignement et de
recherche français ou étrangers, des laboratoires
publics ou privés.
Transit features detected by the CoRoT/Exoplanet
Science Team
Magali Deleuil, Claire Moutou, Juan Cabrera, Suzanne Aigrain, Francois
Bouchy, Hans J. Deeg, Pascal Bordé
To cite this version:
Magali Deleuil, Claire Moutou, Juan Cabrera, Suzanne Aigrain, Francois Bouchy, et al.. Transit
features detected by the CoRoT/Exoplanet Science Team. Annie Baglin. The CoRoT Legacy Book,
pp.117-122, 2016, 978-2-7598-1876-1. �10.1051/978-2-7598-1876-1.c031�. �hal-02109053�
c
The authors, 2016
DOI:10.1051/978-2-7598-1876-1.c031
III.1
Transit features detected
by the CoRoT/Exoplanet Science Team
M. Deleuil
1, C. Moutou
1, J. Cabrera
2, S. Aigrain
3, F. Bouchy
1, H. Deeg
4, P. Bord´
e
5,
and the CoRoT Exoplanet team
1 Aix Marseille Universit´e, CNRS, LAM (Laboratoire d’Astrophysique de Marseille) UMR 7326, 13388, Marseille, France 2 Institute of Planetary Research, German Aerospace Center, Rutherfordstrasse 2, 12489 Berlin, Germany 3 Department of Physics, Denys Wilkinson Building Keble Road, Oxford, OX1 3RH 4 Instituto de Astrofisica de Canarias, 38205 La Laguna, Tenerife, Spain and Universidad de La Laguna, Dept. de Astrof´ısica,
38206 La Laguna, Tenerife, Spain
5 Institut d’astrophysique spatiale, Universit´e Paris-Sud 11 & CNRS (UMR 8617), Bˆat. 121, 91405 Orsay, France
1. Introduction
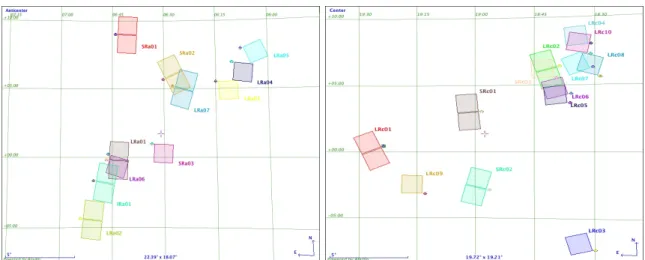
CoRoT has observed 26 stellar fields located in two oppo-site directions for transiting planet hunting. The fields ob-served near 6h 50m in right ascension are referred as (galac-tic) “anti-center fields”, and those near 18h 50m as “center fields”. The observing strategy consisted in staring a given star field for durations that ranged from 21 to 152 days. The mission profile indeed allowed some flexibility and thus the exact observation duration and the number of point-ings per year have been revised along the course of the mission in function of the scientific needs. As illustrated in Fig. III.1.1 which shows the location of the 26 fields, it allowed the re-observation of the same field a few years apart, as well exemplified by the SRc03 field. This point-ing was indeed dedicated to the re-observation of a spoint-ingle transit of CoRoT-9b (Deeg et al. 2010) and thus lasted for five days only. The various fields can thus present an over-lap. As a consequence some targets were observed twice or even three times. Most of the time the re-observations was carried out with a slightly different instrumental configura-tion. In particular, the photometric mask used to perform the on-board photometric measurements could be different from one observation to the other which impacts mostly on the contamination rate inside the photometric mask. Typi-cal targets in the exoplanet channel have magnitude in the range 11 to 16 but some could be brighter and thus exhibit some level of saturation.
In total the instrument has provided us 176 802 light curves with a time sampling of 32 s or 8 min. Taking into account the fact that some stars have been observed more than a single time, this corresponds to a total of 163 665 stars. According to the revised exoplanet input catalog, 66 710 of these targets have been attributed a luminos-ity class V. This number nearly double and increases to 109 940 if one classifies as dwarf stars those with luminos-ity classes IV and V. The dwarf – giant identification was based on a simple color-mag separation (Deleuil et al.2009).
While this is reliable on a statistical point of view, individ-ual targets could be misclassified (Damiani et al. this book) and these numbers are mostly indicative of the overall stel-lar population properties. They show however that, in a given field, classes V and IV represent the majority of the targets. Figure III.1.2 displays how these stars classified as class IV and V distribute over spectral types F, G, K, and M. G-type are the most numerous, followed by F-type. This results from a careful selection of the target stars in the fields, in order to maximize the planet detections. There are however noticeable differences from one field to another due to variations in the stellar populations, given their po-sition in the Galaxy, and from different reddening between the fields.
2. CoRoT planets
Compared to the overview given by Moutou et al. (2013), 12 new planets have been published or announced in con-ferences and some robust planet candidates are still in the final stage of the validation process. Today CoRoT ac-counts for 34 transiting planets detected in the CoRoT light curves, secured and fully characterized thanks to an intense and efficient accompanying ground-based follow-up program.
Among these 34 objects labelled as planets, there are in fact 2 brown dwarfs, CoRoT-15b (Bouchy et al. 2011) and CoRoT-33b (Csizmadia et al. 2015) and one object, CoRoT-3b (Deleuil et al. 2008) whose exact nature, light brown dwarf or massive planet, remains an open question. All the other new planets (Almenara et al. 2013; Cabrera et al. 2015) belong to the close-in giant popula-tion except CoRoT-22b (Moutou et al. 2014), whose ra-dius is 4.88 ± 0.17 R⊕. This planet, which has an
or-bital period of 9.7566 ± 0.0012 days, is the second smallest in size after CoRoT-7b but, in this case, the faintness of its host star prevented us from a precise estimate of its
The CoRoT Legacy Book
Fig. III.1.1. Position of all the faint stars fields observed by CoRoT in the anti-centre (left) and the centre (right) directions.
Fig. III.1.2. Distribution of class IV and V over F, G, K, and M types of all targets observed in the exoplanet fields.
mass. We could estimate only an upper limit of its mass of 49M⊕through radial velocity measurements. The dearth of
small-size planets in the CoRoT field reported by Bonomo et al. (2012) is thus still holding. These authors estimated that, compared to the frequency of Kepler candidates, the CoRoT planet yield in this small-size planet domain is too low by more than a factor two. Among the various reasons, this discrepancy could have its origin in differences in the stellar population the two missions have observed. In addi-tion, a fraction of these small-size planets might be missed due to discontinuities in the CoRoT light curves caused by hot pixels. Now that the final version of the CoRoT pipeline corrects for these discontinuities, it would be interesting to check if it results in an increase of the number of detections, especially in the small-size domain.
While multi-planet systems account for about 40% of the Kepler Objects of Interest (KOI), only one multi-planet transiting system, CoRoT-24 (Alonso et al. 2014) has been reported by CoRoT. This system hosts 2 Neptune-sized planets. The second multi-planet system is CoRoT-7 (Queloz et al.2009). Its second planet was however not de-tected in the CoRoT light curve but its existence has been definitely established from the intensive radial velocity cam-paigns carried out to measure CoRoT-7b’ mass (Haywood et al. 2014). The observed lack of multi-planet detections is consistent with Kepler’s results, which show that these systems are indeed numerous but in the low mass regime of Neptune and Earth size planets, and in the long orbital
period range, a domain which is beyond the limit of CoRoT sensitivity.
3. Detection and classification
of transit-like features
3.1. Detection and vetting
Before arriving at a well-identified planet, there is long path that starts at the detection level and requires complex in-vestigations. There was no official transit detection pipeline at mission level. Instead, the detection has been carried out in parallel with various algorithms from different partner institutions, and the results were gathered, compared, and merged by the CoRoT detection team. Once detected, the transit-like features were divided in obvious eclipsing bi-naries and planet candidates. For each run, these lists of candidates were ranked manually, and then compared by the team members. Each candidate was individually dis-cussed with its light curve manually inspected, to better assess a likely origin of the signal, stellar or planetary, and to identify obvious false alarms. With more than ten times fewer light curves to inspect than the total number per run (12 000 at once, when the two CCDs were still in operation), this manual and interactive approach was still feasible. It had the advantage to enable the use of different methods, some that were more appropriate than others for the de-tection of certain types of transits. It also allowed to train the detection team on light curve analyses especially dur-ing the first years after the launch, when the instrumental effects were not completely understood and corrected for. Each of the detection algorithms run in parallel indeed, and had its own set of light-curve pre-conditioning filters. The downside is, that it makes it difficult to provide an overall assessment of the mission’s sensitivity to transits of different depths and periods. With time, the number of al-gorithms used in the transit search has decreased and the procedures have converged, the differences being mostly in the light curve filtering and detrending methods that were used. A description of the approches used for the analysis of CoRoT light curves is given in Carpano et al. (2009); Cabrera et al. (2009); Erikson et al. (2012); Carone et al. (2012); Cavarroc et al. (2012).
Two phenomena are the main sources of false detections at instrumental level:
1. hot pixels that cause discontinuities in the light curves. They can be at the origin of false detections but also might prevent the detection as shown by Bonomo et al. (2012). It also made more difficult a full automation of the detection.
2. a nearby bright eclipsing binary whose light leaks over one or more columns of pixels and leaves its photomet-ric imprint in the light curve of neighbor targets. The much shallower depth in the contaminated target can leave one to believe to a small-size planet candidate and a systematic verification is thus of prime impor-tance. Such false positives can be however identified by phase folding the light curve of the target and those of its closest neighbors at the period of the detected transit signal.
This process ended up with a single list of planet-candidates per field, ranked on a simple priority scale that was then provided to the follow-up team. Those with the highest pri-ority have been further observed with various ground-based facilities so that a planet could be securely identified and characterized.
In total, over the mission lifetime, transit-like signals have been detected in a little bit more than 4000 light curves for all the exo-fields, excepting SRc03, which was left aside of the detection process. Once false detections, variables, and ghost signals were filtered out, we ended up with 3045 remaining transit events. 80% of these events were classi-fied as binaries in a first round, based on the depth of their eclipses, on the detection of a secondary eclipse or from off-eclipse light curve modulations. 594 were flagged as candi-dates worth for follow-up observations. Among them were 18 candidates that were detected in two fields. This total number also includes 27 single transit events whose param-eters, depth and duration, are compatible with a planetary scenario with a planet orbit longer than the duration of the run.
3.2. Assessing the nature of the candidates
The final CoRoT catalog of all the transit events identified in the CoRoT light curves by the exoplanet teams was fi-nally established through a late but homogeneous analysis of all of them. To that purpose, starting from the first set of parameters for all transits events, namely, the epoch, the period, the transit depth and duration, we used an auto-mated software developed and implemented at Cambridge. Based on the Mandel & Agol (2002) formalism, the tran-sits were fitted with five free parameters: the period P , the transit epoch T0, the planet-to-star radius ratio Rp/Rs,
the system scale a/Rs, and the impact parameter b. The
quadratic limb-darkening coefficients ua and ub are kept
fixed at 0.44 and 0.23 respectively, the values given by Sing (2010) for a Sun-like star in the CoRoT bandpass. Using the equations of Seager & Mall´en-Ornelas (2003), which do not take limb-darkening into account, and are thus approximate only, additional parameters that were derived were the or-bital inclination, the stellar density, the transit depth, and the transit durations T14and T23between outer and inner
contacts, respectively.
Detection is a first important step, but the most touchy part is to assess which candidates have the highest chance being a planet. The ranking of the candidates indeed di-rectly impacts the follow-up strategy and the amount of telescope time that becomes devoted to the confirmation of the candidates’ nature and the characterization of proven planets. The approach that was finally chosen in the last years of the mission, was to have each candidate robustness evaluated over a series of criteria. The outcomes of this eval-uation are recorded in the form of six binary flags, which are also included in the final CoRoT/exoplanet catalog. The flags are:
– Fdet: low detection significance, set if the transit depth
in the white light curve is less than 5 times correspond-ing uncertainty;
– Fsec: secondary eclipse detected, set if the secondary
eclipse depth (at phase 0.5) is more than 3 times corre-sponding uncertainty;
– Fodd/even: odd/even depth differences, set if if the
odd/even depth ratio is more than 1.1 at 3σ confidence level;
– Fcol: strong colour dependence, set if the ratio of the
deepest to the shallowest of the transits in the 3 colour channels is more than 1.5 at 3σ confidence level; – FV: V-shaped transit, set if the best-fit transit model is
grazing;
– Flong: transit too long, set if the best-fit stellar radius
is >2 R at 3σ confidence level.
While the first four flags are directly related to the transit fit, the lasts two are associated to stellar physical parame-ters. Because the spectral classification was judged poorly reliable, we did not use it for candidate evaluation. Instead, stellar radii were derived from stellar densities based on the transit-parameters and assuming a Mass-Radius relation: R?= M?0.8. Note however that these flags were intended for
a first order, quick-look sorting of the candidates: they are by no means unequivocal, in the sense that a real planetary candidate could have one or more flag set (see Sect.5), and many candidates, which were later found to be astrophys-ical false alarms, had none. All the candidates, including the planets and some binaries that were rejected from the candidates list in a second level analysis, have thus been automatically re-analyzed with this tool.
The period distribution of the candidates peaks around 2.2 days but extends up to 40 days with some candidates at greater orbital period. 75% of the detected events have an orbital period below 10 days, as expected for the population of massive planets which dominates the CoRoT planets. The depth distribution of candidates shows a maximum at 0.125%, with 60% of the candidates having a depth of less than 0.5%; more details will be given in Deleuil et al., in prep.).
3.3. Eclipsing binaries classification
Because binaries come as a natural by-product, the CoRoT catalog also provides information related to those that were identified in the CoRoT light curves. Prior to the final transit fitting process, binaries were visually classified in 4 sub-classes:
1. eclipsing binaries with a detected secondary eclipse at phase 0.5;
The CoRoT Legacy Book
Table III.1.1.Summary of the transit events detected in the CoRoT light curves.
Binaries
(1) (2) (3) (4) 1322 282 167 664 Candidates status after follow up (5) (6) (7) planets 134 188 253 34
Notes. (1) eclipsing binaries with a detected secondary eclipse at phase 0.5; (2) eccentric eclipsing binaries with a detected sec-ondary eclipse not at phase 0.5; (3) eclipsing binaries with no secondary eclipse detected; (4) contact binaries; (5) contami-nating eclipsing binaries; (6) eclipsing binaries; (7) candidates whose nature is still unresolved;
2. eccentric eclipsing binaries with a detected secondary eclipse not at phase 0.5;
3. eclipsing binaries without detected secondary;
4. contact binaries that present no clear eclipse but a no-ticeable modulation of their light curve.
While for the first three sub-classes the complete fitting process was performed with the same tool as the one used for the planetary transit parameters, for the last class the catalog provides the epoch and period of the binary signal only. The final count of the various classes of binaries found in the observed fields is given in TableIII.1.1.
4. Follow-up observations
of the candidates
The CoRoT exoplanet program has been supported by a large accompanying ground-based observation program (Deleuil et al. 2006; Bouchy et al. 2009; Deeg et al. 2009; Guenther et al. 2013). This approach has the advantage to allow to identify false positives, to fully secure planets and to determine their parameters and properties. On the other hand, the complete screening process has sometimes required more than one year for some of the candidates (e.g. Moutou et al. 2009; Cabrera et al.2009).
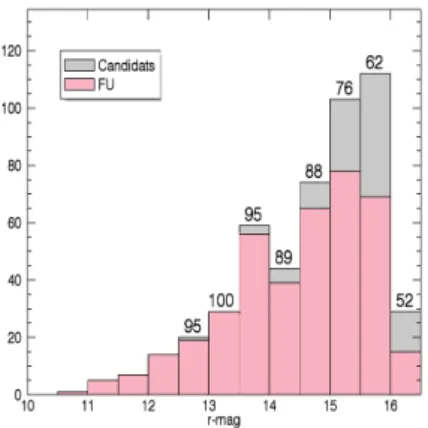
In total, 435 candidates among the 595 (73%) have been subject to ground-based complementary observations. They represent 82.2% in the anti-center and 68.3% in the center fields. As Fig. III.1.3 shows, follow-up observations have been carried out over the whole range of candidate mag-nitudes but there is a marked dependency on the targets magnitude in follow up completeness. Nearly all the candi-dates in the range 12 to 14 have been observed, but this de-creases to 50% completeness for very faint stars with r-mag > 15.5. There are also differences from one field to another in terms of completeness. The percentage of targets that were observed from ground is only 38% for the LRc06 field while 100% of the candidates have been observed in the LRa02. This is explained by both the distribution of candi-dates in magnitude from one field to another in addition to the fact that earlier fields were targeted during more than 3 observation seasons.
Fig. III.1.3. r-mag distribution of candidates that received follow-up observa- tions (pink) compared to the overall candi-date distribution. The number at the top of the bins give the % of candidates observed by ground-based facilities in this bin.
Based on results achieved through follow-up observa-tions but also from the second level of their light curve analysis which allowed to identify false detections and binaries, planet candidates can be divided in 4 classes:
1. Contaminating eclipsing binaries (CEB) which corre-spond to configurations in which the source of the tran-sit has been identified as an eclipsing binary indepen-dent of the target, but whose light contributes to the one measured in CoRoT’s photometric aperture. 2. Eclipsing binaries (EB), where the source of the
tran-siting signal coincides with the target. Their nature has been assigned through a much deeper analysis of the light curve or through radial velocity measurements. The later allow to identify spectroscopic binaries (SB1 or SB3) in a very few measurements.
3. Planets whose nature has been secured thanks to com-plementary observations.
4. Unresolved candidates. They could be due either to the fact that a candidate was not followed up or because the follow up observations remained un-conclusive. In this category we found (i) faint stars that challenge ra-dial velocity measurements and that are responsible for a large part of this class; (ii) host-stars whose nature is either a hot star or a fast rotator, two characteristics that prevent assessing the nature of the detected com-panion with the usual current techniques; (iii) bright targets for which ground-base time series observations did not point out any contaminating star as the source of the signal but for which no clear radial velocity signal could be detected either.
FigureIII.1.4displays this distribution of the filtered candi-dates. Unresolved cases account for 41.5% of the candicandi-dates. Eclipsing binaries are the main source of false positives with 30.9%, then contaminating eclipsing binaries represent 22.0%. Planets account for 5.1% and brown dwarfs for 0.5%, assuming that CoRoT-3b belongs to this class. There is no marked difference in the occurrences of the various classes as a function of the observing direction (galactic enter or antic enter). This should be investigated in more details, but the absence of clear difference is also consistent with similar counts in the F, G, K and M-type targets of class V in the two directions (25 055 in the anti-centre fields and 22 157 in the centre fields).
Fig. III.1.4. Nature of the candidates according to follow-up observations and a second level analysis of their light curve.
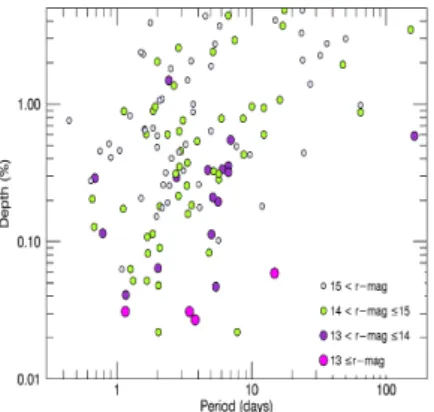
Fig. III.1.5. Distribution in the Depth-Period diagram of the unresolved can- didates whose host-star has an estimated lu-minosity class V. The size and the color of the symbols vary according to the r-mag range.
Among the total number of resolved configurations, eclipsing binaries account for 52.7%, CEBs for 37.5% and planets/brown dwarfs are 9.8%. Considering among them those which were identified through follow-up observations only, it gives a false positive rate of 86% for both direc-tions and an effectiveness of ground-based observadirec-tions to address the nature of the transiting bodies of 64%. Despite the small number of brown dwarfs, if we separate these from the planets, and if one assumes that unresolved candidates would distribute with the same proportions between eclips-ing binaries, CEBs, planets and brown dwarfs, it gives 22 planets and 2 brown dwarfs that may still be hidden in this sample. The difficulty in confirming these planets is mostly coming from the limited performance of follow-up observa-tions for these typically faint targets.
As shown on Fig. III.1.5, among the 67% of the unre-solved candidates that have been classified as dwarf (lumi-nosity class IV or V) most of them (85%) have a r-mag ≥ 14. For Jupiter-size planets radial velocity measurements remain difficult at the faint end of the CoRoT magnitude range (typically for r-mag > 14.5). For those whose host-star is brighter, the domain of Neptune-size planets and smaller is still challenging the current spectrograph per-formances. The later is well exemplified by CoRoT-22b (Moutou et al. 2014) whose nature could not be fully se-cured by radial velocity measurements and ground-based imaging and required a complex process of planet validation carried out with the PASTIS software (Diaz et al. 2014).
Fig. III.1.6.Stacked histogram of the percentage of candidates in a given class as a function of the number of flags received.
5. Assessing the classification
of the candidates
The large follow-up effort carried out on the candidates al-lows to check the robustness of the flagging process. To that purpose, we compared the flags attributed to each candidats to the outcomes of follow up observations. For each class of candidates as defined in Sect. 4, we checked their distribution over the number of flags. Figure III.1.6
shows how the various classes of candidates, including plan-ets, distribute as a function of the number of flags. While for the 3 classes, eclipsing binaries, contaminating eclipsing binaries and unresolved, their distribution remains nearly constant over the three first bins (2 flags or less), then sig-nificantly decreases, the CoRoT planets included in this analysis were allocated no flag or just one. A verification of the planets with triggered flags shows that the flags they received are well related to a real characteristics of the sys-tems (TableIII.1.2). A reliable spectral typing of the targets in the stellar fields observed in the faint stars channel may have allowed to remove the transit duration flag for some of the planets, but those related to the presence of a shallow secondary or a grazing transit would have remained un-changed. According to Fig. III.1.6, follow-up observations that would have concentrated on the candidates that re-ceived at the most one flag, that is 64% of the candidates, would not have missed any planet around a solar-like star.
6. Conclusions
A full catalog of all the transiting features identified in the CoRoT light curves during the mission lifetime is to be re-leased (Deleuil et al., in prep.). It includes homogeneously derived parameters, validation diagnostics and a summary of the outcome of follow-up observations when they were carried out on planet candidates. The tool used for the validation process over basic tests, based on a simple bi-nary flag system, has been also benchmarked against can-didates for which follow-up observations were performed. With more than 400 candidates that were the targets of complementary observations, CoRoT data provides a good opportunity to set up tools to be used for an automated and reliable ranking of candidates of future space missions.
The CoRoT Legacy Book
Table III.1.2. CoRoT planets with one flag triggered. Planet Flag Host-star R?
spectral type [R ] CoRoT-1 secondary G0V 1.11 ± 0.05 CoRoT-10 V-shape K1V 0.79 ± 0.05 CoRoT-17 duration G5V 1.19+0.14−0.13 CoRoT-22 color-depth G0V 1.136+0.038−0.09 CoRoT-24 secondary K1V 0.86 ± 0.09 CoRoT-25 V-shape F9V 1.19+0.14−0.03 CoRoT-26 duration G5IV 1.79+0.18−0.09 CoRoT-28 duration G8/9IV 1.78±0.11 References. (1) Barge et al. (2008); (2) Bonomo et al. (2010); (3) Csizmadia et al. (2011); (4) Moutou et al. (2014); (5) Alonso et al. (2014); (6) Almenara et al. (2013); (7) Cabrera et al. (2015)
In addition to the last planets pending to be published soon, among the candidates whose status is not resolved, there are still potentially some 20 planets and a few brown dwarfs to be identified as such. Some would require a radial velocity precision that is beyond those of actual spectro-graphs. A new generation of high precision spectrographs may help to secure the nature of some of these candidates, some being potentially small mass planets.
Acknowledgements. The French exo-team thanks the CNES for its continuous support before, during and after CoRoT operations, es-pecially for the grants provided for post docs who worked on tasks related to the mission. The authors wish to thank the staff at ESO La Silla Observatory for their support and for their contribution to the success of the HARPS project and operation. H.D. acknowledges support by grant AYA2012-39346-C02-02 of the Spanish Secretary of State for R&D&i (MINECO).
References
Almenara, J. M., Bouchy, F., Gaulme, P., et al. 2013, A&A, 555, A118
Alonso, R., Moutou, C., Endl, M., et al. 2014, A&A, 567, A112
Barge, P., Baglin, A., Auvergne, et al. 2008, A&A, 482, 17 Bonomo, A. S., Santerne, A., Alonso, R., et al. 2010, A&A,
520, 65
Bonomo, A. S., Chabaud, P. Y., Deleuil, M., et al. 2012, A&A, 547, A110
Bouchy, F., Moutou, C., Queloz, D., et al. 2009, IAU Symp., 253, 129
Bouchy, F., Deleuil, M., Guillot, T., et al. 2011, A&A, 525, A68
Cabrera, J., Fridlund, M., Ollivier, M., et al. 2009, A&A, 506, 501
Cabrera, J., Csizmadia, S., Montagnier, G., et al. 2015, A&A, 579, A36
Carone, L., Gandolfi, D., Cabrera, J., et al. 2012, A&A, 538, A112
Carpano, S., Cabrera, J., Alonso, R., et al. 2009, A&A, 506, 491
Cavarroc, C., Moutou, C., Gandolfi, D., et al. 2012, Ap&SS, 337, 511
Csizmadia, S., Moutou, C., Deleuil, M., et al. 2011, A&A, 531, A41
Csizmadia, S., Hatzes, A., Gandolfi, D., et al. 2015, A&A, 584, A13
Deeg, H. J., Gillon, M., Shporer, A., et al. 2009, A&A, 506, 343
Deeg, H. J., Moutou, C., Erikson, A., et al. 2010, Nature, 464, 384
Deleuil, M., Moutou, C., Deeg, H. J., et al. 2006, ESA SP, 1306, 341
Deleuil, M., Deeg, H. J., Alonso, R., et al. 2008, A&A, 491, 889
Deleuil, M., Meunier, J. C., Moutou, et al. 2009, AJ, 138, 649
D´ıaz, R. F., Almenara, J. M., Santerne, A., et al. 2014, MNRAS, 441, 983
Erikson, A., Santerne, A., Renner, S., et al. 2012, A&A, 539, A14
Guenther, E. W., Fridlund, M., Alonso, R., et al. 2013, A&A, 556, A75
Haywood, R. D., Collier Cameron, A., Queloz, D., et al. 2014, MNRAS, 443, 2517
Mandel, K., & Agol, E. 2002, ApJ, 580, L171
Moutou, C., Pont, F., Bouchy, F., et al. 2009, A&A, 506, 321
Moutou, C., Deleuil, M., Guillot, T., et al. 2013, Icarus, 226, 1625
Moutou, C., Almenara, J. M., D´ıaz, R. F., et al. 2014, MN-RAS, 444, 2783
Queloz, D., Bouchy, F., Moutou, C., et al. 2009, A&A, 506, 303
Seager, S., Mall´en-Ornelas, G. 2003, ApJ, 585, 1038 Sing, D. K. 2010, A&A, 510, A21