HAL Id: hal-01644030
https://hal.archives-ouvertes.fr/hal-01644030
Submitted on 21 Nov 2017HAL is a multi-disciplinary open access archive for the deposit and dissemination of sci-entific research documents, whether they are pub-lished or not. The documents may come from teaching and research institutions in France or abroad, or from public or private research centers.
L’archive ouverte pluridisciplinaire HAL, est destinée au dépôt et à la diffusion de documents scientifiques de niveau recherche, publiés ou non, émanant des établissements d’enseignement et de recherche français ou étrangers, des laboratoires publics ou privés.
Distributed under a Creative Commons Attribution - NonCommercial - NoDerivatives| 4.0 International License
analogs on metastasis of 4T1 mouse mammary gland
cancer
Artur Anisiewicz, Agata Pawlik, Beata Filip-Psurska, Eliza Turlej, Stanislaw
Dzimira, Magdalena Milczarek, Katarzyna Gdesz, Diana Papiernik, Joanna
Jarosz, Dagmara Klopotowska, et al.
To cite this version:
Artur Anisiewicz, Agata Pawlik, Beata Filip-Psurska, Eliza Turlej, Stanislaw Dzimira, et al.. Un-favorable effect of calcitriol and its low-calcemic analogs on metastasis of 4T1 mouse mammary gland cancer. International Journal of Oncology, Spandidos Publications, 2018, 52 (1), pp.103-1026. �10.3892/ijo.2017.4185�. �hal-01644030�
Abstract. Low vitamin D status is considered as a risk factor
for breast cancer and has prognostic significance. Furthermore, vitamin D deficiency increases after adjuvant cancer therapy, which alters bone metabolism increasing the risk of osteopo-rosis. It is now postulated that vitamin D supplementation in breast cancer treatment delays the recurrence of cancer thereby extending survival. We evaluated the impact of calcitriol and its low-calcemic analogs, PRI-2191 and PRI-2205, on the tumor growth, angiogenesis, and metastasis of 4T1 mouse mammary gland cancer. Gene expression analysis related to cancer invasion/metastasis, real-time PCR, ELISA, western blotting, and histochemical studies were performed. In vitro studies were conducted to compare the effects of calcitriol and its analogs on 4T1 and 67NR cell proliferation and expression of selected proteins. Calcitriol and its analogs increased lung metastasis without influencing the growth of primary tumor. The levels of plasma 17β-estradiol and transforming growth factor β (TGFβ) were found to be elevated after treatment. Moreover, the results showed that tumor blood perfusion improved and osteopontin (OPN) levels increased, whereas vascular endothelial growth factor (VEGF) and TGFβ levels decreased in tumors from treated mice. All the studied treat-ments resulted in increased collagen content in the tumor tissue in the early step of tumor progression, and calcitriol caused an increase in collagen content in lung tissue. In addition, in vitro proliferation of 4T1 tumor cells was not found to be affected
by calcitriol or its analogs in contrast to non-metastatic 67NR cells. Calcitriol and its analogs enhanced the metastatic potential of 4T1 mouse mammary gland cancer by inducing the secretion of OPN probably via host cells. In addition, OPN tumor overexpression prevailed over the decreasing tumor TGFβ level and blood vessel normalization via tumor VEGF deprivation induced by calcitriol and its analogs. Moreover, the increased plasma TGFβ and 17β-estradiol levels contributed to the facilitation of metastatic process.
Introduction
Approximately 70% of the breast cancers are estrogen receptor positive (ER+) and are responsive to endocrine therapy (1). The
hormonal drugs used to treat ER+ breast cancers have been
designed to antagonize the mitogenic effects of estrogens, which include selective estrogen receptor modulators (SERMs) such as tamoxifen and raloxifene that bind to the ER and act as antagonists in the breast; selective estrogen receptor downregulators (SERDs) such as fulvestrant that bind to and target ER for degradation; and aromatase inhibitors (AIs) that inhibit the activity of aromatase, an enzyme that catalyzes the synthesis of estrogens from androgenic precursors (2). Currently, AIs are the first-line therapy used to prevent breast cancer progression in postmenopausal women following primary therapy (2,3). Breast cancer therapies that reduce estrogen levels (e.g., oophorectomy, chemotherapy, and AIs) increase bone resorption without a corresponding increase in bone formation (4,5). The loss of bone mineral density in cancer-associated bone diseases result from the direct or systemic effects of the tumor in addition to the therapies used to treat the primary disease. It may be related to the local effects of metastatic deposits in bone and/or to the general-ized bone loss from tumor-produced, systemically circulating, bone-resorbing hormones or cytokines. These comprise para-thyroid hormone-related protein (PTHrP) or tumor stimulated secretion by the osteoblast of local bone resorbing factors such as receptor activator of nuclear factor κB ligand (RANKL),
Unfavorable effect of calcitriol and its low-calcemic analogs
on metastasis of 4T1 mouse mammary gland cancer
ARTuR ANIsIeWICz1, AGATA PAWLIK1, BeATA FILIP-PsuRsKA1, eLIzA TuRLej1, sTANIsłAW DzIMIRA2, MAGDALeNA MILCzAReK1, KATARzyNA GDesz1, DIANA PAPIeRNIK1, jOANNA jAROsz1,
DAGMARA KłOPOTOWsKA1, ANDRzej KuTNeR3, ANDRzej MAzuR4 and jOANNA WIeTRzyK1
1Department of experimental Oncology, Hirszfeld Institute of Immunology and experimental Therapy,
Polish Academy of sciences, 53-114 Wroclaw; 2Faculty of Veterinary Medicine, Wroclaw university of environmental and Life sciences, 50-375 Wroclaw;
3Department of Pharmacology, Pharmaceutical Research Institute, 01-793 Warsaw, Poland; 4université Clermont Auvergne, INRA, uNH, F-63000 Clermont-Ferrand, France
Received June 23, 2017; Accepted October 12, 2017 DOI: 10.3892/ijo.2017.4185
Correspondence to: Dr joanna Wietrzyk, Department of experimental Oncology, Hirszfeld Institute of Immunology and experimental Therapy, Polish Academy of sciences, 12 R. Weigla st., 53-114 Wroclaw, Poland
e-mail: wietrzyk@iitd.pan.wroc.pl
Key words: metastasis, calcitriol analog, 4T1 mouse mammary gland cancer, osteopontin, TGFβ
interleukin (IL)-6, or IL-3. In some tumors, more than one mechanism may be involved (6). To overcome the problems with failed calcium homeostasis, several issues have been proposed. One of them is the addition of bisphosphonates to mammary gland cancer treatment protocols (7,8). Another is the use of vitamin D during treatment. Many researchers during preclinical studies and clinical observations hypoth-esized that the addition of vitamin D or its analogs in the breast cancer treatment based on SERMs or AIs improves the efficacy of chemotherapy, among others alleviating patients from the musculoskeletal and joint pain (9-11).
Low vitamin D status, measured in terms of the biomarker 25-hydroxyvitamin D (25-OH-D3), is often considered as the
risk factor for breast cancer and has prognostic significance as it is involved in the development of cancer and in interactions with breast cancer treatments (12). The relationship between vitamin D deficiency and breast cancer is rather common and correlated with all clinical parameters such as incidence of tumor, tumor biology, prognosis, and antineoplastic treatment tolerance (13). Vitamin D deficiency increases after adjuvant cancer therapy, which alters bone metabolism in patients with breast cancer thereby increasing the risk of osteopo-rosis (14,15). Moreover, some studies have demonstrated a high prevalence of vitamin D deficiency in women with ER-negative, progesterone receptor-negative (PR), and human epidermal growth factor receptor 2 (HeR2)-negative breast cancers. It is postulated that correction of vitamin D deficiency in these women represents a reasonable but as yet, untested, strategy to delay recurrence and extend survival (16,17).
Vitamin D receptor (VDR) is present in almost all tissues and cells in the human body. Calcitriol, a hormonally active form of vitamin D3 (1,25-dihydroxyvitamin D3; 1,25(OH)2D3),
is primarily known for its role in bone mineralization and calcium homeostasis. In addition, several studies have revealed that calcitriol is important in immunomodulation, regulation of inflammation and cytokines, cell proliferation, cell differentia-tion, apoptosis, and angiogenesis (reviewed in refs. 12,13,18). However, calcemic activity and subsequent risk of hypercal-cemia caused by calcitriol treatment has limited its usage in anticancer therapy; therefore, currently, many researchers are focusing on the synthesis of new analogs with balanced calcemic effect and antiproliferative activities. Vitamin D3
metabolite used in this study, (24R)-1,24-dihydroxyvitamin D3
(tacalcitol; 1,24(OH)2D3; PRI-2191), is physiologically formed
via microsomal C-24 hydroxylation process. This process is alternative to C-25 hydroxylation, which leads to the formation of calcitriol. Both calcitriol and tacalcitol are hydroxylated to the less active metabolite 1,24,25(OH)3D3. Tacalcitol inhibits
proliferation and induces differentiation of epidermal mouse and human keratinocytes. It also binds to the VDR with the affinity higher or similar to that of calcitriol but shows weaker induction of hypercalcemia than calcitriol (19-21). However, the geometric analogs of vitamin D with the reversed (5E,7E) geometry of the triene system were reported by our (22-24) and other laboratories (25) to show the enhanced biological activity when compared to the natural (5Z,7E) vitamin D. We demon-strated a higher antiproliferative activity of synthetic tacalcitol, PRI-2191, when compared to calcitriol against various cancer cell lines, and we showed that this effect is attributed to the induction of cancer cell differentiation. We also showed the
in vitro and in vivo improvement of the activity of a range of anticancer drugs against human and murine cancer cells with concomitant use of vitamin D (20-23,26-31).
For the vast majority of cancer-related deaths, drug resis-tance and irremovable metastatic lesions are responsible. Metastasis results from the numerous interactions between cancer cells, hematopoietic stem cells, and normal cells within the microenvironment of the primary tumor and metastasis target organ. These interactions are in turn influenced by multiple endocrine, paracrine, and physical factors (32). Bone-targeted treatments may modify the course of the disease via both direct and indirect effects on this ‘vicious cycle’ of growth factor and cytokine signaling between tumor and normal cells (5,8).
Therefore, in this study, we aimed to evaluate the impact of calcitriol and its low-calcemic analogs on the mammary gland tumor growth and metastasis. To this purpose, we used 4T1 mouse metastatic mammary gland cancer cells because the in vitro proliferation of these cells is not affected by calcitriol or its analogs. We hypothesized that the enhance-ment of metastatic process by calcitriol and its analogs is related to the impact on tumor microenvironment including tumor vasculature.
Materials and methods
Compounds. Calcitriol (1,25(OH)2D3) and its analogs, namely,
PRI-2191 and PRI-2205 are certified synthetic materials obtained from the Pharmaceutical Research Institute, Warsaw, Poland. samples of the compounds were stored in amber ampoules under argon at -20˚C. Prior to usage, in case of in vitro studies, compounds were dissolved in 99.8% ethanol to a concentration of 10-4 M and subsequently diluted in culture
medium to reach appropriate concentration. For animal experi-ments, compounds were dissolved in 99.8% ethanol and then diluted in 80% propylene glycol (PeG) to reach the required concentrations. All compounds were freshly prepared each day prior to administration. The preparation and storage of the tested compounds was performed according to the manu-facturer's instructions (the Pharmaceutical Research Institute) and literature data (23,33). Tested compounds were adminis-tered subcutaneously (s.c.) to mice in a volume of 5 µl/g body weight (Fig. 1).
Cells and cell line culture. The mouse mammary adenocarci-noma 4T1 cells were obtained from American Type Culture Collection (ATCC, Rockville, MD, USA) and the 67NR (non-metastatic counterparts of 4T1) cells were received from Barbara Ann Karmanos Cancer Institute, Detroit, MI, usA. The cells were used in experiments immediately after obtaining.
The 4T1 cell line was maintained in a mixture of RPMI-1640 and Opti-MeM medium (1:1, Gibco, scotland, uK) adjusted to contain 3.5 g/l glucose, 2 mM L-glutamine and 0.5 mM sodium pyruvate (sigma-Aldrich Chemie GmbH, steinheim, Germany) with 5% fetal bovine serum (Hyclone, Ge Healthcare, uK). The 67NR cells were cultured in Dulbecco's modified eagle's medium (DMeM; Gibco) with 10% calf bovine serum (CBs; ATCC), 1% amino acid, and 2 mM L-glutamine (sigma-Aldrich Chemie GmbH). Both culture
media were supplemented with 100 U/ml penicillin (Polfa Tarchomin s.A., Warsaw, Poland) and 100 µg/ml streptomycin (sigma-Aldrich Chemie GmbH). The cells were grown at 37˚C in a humid atmosphere saturated with 5% CO2.
Mice. BALB/c female, 6-8-week old mice, weighing 20-25 g, obtained from the Center of Experimental Medicine of the Medical university of Bialystok (Bialystok, Poland), were maintained in specific pathogen-free conditions.
All experiments were performed according to EU Directive 2010/63/eu on the protection of animals used for scientific purposes and were approved by the first Local Committee for experiments with the use of Laboratory Animals, Wroclaw, Poland (no of permission: 40/2014).
Design of the in vivo experiments. BALB/c female mice were orthotopically inoculated into the right mammary fat pad with 1x10⁴ viable 4T1 tumor cells per mouse in 0.05 ml Hanks
solution and then randomly divided into groups receiving appropriate treatment. Vitamin D analogs were administered subcutaneously (s.c.) thrice a week starting from day 7 after tumor cell inoculation. The single dose of compounds was as follows: calcitriol, 0.5 µg/kg; PRI-2191, 1.0 µg/kg; and PRI-2205, 10.0 µg/kg.
Blood was harvested on the days 0 (before tumor inocula-tion), 7 (before treatment), 14 (micro-metastases observed (34), 21, 28, and 33 after the inoculation of 4T1 cells (day of tumor inoculation assigned as day 0). The mice were anesthetized with 3-5% (v/v) mixture of isoflurane (Aerrane isofluranum; Baxter, Canada) in synthetic air (200 ml/min) prior to sacri-ficing the animals. The tumors, lungs, and thoracic aortas were harvested for further analyzes (Fig. 1). Following additional controls were also used: healthy mice (assigned as day 0) and mice with implanted tumors euthanized on the day when the vitamin D derivatives began to be administered (day 7). The control group from day 7 was included to monitor the condi-tion of the body at the start of the treatment. some of analyses
were performed on two different days: 14 or 21 (as an early stage of tumor progression) and 28 or 33 (as a late stage of tumor progression).
Evaluation of the therapeutic effect. Tumor volume was calculated using the formula (a2xb)/2, where a = shorter tumor
diameter in mm and b = longer tumor diameter in mm. Tumors were measured thrice a week. Mice were sacrificed when the tumor volume exceeded 2,000 mm3. Multiple tumors were not
observed in our study. Metastases were counted in the lungs fixed in 4% buffered formalin by two independent examiners and mean value of those counts from two independent experi-ments is presented.
Body weight change (BWC). The average BWC in all groups was calculated based on the following formula: BWC = (ABWn/ABW1) x 100 - 100%, where ABWn is the average body weight on the nth day of the experiment (during
treatment) and ABW1 is the average body weight on the first day of treatment. The body weight of experimental animals was measured thrice per week throughout the study. We considered the treatment to be toxic if the BWC was found to be decreased by ~20% in two successive measurements. However, the experiments were terminated when body weight loss did not reach 20% in any of the mice.
Calcemic activity. Calcium level was measured in each indi-vidual plasma sample using the Cobas c 111 z ISE (Roche Diagnostics Ltd., Rotkreuz, switzerland) device.
Evaluation of tumor angiogenesis. The influence of calcitriol and its analogs on tumor angiogenesis was evaluated by means of ultrasound imaging of tumor perfusion.
For the ultrasound imaging MicroMarker™ Contrast Agent (VisualSonics, Ontario, Canada) was prepared according to the manufacturer's instructions. Animals were anesthetized with a 2-3% (v/v) mixture of isoflurane (Aerrane isofluranum; Figure 1. The scheme of in vivo experiments. The effect of calcitriol and its analogs on the growth and metastasis of 4T1 mouse mammary gland cancer was investigated at various stages of tumor progression (days 14, 21, 28 and 33). Additional controls were also used: healthy mice (assigned as day 0) and mice with implanted tumors euthanized on the day when the vitamin D derivatives began to be administered (day 7). The control group from day 7 was included to monitor the condition of the body at the start of the treatment. some of the analysis was performed on two various days: 14 or 21 (as an early stage) and 28 or 33 (as an late stage of tumor progression).
Baxter) in synthetic air (200 ml/min) and placed on the animal handling station equipped with an individual mask providing 1.5-2% (v/v) mixture of isoflurane and synthetic air. The position of the handling station was adjusted so that the central section of the tumor was being visualized and contrast agent was injected into the tail vein of the animal. signal of the contrast marker accumulating in the tumor tissue was recorded using the probe of 13-24 MHz frequency (Ms250, Visualsonics). Next, the peak-enhancement [contrast mean power as l.a.u. (linear arbitrary units)] and time-to-peak (sec) parameters were calculated using the Vevo LAB 1.7.1 software (Visualsonics).
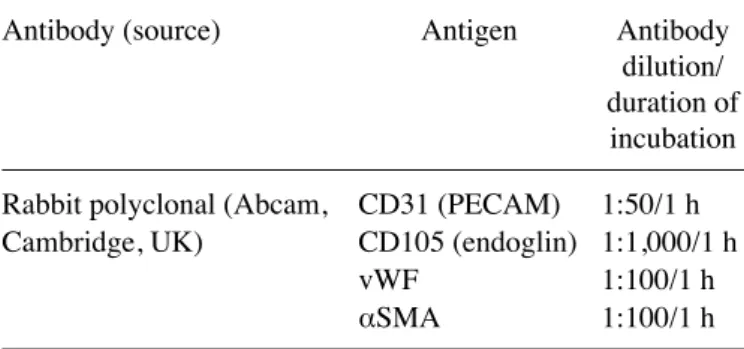
Immunohistochemical staining of aorta sections. For the double immunohistochemistry sequential staining of thoracic aorta (isolated from mice on the days 7, 14, 21, 28 or 33 and from healthy, non-treated animals) sections were fixed in buff-ered formalin and then cut into 4-µm thick slices that were subsequently dewaxed and rehydrated through gradient of unyhol and unyhol Plus (Bio-Optica, Mediolan, Italy). Antigen retrieval was performed by heating in Tris-eDTA, pH 9.0 (Institute of Immunology and experimental Therapy PAN, Wrocław, Poland) at 96˚C for 45 min. endogenous peroxidase and phosphatase activity was quenched by incubating with Dako Dual endogenous systems (Dako Cytomation Poland, Gdynia, Poland) for 10 min. subsequently, sections of aorta were incubated with primary antibodies described in Table I.
Antigen-antibody binding was detected using Dako Real enVision Detection systems Peroxidase or by Dako Real Detection Alkaline Phosphatase both from Dako Cytomation Poland, according to the manufacturer's instructions. Counterstaining was performed using Gill's III hematoxylin (Merck Millipore, Darmstadt, Germany), and the specimen was secured with a coverslip using Dako Faramount Aqueous Mounting Medium (Dako Cytomation Poland).
Microscopic examination and photographs were captured using a bright field microscope (Olympus CX41) connected with a camera equipped with Olympus stream Image Analysis software (Olympus europe Holding GmBH, Hamburg, Germany). Blinded microscopic examination was performed at magnifications (x10 and x100) and described according to the below scheme: 0, no staining; 1+, delicate staining; 2+, average color staining; 3+, intense color staining; 4+, bright color staining.
Masson's trichrome staining for collagen fibers of tumor and lung tissue. Tissues that were dewaxed and rehydrated in a descending alcohol series were incubated with Weigert's iron hematoxylin nuclear staining solution for 5 min (Merck Millipore, Darmstadt, Germany). After 5 min of flushing in tap water, slides were submerged in 1% acetic acid for 3 min. subsequently, the sections were immersed respec-tively in Azoploxine solution for cytoplasm dyeing (5 min), Tungstophosphoric acid orange G solution for erythrocytes staining (1 min), and Light green SF solution for collagen and connective tissue visualization (5 min). The slides were washed in 1% acetic acid between each staining procedure for 3 min (Masson-Goldner staining kit, Merck Millipore, Darmstadt, Germany). In the last step, slides were washed in 1% acetic acid for an additional 5 min and left to dry. Afterwards
histo-logical slides were covered with non-aqueous mounting agent (Neo-Mount anhydrous mounting medium; Merck KGaA, Germany) and a cover glass for further analysis.
Microscopic examination and photographs were made using a bright field microscope (Olympus CX41) connected with camera equipped with Olympus stream Image Analysis software (Olympus europe Holding GmBH). Blinded microscopic examination was performed at 2 magnifications (x10 and x40) and described according to the scoring described in Table II and figure legends.
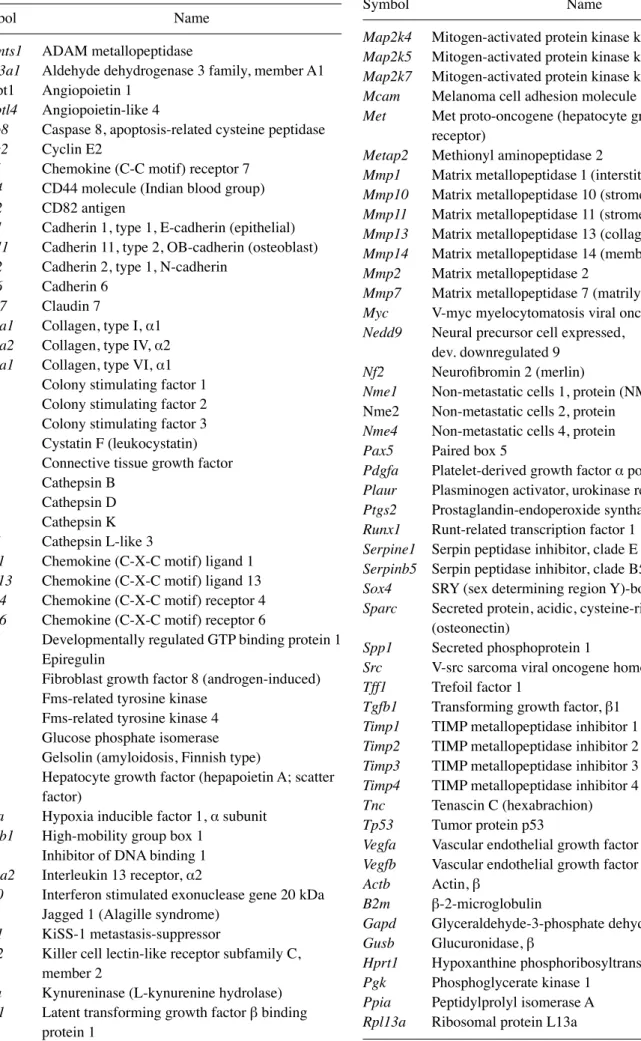
Mouse tumor invasion/metastasis PCR array. Total RNA of tumor tissue was extracted using TRIzol (TRI reagent; sigma-Aldrich) according to the manufacturer's instructions. RNA quantity and purity were determined spectrophotometri-cally at 260 nm using NanoDrop 2000 (Thermo Fisher scientific, Waltham, MA, usA) and the quality of RNA was verified by agarose electrophoresis. Reverse transcription was performed using iscript cDNA synthesis kit (Bio-Rad, Hercules, CA, usA). Real-time quantitative PCR of total cDNA was executed by ViiA™ 7 Real-Time PCR system (Thermo Fisher scientific) with syBR green chemistry (Qiagen, Hilden, Germany). Mouse Tumor Invasion/Metastasis PCR Array Library (MTIM-1) was purchased from Real-Time Primers (elkins Park, PA, usA). The array contained 88 primers for genes associated with the invasion or metastasis process and eight control genes. All genes available within this PCR array are listed in Table III. All PCR amplification cycles were performed at 95˚C for Table I. Antibodies and detection systems used for aorta immu-nohistochemistry.
Antibody (source) Antigen Antibody dilution/
duration of incubation Rabbit polyclonal (Abcam, CD31 (PeCAM) 1:50/1 h Cambridge, uK) CD105 (endoglin) 1:1,000/1 h
vWF 1:100/1 h
αSMA 1:100/1 h
Table II. scoring of staining for collagen in lung tissue. Score for collagen staining
---Day after tumor Control Calcitriol PRI-2191 PRI-2205 transplantation Day 0 +++ Day 7 +++ Day 14 ++ +++ ++ +/++ Day 21 ++ +/++ ++ ++ Day 28 ++ +++/++++ +/++ ++
semiquantitative evaluation of collagen fibers were based on its presence of a small level (+), the medium (++), significant (+++) and very abundant (++++).
Table III. List of genes evaluated using mouse tumor invasion/ metastasis PCR array library (MTIM-1).
symbol Name
Adamts1 ADAM metallopeptidase
Aldh3a1 Aldehyde dehydrogenase 3 family, member A1 Angpt1 Angiopoietin 1
Angptl4 Angiopoietin-like 4
Casp8 Caspase 8, apoptosis-related cysteine peptidase Ccne2 Cyclin e2
Ccr7 Chemokine (C-C motif) receptor 7 Cd44 CD44 molecule (Indian blood group) Cd82 CD82 antigen
Cdh1 Cadherin 1, type 1, e-cadherin (epithelial) Cdh11 Cadherin 11, type 2, OB-cadherin (osteoblast) Cdh2 Cadherin 2, type 1, N-cadherin
Cdh6 Cadherin 6 Cldn7 Claudin 7
Col1a1 Collagen, type I, α1 Col4a2 Collagen, type IV, α2 Col6a1 Collagen, type VI, α1 Csf1 Colony stimulating factor 1 Csf2 Colony stimulating factor 2 Csf3 Colony stimulating factor 3 Cst7 Cystatin F (leukocystatin) Ctgf Connective tissue growth factor Ctsb Cathepsin B
Ctsd Cathepsin D Ctsk Cathepsin K Ctsl1 Cathepsin L-like 3
Cxcl1 Chemokine (C-X-C motif) ligand 1 Cxcl13 Chemokine (C-X-C motif) ligand 13 Cxcr4 Chemokine (C-X-C motif) receptor 4 Cxcr6 Chemokine (C-X-C motif) receptor 6
Drg1 Developmentally regulated GTP binding protein 1 Ereg Epiregulin
Fgf8 Fibroblast growth factor 8 (androgen-induced) Flt1 Fms-related tyrosine kinase
Flt4 Fms-related tyrosine kinase 4 Gpi Glucose phosphate isomerase Gsn Gelsolin (amyloidosis, Finnish type)
Hgf Hepatocyte growth factor (hepapoietin A; scatter factor)
Hif1a Hypoxia inducible factor 1, α subunit Hmgb1 High-mobility group box 1
Id1 Inhibitor of DNA binding 1 Il13ra2 Interleukin 13 receptor, α2
Isg20 Interferon stimulated exonuclease gene 20 kDa Jag1 jagged 1 (Alagille syndrome)
Kiss1 Kiss-1 metastasis-suppressor
Klrc2 Killer cell lectin-like receptor subfamily C, member 2
Kynu Kynureninase (L-kynurenine hydrolase) Ltbp1 Latent transforming growth factor β binding
protein 1
Table III. Continued.
symbol Name
Map2k4 Mitogen-activated protein kinase kinase 4 Map2k5 Mitogen-activated protein kinase kinase 5 Map2k7 Mitogen-activated protein kinase kinase 7 Mcam Melanoma cell adhesion molecule
Met Met proto-oncogene (hepatocyte growth factor receptor)
Metap2 Methionyl aminopeptidase 2
Mmp1 Matrix metallopeptidase 1 (interstitial collagenase) Mmp10 Matrix metallopeptidase 10 (stromelysin 2) Mmp11 Matrix metallopeptidase 11 (stromelysin 3) Mmp13 Matrix metallopeptidase 13 (collagenase 3) Mmp14 Matrix metallopeptidase 14 (membrane-inserted) Mmp2 Matrix metallopeptidase 2
Mmp7 Matrix metallopeptidase 7 (matrilysin, uterine) Myc V-myc myelocytomatosis viral oncogene homolog Nedd9 Neural precursor cell expressed,
dev. downregulated 9 Nf2 Neurofibromin 2 (merlin)
Nme1 Non-metastatic cells 1, protein (NM23A) Nme2 Non-metastatic cells 2, protein
Nme4 Non-metastatic cells 4, protein Pax5 Paired box 5
Pdgfa Platelet-derived growth factor α polypeptide Plaur Plasminogen activator, urokinase receptor Ptgs2 Prostaglandin-endoperoxide synthase 2 Runx1 Runt-related transcription factor 1 Serpine1 Serpin peptidase inhibitor, clade E Serpinb5 serpin peptidase inhibitor, clade B5 Sox4 SRY (sex determining region Y)-box 4 Sparc secreted protein, acidic, cysteine-rich (osteonectin)
Spp1 Secreted phosphoprotein 1
Src V-src sarcoma viral oncogene homolog (avian) Tff1 Trefoil factor 1
Tgfb1 Transforming growth factor, β1 Timp1 TIMP metallopeptidase inhibitor 1 Timp2 TIMP metallopeptidase inhibitor 2 Timp3 TIMP metallopeptidase inhibitor 3 Timp4 TIMP metallopeptidase inhibitor 4 Tnc Tenascin C (hexabrachion) Tp53 Tumor protein p53
Vegfa Vascular endothelial growth factor A Vegfb Vascular endothelial growth factor B Actb Actin, β
B2m β-2-microglobulin
Gapd Glyceraldehyde-3-phosphate dehydrogenase Gusb Glucuronidase, β
Hprt1 Hypoxanthine phosphoribosyltransferase 1 Pgk Phosphoglycerate kinase 1
Ppia Peptidylprolyl isomerase A Rpl13a Ribosomal protein L13a
10 sec and 58˚C for 45 sec (50 cycles). We used 25 ng of cDNA (pooled from 4-5 mice within group) for a single reaction, and each test was performed in duplicate. Fold-change (RQ) of target cDNA was determined by calculating the differences in
∆∆CT values in reference to phosphoglycerate kinase 1 (Pgk1) by DataAssist 3.01 software (freeware by Applied Biosystems, Foster, CA, usA).
Real‑time PCR. Isolation of RNA and synthesis of cDNA was performed as described above. All PCR amplifica-tion cycles were performed at 95˚C for 15 sec and 60˚C for 1 min (40 cycles) using primers specific for following genes: Drg1 (Mm00492246_m1), Nf2 (Mm00477771_m1), Nedd9 (Mm01324843_m1), Mmp13 (Mm00439491_m1), Mmp14 (Mm00485054_m1), Spp1 (Mm00436767_m1), Flt1 (Mm00438980_m1), Plaur (Mm01149438_m1), Tgfb1 (Mm01178820_m1), pgk1 (Mm00435617_m1) with TaqMan chemistry (all from Life Technologies, Carlsbad, CA, usA). We used 25 ng of cDNA for a single reaction, and each sample was performed in triplicate in a single experiment (3 experi-ments were performed). Fold-change (RQ) of target cDNA was determined by calculating the differences in ∆∆CT values in reference to phosphoglycerate kinase 1 (Pgk1) by DataAssist 3.01 software (freeware by Applied Biosystems).
Western blotting
Tissue preparation. Tumor tissue specimens were collected in liquid nitrogen and stored at -80˚C. To determine the protein expression via western blotting, frozen tumors were mechani-cally homogenized (Rotilabo, Carl Roth, Karlsruhe, Germany) in RIPA buffer (sigma-Aldrich Chemie GmbH) supplemented with a complete mixture of phosphatase and protease inhibitors (sigma-Aldrich Chemie GmbH) and kept on ice for 25 min. Lysates were purified via microcentrifugation at 14,000 x g for 10 min at 4˚C.
Preparation of cells from in vitro culture. Cultured 4T1 or 67NR cells were seeded at a density of 3x10⁵ cells/4 ml in
suitable culture medium on a tissue culture dish. After 2 h of attachment, cells were exposed to calcitriol or its analogs at a concentration of 100 nM for 72 h. Next, cultures were rinsed with RIPA buffer and a mixture of phosphatase and protease inhibitors. Cells were scraped using cell scrapers and lysates were collected. Cell lysates were incubated on ice for 25 min and then were microcentrifuged at 10,000 x g for 15 min at 4˚C.
Protein concentration was determined using a protein assay (DC Protein assay; Bio-Rad Laboratories). equal amounts of protein (50 µg of cell culture lysates, 100 µg of tumor lysates) were mixed with 4X Laemmli sample buffer (Bio-Rad Laboratories). Then, the samples were separated in a 10% sodium dodecyl sulfate (sDs) polyacrylamide gel and transferred to a polyvinylidene difluoride (PVDF) membrane (0.45 µm; Merck Millipore, usA). Membranes were blocked for 1 h at room temperature in 5% non-fat dry milk in 0.1% PBs/Tween-20 (PBsT). Next, the membranes were washed (3x10 min) with 0.1% PBsT and then incubated overnight at 4˚C with a primary antibody: rabbit anti-VDR, anti-ERα, anti-ERβ, anti-NFκB, anti-IκBα, anti-SNAI, anti-PTeN, anti-CyP24A1, anti-CyP27B1, anti-RXRα, anti-β-catenin polyclonal antibody (santa Cruz Biotechnology Inc., santa Cruz, CA, usA), or rabbit anti-e-cadherin and
anti-N-cadherin polyclonal antibody (ProteinTech, Manchester, uK). After incubation, membranes were washed (3x10 min) with 0.1% PBsT and incubated for 1 h with the secondary mouse anti-rabbit immunoglobulin G (IgG)-horseradish peroxidase (HRP) antibody (santa Cruz Biotechnology Inc.). The membranes were finally washed thrice with 0.1% PBsT and detected by eCL method. Next, to determine the expression of β-actin, the same membranes (for each tested protein) were incubated with mouse anti-β-actin-HRP monoclonal antibody for 1 h at room temperature, washed (3x10 min 0.1% PBsT), and detected by eCL system. Chemiluminescence was visual-ized using Image station 4000 (Carestream Health, Rochester, Ny, usA). Densitometry analysis of the western blots was performed using Carestream MI software 5.0.6.20 (Carestream Health). All blots were normalized to that of β-actin, and the fold-change protein level expression is reported in comparison to that of the β-actin.
ELISA. For the quantitative determination of 17-β-estradiol, osteopontin (OPN), TGFβ, VEGF, thrombospondin, and 25-OH vitamin D, eLIsA kits were used according to the manufacturer's instructions (Demeditec Diagnostics GmbH, Germany; R&D systems, Inc., Minneapolis, MN, usA; eBioscience, Vienna, Austria; Thermo Fisher scientific; Bioassay Technology Laboratory, shanghai, China; eagle Biosciences, Nashua, NH, usA, respectively).
Mouse cytokine and protein expression was detected in mouse plasma, tumor homogenates, and in vitro from 4T1/67NR cells culture supernatants. Tumor lysates were prepared as described above (in western blotting method-ology).
For in vitro analysis, 4T1 or 67NR cells were seeded in a tissue culture dish at a density of 3x10⁵ cells/4 ml or in a 6-well
plate at a density 3x10⁵ cells/2 ml. Next, after 2 h, the attached
cells were exposed to the calcitriol, PRI-2191, or PRI-2205 at a concentration of 100 nM for 6, 24, 48 and 72 h. Next, the supernatants were collected and frozen at -20˚C until use. In vitro antiproliferative assay. Antiproliferative tests were performed as previously described (22). Briefly, 24 h prior to the addition of the tested compounds, 4T1 and 67NR cells were plated in 96-well plates (sarstedt, Germany) at a density of 1.5x10⁴/ml. To determine the in vitro cytotoxicity of test
compounds, the assays were performed after 72-h exposure of the cultured cells to the varying concentrations of tested compounds (total plate incubation time: 96 h) using sulforho-damine B (sRB) assay. Both cell lines were exposed to each tested vitamin D compound at four different concentrations in the range of 1,000-1 nM. The activity of tested agents was compared to the activity of cisplatin, doxorubicin, docetaxel, 5-fluorouracil (all Accord Healthcare Poland, Warsaw, Poland), camptothecin, and tamoxifen (sigma-Aldrich Chemie GmbH). In addition, control wells loaded with either ethanol or DMSO based on the solubility of the tested agents were maintained. Absorbance of each solution was read using synergy H4 (BioTek Instruments usA) at a wavelength of 540 nm. entire washing procedure was performed on Biotek eL-406 washing station. The results were calculated as IC50 value
(inhibi-tory concentration 50%) - the dose (nM or µg/ml) of tested agent which inhibits proliferation of 50% of the cancer cell
population. IC50 values were calculated in Prolab-3 system
based on Cheburator 0.4, Dmitry Nevozhay software for each experiment (35). each compound in each concentration was tested in triplicate in a single experiment, which was repeated at least thrice.
Statistical evaluation. statistical analysis was performed using statistica version 10 (statsoft Inc., usA) or GraphPad Prism 7.01 (GraphPad software Inc., usA). The assump-tions of analysis of variance (ANOVA) were checked using shapiro-Wilk's normality test and Bartlett's test. specific tests used for data analysis are indicated in figure legends. P<0.05 was considered to be statistically significant.
Results
The animal experiments were planned to investigate the effect of calcitriol and its analogs on the growth and metastasis of
mammary gland cancer at various stages of its progression. Besides control healthy mice used for comparisons in selected experiments (assigned as day 0), mice were euthanized on day 7 after tumor cells transplantation to monitor the condition of the body at the start of treatment. To analyze the treatment results during tumor progression, we selected the following time-points of observation: day 14 after cells inoculation (7th day of treatment) as the day, when according to the litera-ture data first micro-metastases can be observed in 4T1 tumor model (34). Next observation points were every week until the first signs of health problems: days 21, 28 and 33. The last observation time was shortened because of the observed body weight loss described below.
Calcitriol and its analogs stimulated metastatic spread of 4T1 mammary gland cancer. In two independent experiments, neither calcitriol nor its analogs (PRI-2191 and PRI-2205) influenced primary 4T1 tumor growth significantly (Fig. 2A). Figure 2. Tumor volume and number of lung metastases in mice bearing 4T1 tumors treated with calcitriol, PRI-2191, and PRI-2205. (A) Tumor volume measured on day 21, 28 and 33 of experiment. (B) Number of lung metastases counted in lungs from two independent experiments. (C) score for metastases in H&e stained lungs, days 14, 28 and 33: 0, no metastasis detected; +, 1-3 metastatic foci; ++, 4-7 foci; +++, 8-10 foci; ++++, >10 metastatic foci in lungs. (D) An example of H&e stained lungs on various stages of tumor progression from mice treated with calcitriol. Black arrows indicated tumor nodules. Magnification, x20, scale bar, 100 µm. Mice were inoculated orthotopically with 4T1 cells on day 0. From day 7 (7 days after tumor inoculation), vitamin D analogs were administered subcutaneously (s.c.) thrice a week. The single dose of compounds were as follows: calcitriol, 0.5 µg/kg; PRI-2191, 1.0 µg/kg; and PRI-2205, 10.0 µg/kg. Number of mice were 9-13 per group. Data were collected from two independent experiments. Data for individual animals are presented with median lines. statistical analysis: Kruskal-Wallis multiple comparison test. *P<0.05.
However, in both experiments, the stimulation of lung metas-tases resulting from the treatment was observed (Fig. 2B). Metastatic foci in lungs were first macroscopically visible on day 21 after inoculation of the tumor cells. On this day, the number of metastases in mice treated with PRI-2205 (P<0.05) was almost twice as high as in control animals. On day 28, the influence of calcitriol on metastasis formation was not observed; however, PRI-2191 and PRI-2205 significantly enhanced the formation of metastases in 127% (P<0.05) and 54%, respec-tively, as compared to the control mice. On day 33, the tendency to stimulate the formation of lung metastasis was observed in mice treated with calcitriol, PRI-2191, and PRI-2205 (50, 54 and 58% over control, respectively; not significant because of high differences between mice). Histological examination of lung tissue from one of the two conducted experiments showed single metastatic foci on day 14 (in 2 out of 6 in the control group, 0 out of 6 in calcitriol treated, 3 out of 6 in PRI-2191, and 2 out of 6 in PRI-2205 treated mice). On day 33, statistically significant increase of the number of metastatic foci in mice treated with all compounds was observed (Fig. 2C and D).
BWC and blood calcium level were measured throughout the experiment to estimate the toxicity of the treatments used (Fig. 3). The body weight of mice remained unchanged significantly till day 22 in all experimental groups. The kinetics of BWC in control and mice treated with PRI-2191 and PRI-2205 was similar till the end of the experiment. However, from day 24 until the last day of measurements, toxicity of calcitriol was observed in terms of BWC, which decreased in ~10% of the control mice (Fig. 3A).
From day 28, an increase in calcium level was observed in both control (as a result of tumor progression) and treated mice. On day 33, serum calcium level was found to be signifi-cantly higher in control tumor-bearing mice than in healthy mice (day 0; Fig. 3C). Calcitriol and PRI-2191 significantly increased calcium level on days 14 and 28 when compared to relevant control tumor-bearing mice (P<0.05). The elevation of calcium level was also significant in mice treated with these compounds on days 28 and 33 when compared to healthy animals. In parallel, measurements of 25(OH)D in plasma showed significant decrease of 25(OH)D in mice treated with all agents (day 21) or in mice treated with calcitriol or PRI-2191 at all days of measurements (Fig. 3D).
The plasma concentration of 17β-estradiol was found to be significantly increased in control mice from days 21 to 28. Calcitriol on day 21 caused increase in plasma 17β-estradiol level when compared to control mice (P<0.05). Both analogs showed similar tendency (Fig. 3B).
Calcitriol and its analogs normalized tumor vasculature of 4T1 mammary gland cancer. We estimated the influence of calcitriol and its analogs on tumor angiogenesis. The results of the intravital ultrasound imaging of blood flow in tumor tissue as reflected by peak-enhancement and time-to-peak para-meter values indicate that all compounds enhanced tumor blood perfusion (Fig. 4A-C). Calcitriol and its analogs signifi-cantly enhanced the time-to-peak parameter (mean value for control mice was 11.59 sec and mean value for mice treated with calcitriol, PRI-2191, and PRI-2205 was 13.76, 13.62 and Figure 3. Body weight changes and blood calcium, 17β-estradiol, and 25(OH)D level in 4T1 tumor-bearing mice. (A) Body weight changes (BWCs) and (B) 17β-estradiol, (C) blood calcium, and (D) 25(OH)D level in mouse plasma. Mice were inoculated orthotopically with 4T1 cells on day 0. From day 7 (7 days after tumor inoculation), vitamin D analogs were administered subcutaneously (s.c.) thrice a week. The single dose of compounds was as follows: calcitriol, 0.5 µg/kg; PRI-2191, 1.0 µg/kg; and PRI-2205, 10.0 µg/kg. Number of mice were 5-7 per group. D0, control, healthy mice; D7, 4T1 tumor-bearing non-treated mice 7 days after tumor transplantation. Mean values with standard deviation (sD) are presented. Color bars, black, control animals; blue, calcitriol; red, PRI-2191; green, PRI-2205. statistical analysis: (B) Mann-Whitney u test. (C and D) Dunnett's multiple comparisons test; significant differences are marked on the figure: *P<0.05 as compared to control animals on the relevant day of treatment, or as indicated by fastener. The decrease in BWC observed in
(A) from day 24 until the last day of measurements is caused by the calcitriol toxicity (blue line). The mean body weight decreased in ~10.5% when compared to control mice (A). We considered the treatment to be toxic if the BWC decreased by ~20% in two successive measurements.
13.81 sec, respectively, P<0.05; Fig. 4A). After treatment with calcitriol, we observed statistically significant increase in case of values of peak-enhancement parameter when compared to the control group of animals [8.49 l.a.u. (linear arbitrary units) vs. 2.84 l.a.u.; Fig. 4B].
simultaneously, we observed a significant decrease in VEGF levels in tumor tissue after treatment with calcitriol (1.08 pg/µg) and PRI-2205 (1.10 pg/µg) on day 14 when compared to the control mice (1.55 pg/µg; P<0.05). On day 28, we observed statistically significant decrease in VeGF levels in tumor tissue of control mice when compared to day 14. A further decrease in VEGF levels was observed after treatment with PRI-2191 and PRI-2205 on day 28 (Fig. 4D). The levels of thrombospondin 1 (TSP-1), an antiangiogenic factor, in tumor tissue decreased from days 14 to 28; however, its levels were not affected by treatment with calcitriol or its analogs (Fig. 4e). VeGF level in plasma on day 14 was not influenced by the treatments used in this study (Fig. 4F).
Induction of OPN mRNA (Spp1) by calcitriol and its analogs during the early phase of tumor progression. To identify the candidate genes that might be regulated by calcitriol and its
analogs in the process of enhanced metastatic dissemination of 4T1 cells, polymerase chain reaction (PCR) array screening was performed (88 tested genes listed in Table III). Data were analyzed for transcripts from tumors taken from mice at two time points: on day 14 and on day 28 after 4T1 tumor inoculation. We observed the expression of 46 out of 88 genes screened. The candidate genes were selected for further exam-ination based on fold change compared to its expression in non-treated tumors [day 7, relative quantification (RQ) values presented in Table IV]. The expression of selected genes in tumor tissues was confirmed by real-time PCR analysis.
Calcitriol and its analogs downregulated the expression of some genes coding growth factors and their receptors involved in tumor angiogenesis, the expression of which increased during 4T1 tumor progression [vascular endo-thelial growth factor receptor 1 (Flt1), transforming growth factor β1 (Tgfb1)]. However, the expression of connective tissue growth factor (Ctgf) and platelet-derived growth factor α (Pdgfa) was increased after treatment with calcitriol and its analogs (Fig. 5A). The expression of type VI collagen
α1 (Col6a1) and matrix metallopeptidases 13 and 14 (Mmp13 and Mmp14) decreased, whereas the expression of Mmp2 Figure 4. Influence of calcitriol, PRI-2191, and PRI-2205 on angiogenesis of 4T1 tumor. Tumor blood perfusion estimated by ultrasound imaging as (A) time to peak and (B) peak-enhancement values measured on day 24 after 4T1 mammary gland cancer inoculation. (C) Representative images of tumor perfusion taken for (I) control group, (II) mice treated with calcitriol, (III) PRI-2191, and (IV) mice treated with PRI-2205. (D) VeGF level in tumor tissue. (e) Thrombospondin 1 (TsP-1) tumor tissue level. (F) VeGF plasma level measured on day 14. Mice were inoculated orthotopically with 4T1 cells on day 0. From day 7 (7 days after tumor inoculation), vitamin D analogs were administered subcutaneously (s.c.) thrice a week. The single dose of compounds were as follows: calcitriol, 0.5 µg/kg; PRI-2191, 1.0 µg/kg; and PRI-2205, 10.0 µg/kg. Number of mice evaluated were 4-7 per group. Color bars, black, control animals; blue, calcitriol; red, PRI-2191; green, PRI-2205. Data presentation: (A and B) Data for individual animals with median line. (C) Representative ultrasound images: left panel, before; right panel, after contrast inoculation. (D and e) Mean ± standard deviation. statistical analysis: (A and B) Dunnett's multiple comparisons test. (D) Tukey's multiple comparison test. (e) sidak's multiple comparison test. *P<0.05 as compared to control
Table IV. The expression of genes associated with tumor invasion or metastasis evaluated in 4T1 tumor tissue after treatment with calcitriol or its analogs.
Control Calcitriol PRI-2191 PRI-2205 -- -- -- ---Gene D14 D28 D14 D28 D14 D28 D14 D28 Adamts1 8.300 2.754 1.653 3.996 2.534 4.028 4.959 2.247 Angpt14 3.526 4.325 1.528 3.342 2.861 2.468 2.500 2.897 Casp8 5.738 3.931 1.368 6.865 5.412 8.016 3.174 4.734 Cd82 11.476 10.293 1.929 10.865 6.052 7.078 2.786 19.504 Cdh2 5.481 4.407 1.680 6.547 2.697 1.434 3.685 4.377 Cdh6 1.201 1.030 1.249 2.244 1.588 1.928 0.394 1.578 Col1a1 6.035 2.921 2.069 0.362 0.899 0.486 0.750 2.647 Col4a2 2.637 1.809 2.193 2.434 6.010 2.839 2.444 6.133 Col6a1 13.012 7.619 1.252 2.712 1.534 1.842 1.714 6.557 Cst7 2.669 1.666 1.801 2.727 3.533 4.933 3.064 7.574 Ctgf 18.556 12.008 0.763 12.120 1.835 1.888 2.538 5.185 Ctsb 2.843 2.500 15.140 0.892 0.122 0.555 0.445 0.363 Ctsd 15.520 18.011 5.140 0.107 1.989 2.080 0.928 1.434 Ctsl1 6.498 18.792 4.327 4.351 0.483 4.482 1.148 1.396 Cxcl1 3.566 3.480 4.935 3.949 6.191 7.234 3.045 11.300 Drg1 5.292 3.740 1.290 5.493 4.317 1.452 1.086 2.584 Flt1 5.872 8.900 1.615 2.505 2.509 1.831 0.917 6.456 Gpi 2.334 1.812 3.471 3.173 5.454 3.675 2.774 4.742 Gsn 1.297 1.001 1.154 1.683 1.628 2.128 1.282 2.010 Id1 2.855 2.186 1.637 1.940 2.016 2.671 1.800 2.287 Isg20 10.271 13.785 11.894 14.061 3.263 10.219 2.158 14.053 Jag1 15.663 10.047 1.784 2.597 5.598 14.129 6.377 2.102 Map2k4 11.770 10.176 1.522 20.272 2.063 4.953 2.779 3.258 Mcam 2.307 8.493 1.969 2.567 2.687 2.396 1.241 3.739 Metap2 2.103 4.064 3.050 2.800 5.150 2.149 0.694 2.286 Mmp11 2.748 3.962 1.375 6.656 2.389 5.574 1.547 3.540 Mmp13 15.092 6.512 10.286 4.299 3.337 4.448 4.385 6.341 Mmp14 8.438 7.808 3.079 3.122 0.959 6.057 2.347 7.366 Mmp2 10.257 25.839 3.043 3.718 0.801 17.339 4.869 2.932 Nedd9 2.397 2.421 1.531 1.521 1.444 2.846 2.414 1.673 Nf2 1.385 3.778 2.141 1.982 1.685 3.101 3.024 1.919 Nme2 5.052 2.180 11.167 3.796 31.448 7.117 7.194 17.671 Nme4 3.300 4.548 2.309 2.692 1.340 10.143 5.289 4.507 Pax5 3.510 1.350 3.781 1.025 21.864 2.887 1.547 3.213 Pdgfa 1.667 2.270 2.002 1.580 2.965 8.540 3.473 1.574 Plaur 2.109 3.874 3.297 1.785 2.146 4.060 1.998 3.030 Ptgs2 5.118 2.797 3.370 2.149 2.776 7.053 5.086 2.962 Runx1 1.982 4.925 1.420 3.090 0.747 2.129 1.540 0.521 Serpine1 1.164 0.524 2.918 0.733 1.662 0.931 1.091 0.830 Sparc 1.237 0.486 3.572 0.545 3.355 0.798 1.319 6.911 Spp1 1.198 2.990 2.287 2.118 1.227 0.982 1.367 1.744 Src 1.846 1.898 4.773 1.321 1.676 1.769 1.927 1.547 Tgfb1 3.058 5.330 4.415 1.100 0.940 1.817 1.187 2.014 Timp1 1.248 1.303 3.395 0.987 1.362 0.655 0.891 0.583 Timp3 0.068 0.019 0.054 0.037 0.095 0.602 0.043 0.064 Vegfa 0.307 0.155 0.224 0.092 2.461 0.150 0.208 0.100 Tumors were collected on days 14 and 28 (after inoculation with 4T1 cells) from mice treated with calcitriol or its analogs and control group receiving 80% propylene glycol (vehicle for vitamin D analogs). Real-time PCR screening was performed using the mouse tumor invasion/ metastasis PCR array library (MTIM-1). From 88 genes available in this array (Table III), the expression for 42 genes was not detected in 4T1 tumor tissue. Data presented as mean relative quantification (RQ) values (calculated from duplicate). Fold-change (RQ) of target cDNA was determined by calculating the differences in ∆∆CT values with reference to phosphoglycerate kinase 1 (Pgk1) by DataAssist v 3.01 software. All PCR amplification cycles were performed at 95˚C for 10 sec and 58˚C for 45 sec (50 cycles). We used 25 ng of cDNA for a single reaction, and each test was performed in duplicate.
Figure 5. Changes in mRNA expression in tumors from mice treated with calcitriol or its analogs. (A) screening of genes using real-time polymerase chain reaction correlated with tumor invasion and metastasis. (B) Real-time PCR analysis of nine selected genes. Number of mice evaluated were 3-7 per group. Color bars, black, control animals; blue, calcitriol; red, PRI-2191; green, PRI-2205. Data presentation: (A) Heat maps presenting mean relative quantification (RQ) values from duplicates. (B) Mean ± standard deviation. statistical analysis: Kruskal-Wallis multiple comparisons test, *P<0.05 as
increased in control tumor tissue between days 14 and 28 of tumor growth. Calcitriol and its analogs showed tendency to reduce the aforementioned gene mRNA levels when compared to control (Fig. 5A). Calcitriol and its analogs also decreased the expression of angiopoietin-like 4 gene (Angptl4; on both days 14 and 28 of measurement) and secreted phosphoprotein 1 (OPN; Spp1; on day 28). Increased expression of non-metastatic cells 2 (Nme2), chemokine (C-X-C motif) ligand 1 (Cxcl1), and cystatin F (leukocystatin; Cst7) in tumors from mice treated with all compounds was observed. However, developmentally regulated GTP binding protein 1 (Drg1), cathepsins B and D (Ctsb and Ctsd), and Ctgf were downregulated by the adminis-tration of calcitriol and its analogs (except Ctsb after calcitriol treatment on day 14) (Fig. 5A).
We performed real-time PCR analysis of the following nine selected mRNAs: Drg1, Flt1, Spp1, neurofibromin 2 (merlin; Nf2), neural precursor cell expressed, dev. downregulated 9 (Nedd9), Mmp13, Mmp14, Tgfb and plasminogen activator, urokinase receptor (Plaur). The expression of Nf2, Nedd9, Mmp13, Mmp14 and Plaur significantly increased during tumor progression; however, calcitriol or its analogs (with the exception of upregulation of Flt1 by PRI-2205 and downregu-lation of Plaur by calcitriol) did not influence the expression of aforementioned mRNAs significantly. The mRNAs that were significantly influenced by calcitriol and its analogs were Spp1 and Drg1. The expression of Spp1 was significantly upregulated in tumor tissue by calcitriol and PRI-2205 on day 14 and by PRI-2205 on day 28. PRI-2191 downregulated Spp1 on day 28 (Fig. 5B). The expression of Drg1 (also known as Nedd3) was increased after treatment with calcitriol on days 14 and 28, but it decreased after treatment with PRI-2191 on day 28. In addition, significant decrease in the expression of Tgfb was observed in mice treated with calcitriol and PRI-2191 on day 14 when compared to control mice bearing tumors on day 7 (Fig. 5B).
Selected protein expression in tumors harvested from the mice treated with calcitriol and its analogs. First, we estimated the expression of the following receptors and transcription factors known as typical for calcitriol and/or typical for mammary gland cancer: VDR and retinoid X receptor (RXR), estrogen receptors ERα and β, nuclear factor κB (NFκB), inhibitor of κB (IκB), phosphatase and tensin homolog (PTeN), snail family transcriptional repressor 1 (SNAI1), as well as E- and N-cadherin - markers of epithelial to mesenchymal transition (eMT).
VDR level increased during 4T1 tumor progression. In this study, calcitriol and its analogs decreased the levels of VDR (Fig. 6A). eRα level was decreased during 4T1 progres-sion, whereas ERβ level remained unchanged. Furthermore, calcitriol and its analogs decreased the levels of ERβ on days 28 and 33 (Fig. 6A).
On day 21, a 2.5-fold increase in the ratio of e:N-cadherin in tumor tissues of mice administered with calcitriol and its analogs was observed. In control tumors, this ratio was ~1. However, during tumor growth progression, the ability of calcitriol and its analogs to increase the ratio of E:N-cadherin was not observed (Fig. 6B).
In this study, we evaluated also the protein levels of tran-scription factors, namely, sNAI1 and PTeN. We found that
their levels increased at the end of the experiment, whereas the levels of NFκB and IκB increased on day 28 and then rapidly decreased on day 33. Calcitriol and its analogs did not influ-ence the levels of SNAI1, PTEN, and IκB, whereas on days 21 and 33, PRI-2191 and PRI-2205 caused increase in their levels. On day 28, all studied compounds decreased the levels of NFκB (Fig. 6C).
Increased levels of OPN and decreased levels of trans‑ forming growth factor β (TGFβ) in tumor tissue resulting from the treatment. The level of other proteins in tumor tissue was analyzed using enzyme-linked immunosorbent assay (eLIsA). OPN levels in control tumors increased significantly during 4T1 tumor progression. Calcitriol and its analogs further increased its level. Both analogs elevated OPN level from day 14. Calcitriol showed some delay in this activity but significantly increased the levels of OPN from day 28 (Fig. 7A). TGFβ level in tumor tissue was significantly lowered by treatment using calcitriol and its analogs when compared to control (Fig. 7A).
Plasma OPN level measured on selected days of treat-ment was found to be increased by calcitriol and its analogs, however, opposite effect was seen in case of TGFβ levels in plasma. TGFβ was undetected in control tumor-bearing mice on days 21 and 33 of treatment, as well as in mice treated with calcitriol on day 21. PRI-2191 and PRI-2205 increased TGFβ
level significantly. TGFβ level also increased in mice treated with calcitriol (from undetectable levels in control mice to 30 pg/ml in mice treated with calcitriol on day 33) (Fig. 7B). Modulating effect of calcitriol and its analogs on collagen deposits in tumor and lung tissue. Histochemical analysis of tumors collected from control mice showed increased collagen deposits in tumor tissue during neoplastic progres-sion as showed by Masson's trichrome staining. Treatment with calcitriol and its analogs on day 21 further increased the collagen deposits but the content was significantly low on day 28 (Fig. 8).
In most specimens of lungs, connective tissue (collagen fibers) was seen as a green staining of fibers around the bronchi and bronchioles, large vessels, and alveolar elements. During tumor progression, we found a slight decrease in staining intensity in control mice; however, PRI-2191 as PRI-2205 did not show a difference in staining intensity when compared with control mice. Calcitriol treatment seem to increase collagen fiber deposits in lungs, primarily on days 14 and 28 (from ++ to even ++++) (Table II).
Aortic remodeling during tumor progression and treatment with calcitriol and its analogs. During 4T1 tumor progres-sion, we observed changes in the structure of aorta. When tumor became palpable (day 7), the number of cell layers of tunica media (P<0.05) and tunica adventitia decreased when compared to healthy (day 0) mice. Next, on day 14, the number of tunica media and tunica adventitia layers in control tumor-bearing mice increased significantly when compared to healthy (D0) and/or tumor-bearing mice on day 7. On day 21, the number of tunica media and tunica adventitia layers did not change significantly. However, on the two last days of observation (days 28 and 33), the number of layers
Figure 6. selected proteins in 4T1 tumor tissue from mice treated with calcitriol or its analogs. Western blot analysis of (A) nuclear receptors; (B) epithelial-mesenchymal transition markers; (C) transcription factors. Color bars, black, control animals; blue, calcitriol; red, PRI-2191; green, PRI-2205. Bands on the blot were determined as: 1, control animals; 2, calcitriol; 3, PRI-2191; 4, PRI-2205. Number of mice evaluated were 3-4 per group. Chemiluminescence was visualized using Image station 4000MM PRO (Carestream). Densitometry analysis of the western blots was performed using Carestream MI software 5.0.6.20 (Carestream Health). Data presentation: mean ± standard deviation of protein tested to actin ratio and representative cropped blots. statistical analysis: Holm-sidak's multiple comparisons test; *P<0.05 as indicated.
Figure 7. Osteopontin and transforming growth factor β (TGFβ) level in tumor tissue and in plasma of mice. eLIsA proteins levels analyzed in (A) tumor tissue and (B) plasma. Color bars, black, control animals; blue, calcitriol; red, PRI-2191; green, PRI-2205. Number of mice evaluated were 4-7 per group. Data are presented as mean ± standard deviation. statistical analysis: (A) Tukey's multiple comparison test; (B) Dunnett's multiple comparison test. *P<0.05 as compared
to control animals on the relevant day of treatment or as indicated.
Figure 8. Collagen staining in tumor tissue from mice treated with calcitriol or its analogs. Color bars, black, control animals; blue, calcitriol; red, PRI-2191; green, PRI-2205. Number of mice evaluated were 6 per group. (A) Data are presented as mean ± standard deviation. statistical analysis: Kruskal-Wallis multiple comparison test. *P<0.05 as compared to control animals on the relevant day of treatment or as indicated. (B) Representative photographs. Magnification, x40;
scale bar, 20 µm. The sections were immersed respectively in azoploxine solution for cytoplasm dyeing, Tungstophosphoric acid orange G solution for erythro-cytes staining, and Light green sF solution for collagen and connective tissue visualization. semiquantitative evaluation of collagen was based on the presence of single collagen fibers around single cells (+), single collagen fibers around all cells (++), the medium (+++), significant (++++) and very abundant (+++++) collagen deposits in sight.
of tunica adventitia and tunica media decreased. In case of tunica media, the decrease in cell layers was greater and statistically significant (days 28 and 33) than that of healthy mice (day 0). The α-smooth muscle actin (αSMA) staining decreased at the beginning of tumor growth (day 7) and then increased to the values similar to the healthy mice. stained with von Willebrand factor (vWF), vasa vasorum endothelial cells decreased during 4T1 tumor progression and were not detectable on day 33. However, staining with anti-endoglin (CD105) antibody showed increased intensity on day 14 when compared to healthy (day 0) and tumor-bearing mice on day 7 (P<0.05). CD31 antigen of intima endothelial cells was unchanged during tumor growth in control tumor-bearing mice; however, endoglin significantly increased starting from day 7 (Fig. 9A).
Calcitriol and PRI-2205 decreased the number of tunica media layers on day 14 and PRI-2205 on day 21 (P<0.05). In the advanced stages of tumor development (days 28 and 33), both calcitriol and PRI-2191 increased the CD105 score. In mice treated with PRI-2205, the number of tunica media layers remained on the lower level similar to tumor-bearing mice on day 7. The number of tunica adventitia layers was affected by the tested compounds only in the earlier stages of tumor development. PRI-2205 significantly decreased the number of layers on days 14 and 21. The tendency to decrease the thickness of tunica adventitia of aorta was also observed in PRI-2191-treated mice. PRI-2205 tended to decrease CD31 (day 21) and CD105 intima-positive cells (days 28 and 33 with an
exception on day 14, where significant increase was observed). A similar tendency was observed according to CD105 and vWF-positive cells in tunica adventitia. However, calcitriol and PRI-2191 increased the number of vWF stained adventitia cells. During the course of treatment, calcitriol increased the staining intensity of CD105 intima (days 14 and 33: P<0.05). PRI-2191 on day 14 significantly decreased CD105 staining of intima cells (Fig. 10).
The damage to endothelium observed in hematoxylin and eosin-stained aorta slices in general respond to changes in intima endoglin (CD105) staining (Fig. 9B). During this examination, the aortas showed no change (0) or a number of changes observed in terms of damage to the individual endothelial cells (marked +) or lying next to each other in a small space in a number of such locations (++), or endothe-lial cells invaded by erythrocytes and/or dissection (+++). Calcitriol and its analogs increased endothelium damage on day 14 (Fig. 9B).
Calcitriol and its analogs exert different action against meta‑ static 4T1 cells and its non‑metastatic counterparts 67NR in vitro. This part of the study was performed to evaluate the direct influence of calcitriol and its analogs on 4T1 metastatic cells in vitro and compare the results with non-metastatic subline 67NR.
Calcitriol and its analogs inhibited proliferation of non-metastatic 67NR cells but did not influence 4T1 cell proliferation significantly (Fig. 11A and Table V). We used Figure 9. Kinetics of aorta remodeling in control mice during tumor progression and score for endothelium damage during treatment with calcitriol or its analogs. (A) Kinetic of aorta remodeling in control mice. (B) score for endothelium damage. Color bars, black, control animals; blue, calcitriol; red, PRI-2191; green, PRI-2205. Number of mice evaluated were six per group. Data are presented as mean ± standard deviation. statistical analysis: (A) Mann-Whitney u test. *P<0.05 as compared to D0, vP<0.05 as compared to D7. (B) Kruskal-Wallis multiple comparisons test. *P<0.05 as compared to control on day 14.
cisplatin, doxorubicin, docetaxel, 5-fluorouracil, tamoxifen, and camptothecin as the control anticancer drugs, to show the sensitivity of 4T1 cells for in vitro anticancer drugs in the same experimental condition as used for calcitriol and its analogs. similar antiproliferative activities of most anticancer drugs were observed for both cell sublines. However, 4T1 cells revealed less sensitivity to tamoxifen and 5-fluorouracil when compared to 67NR cells (Table V).
According to our results, 67NR cells secreted OPN into the culture medium and it increased significantly during the time of incubation. However, in case of 4T1 cells, OPN secretion increased up to 48 h of incubation and the level was maintained up to 72 h (Fig. 11B). Furthermore, 4T1 cells secreted significantly higher levels of OPN than that of 67NR cells, and calcitriol and its analogs (100 nM) did not alter its levels (Fig. 11B). starting from 48 h of incu-bation, calcitriol and both analogs significantly increased the secretion of OPN by 67NR cells (Fig. 11B, right graph). After 72 h of incubation with 100 nM calcitriol and its analogs, the levels of E- and N-cadherin, β-catenin, VDR, RXRα, and ERα were measured. The results are presented in Fig. 12. Calcitriol and its analogs did not affect the expression of aforementioned proteins in 4T1 cells. The results also show that 4T1 and 67NR cells expressed similar
Figure 10. Kinetics of aorta remodeling during tumor progression and treatment with calcitriol or its analogs. (A) Intima CD31 and CD105 expression. (B) Media thickness and the α-smooth muscle actin (αsMA) staining. (C) Adventitia thickness and von Willebrand factor (vWF), CD105 expression. (D) Representative photographs of aortic wall from selected groups of mice. Color bars, black, control animals; blue, calcitriol; red, PRI-2191; green, PRI-2205. Number of mice evaluated were 6 per group. Data are presented as mean ± standard deviation. statistical analysis: Mann-Whitney u test. *P<0.05 as compared to control
animals on the relevant day of treatment. Magnification, x20; scale bar, 20 µm.
Table V. Antiproliferative activity of tested compounds and positive controls against mammary gland cancer sublines: metastatic 4T1 and non-metastatic 67NR cells.
Compound 4T1 cells 67NR cells
IC50 (nM) Calcitriol - 25.04±9.30 PRI-2191 - 23.52±5.93 PRI-2205 - 230.73±12.14 IC50 (µg/ml) Cisplatin 0.38±0.090 0.30±0.050 Doxorubicin 0.04±0.002 0.05±0.012 Docetaxel 0.01±0.000 1.20±0.990 Camptothecin 0.03±0.003 0.04±0.036 5-fluorouracil 0.46±0.044 0.11±0.079a Tamoxifen 3.05±0.237 1.46±0.164a
The inhibitory concentration 50% (IC50) value is defined as the concentration of a compound that corresponds to a 50% growth inhibition. experiments were repeated three times in triplicates. Data presented as mean ± standard deviation. aP<0.05, student's t-test.
level of N-cadherin, and this expression was increased significantly in 67NR cells by calcitriol or its analogs. The 67NR cells did not express e-cadherin. The expression of
β-catenin, and VDR proteins were higher in 4T1 than in 67NR cells. Calcitriol increases significantly the expression of β-catenin in 67NR cells. On the other hand, the expres-sion of RXRα and ERα was significantly lower in 4T1 than 67NR cells. Calcitriol (eRα) or calcitriol and its analogs (RXRα) increased the expression of these proteins signifi-cantly only in 67NR cells. The expression of vitamin D metabolizing enzymes namely, CyP27B1 and CyP24A1 were unchanged in 4T1 cells after treatment with the tested compounds. However, in case of 67NR cells, the expression of both the enzymes increased significantly after incubation with calcitriol or its analogs (Fig. 12).
Discussion
In this study, we conducted experiments on the mouse 4T1 mammary gland cancer cells transplanted into the mammary fat pad of the immune-competent BALB/c female mice. This research model is commonly used for late-stage (IV) basal-like human breast cancer model because similar to that observed in humans 4T1 cells spontaneously metastasize via hematogenous route into lungs, brain, liver or bones (34). Moreover, 4T1 tumor progression is accompanied by the activation of the platelets (36) and of host immune cells (37), thus it provides a model for the studies on a broad range of metastatic features.
Banka et al (38) showed that the expression of endog-enous ERα was not detected in 4T1 breast carcinoma cells. Figure 11. The in vitro proliferation inhibition and the osteopontin secretion to the culture media of 67NR and 4T1 cells after treatment with calcitriol or its analogs. (A) The proliferation inhibition curves. (B) Osteopontin secretion to the culture media at various time points after incubation with calcitriol or its analogs. Color bars, black, control medium; gray, ethanol control; blue, calcitriol; red, PRI-2191; green, PRI-2205. experiments were repeated thrice at least in triplicates. Data are presented as mean ± standard deviation. statistical analysis: (A) student's t-test, *P<0.05 as compared to 4T1; (B) sidak's multiple
Figure 12. Western blot analysis of the expression of selected proteins in 4T1 and 67NR cells cultured in vitro. (A) Western blot analysis of selected protein expression. (B) Representative blots. Color bars, black, control medium; gray, ethanol control; blue, calcitriol; red, PRI-2191; green, PRI-2205. experiments were repeated thrice. Results are expressed as mean ± standard deviation of protein tested to actin ratio and representative cropped blots. statistical analysis: Dunnett's multiple comparisons test. *P<0.05 as compared to both controls or as indicated.
Moreover, estrogens did not induce proliferation or Erk1/2 phosphorylation of 4T1 cells in vitro. However, estrogens can stimulate metastasis of such eR-negative tumors (39,40). Our study, similarly to other research (41), revealed that 4T1 tumors express ERα and β, and according to our results, the level of ERα decreased throughout tumor progression, whereas the level of ERβ remained unchanged. In cell culture studies, 4T1 cells did not show sensitivity to antiproliferative activity of calcitriol or its analogs (PRI-2191 and PRI-2205) as presented in this study and previously (27). Moreover, the in vivo experi-ment conducted on mice bearing 4T1 tumors transplanted orthotopically have shown that PRI-2205 did not affect the growth of primary tumors significantly, but enhanced the metastatic potential of 4T1 cells when used alone. However, when combined with cyclophosphamide, PRI-2205 improved its effectiveness (27). Now, in two independent experiments, we have shown that calcitriol and its analogs (PRI-2191 and PRI-2205) did not influence the primary tumor growth but increased the metastatic potential of 4T1 cells. Although calcitriol was used in lower dose (0.5 µg/kg) than other analogs, its toxicity was visible and manifested as a reduction in body weight and a rise in serum calcium level.
The significance of OPN (encoded by the Spp1) as a key molecule in the progression and metastasis of 4T1 cancer cells has been previously described (42,43). Moreover, OPN is corre-lated with advanced stage and metastasis of breast (44) and other (45-47) tumors and with resistance to chemotherapy (48). OPN revealed its activity using a number of receptors, including the integrins αvβ1, β3, or β5 and α4, α5, α8, or α9β1,
and it may also be a ligand for CD44 receptor (49-52). Directly through activation of these receptors or indirectly, OPN
acts as a chemotactic agent for macrophages and stimulates proinflammatory activity of macrophages, fibroblasts, natural killer (NK) cells, and endothelial cells, thereby inducing angiogenesis and collagen deposits (50,53,54). Furthermore, vitamin D responsive element (VDRE) in the promoter region of Spp1 has been reported (55), and the enhancement of OPN levels was found in various cells treated with calcitriol and its analogs (55-61).
In this study, in control tumor-bearing mice, the tumor OPN level increased, but tumor VEGF level decreased with progression of neoplasia. This is inconsistent with the data suggesting that exogenous, as well as tumor-derived OPN augments both VEGF mRNA and VEGF protein levels in breast cancer (54,62). However, in our tumor model, similar to other studies (63,64), the expression of mesenchymal markers such as sNAI1 and N-cadherin increased in subsequent days of tumor growth, whereas the expression of e-cadherin, typical for epithelial phenotype, decreased.
In the in vitro studies by Xu et al on rat mammary gland cancer cells, OPN levels were found to be increased by calcitriol and its analogs. Nevertheless, suppression of
β-catenin and upregulation of E-cadherin signaling was also noted, as authors suggest this can neutralize such adverse effect of calcitriol inducing OPN secretion (56). In our research model, calcitriol and its analogs did not influence the secretion of OPN into the culture medium of 4T1 cells and did not influence the levels of β-catenin, E-cadherin or N-cadherin in vitro. 67NR cell subline has been described as less inva-sive (65) and despite a lower level of VDR than in 4T1 cells, 67NR cells are sensitive to the induction of OPN secretion, as well as, for example, upregulation of N-cadherin expression Figure 13. Proposed mechanisms leading to lung metastasis enhancement by calcitriol and its analogs in 4T1 mammary gland cancer model.