HAL Id: hal-00304854
https://hal.archives-ouvertes.fr/hal-00304854
Submitted on 7 Oct 2005HAL is a multi-disciplinary open access archive for the deposit and dissemination of sci-entific research documents, whether they are pub-lished or not. The documents may come from teaching and research institutions in France or abroad, or from public or private research centers.
L’archive ouverte pluridisciplinaire HAL, est destinée au dépôt et à la diffusion de documents scientifiques de niveau recherche, publiés ou non, émanant des établissements d’enseignement et de recherche français ou étrangers, des laboratoires publics ou privés.
National flood modelling for insurance purposes: using
IFSAR for flood risk estimation in Europe
R. Sanders, F. Shaw, H. Mackay, H. Galy, M. Foote
To cite this version:
R. Sanders, F. Shaw, H. Mackay, H. Galy, M. Foote. National flood modelling for insurance purposes: using IFSAR for flood risk estimation in Europe. Hydrology and Earth System Sciences Discussions, European Geosciences Union, 2005, 9 (4), pp.449-456. �hal-00304854�
National flood modelling for insurance purposes: using IFSAR for
flood risk estimation in Europe
R. Sanders
1, F. Shaw
1, H. MacKay
2,
H.
Galy
1and M. Foote
11Willis Limited, Ten Trinity Square, London, EC3P 3AX, UK
2Intermap Technologies Inc., #200, 2 Gurdwara Road, Nepean, Ontario, Canada, K2E 1A2
Email for corresponding author: sandersr@willis.com
Abstract
Flood risk poses a major problem for insurers and governments who ultimately pay the financial costs of losses resulting from flood events. Insurers therefore face the problem of how to assess their exposure to floods and how best to price the flood element of their insurance products. This paper looks at the insurance implications of recent flood events in Europe and the issues surrounding insurance of potential future events. In particular, the paper will focus on the flood risk information needs of insurers and how these can be met. The data requirements of national and regional flood models are addressed in the context of the accuracy of available data on property location. Terrain information is generally the weakest component of sophisticated flood models. Therefore, various sources of digital terrain models (DTM) are examined and discussed with consideration of the vertical and horizontal accuracy, the speed of acquisition, the costs and the comprehensiveness of the data. The NEXTMap DTM series from Intermap Technologies Inc. is proposed as a suitable DTM for flood risk identification and mapping, following its use in the UK. Its acquisition, processing and application is described and future plans discussed. Examples are included of the application of flood information to insurance property information and the potential benefits and advantages of using suitable hazard modelling data sources are detailed.
Keywords: insurance, flood risk, DTM, IFSAR
Introduction
Insurance professionals in Europe are increasingly concerned about the potential for loss resulting from floods. This risk poses a major exposure to insurance companies, who face the problem of how best to price the flood element of their insurance products and manage flood exposures more efficiently.
Assessing flood exposure is not solely an issue for underwriters of domestic insurance classes such as households, but also has a considerable impact on insurers and reinsurers of industrial and commercial risks (Peterken and Foote, 2001).
A related and more political issue facing insurance companies is whether or not to provide insurance for floods. Unlike governments, the majority of insurance companies are profit-making organisations who, in addition to their duty to policyholders, have a duty to shareholders to produce an acceptable financial return on the risks underwritten.
Generally, insurers are under no obligation to provide flood insurance. However, understanding the significant role of insurance in the economic stability of a country, insurers will work together with government to ensure that a level of protection to businesses and individuals can be offered (Peterken and Edwards, 2001; ABI, 2002). It is therefore vital that insurance companies fully understand the flood risks they insure, particularly their likely frequency and severity.
Floods in Europe
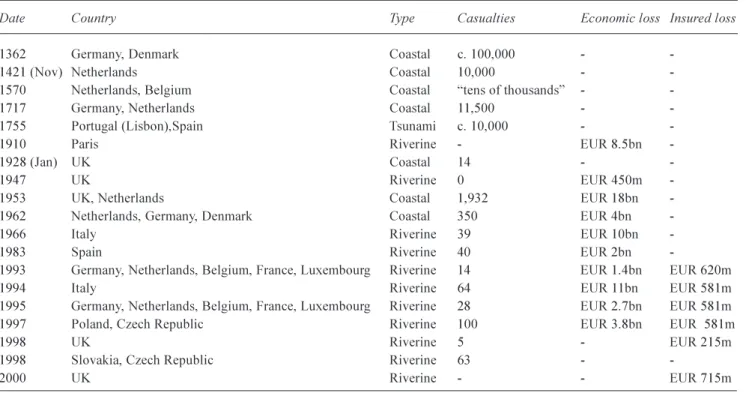
Vulnerability to natural disasters is increasing worldwide, primarily due to a rising population (Rodda and Rodda, 1999). Floods are a major hazard in Europe and have been so throughout history. Today the total flood risk is rising due to development on flood plains, increasing economic affluence and climate change. Historically, floods have
R. Sanders, F. Shaw, H. MacKay,H.Galy and M. Foote caused great fatalities, however, during the twentieth century; increasing spending on flood protection has reduced loss of life, and led to a greater focus on economic loss (Table 1).
The flooding in Europe during 2002 caused at least 112 deaths and many injuries and is estimated to have caused economic loss in excess of 15 billion Euro. Table 2 shows various estimates of economic loss arising from the recent floods. Traditionally, estimates rise during and shortly after an event, and begin to settle out during the following few months. This event has led to significant economic knock-on effects on major economies and has underlined the importance of floods on a national and international level.
Insurance losses from recent flood
events
The floods in Europe during 2002 resulted in significant losses to insurance and reinsurance companies (Table 3). Insurers compensate individuals and businesses not only for property damaged directly by floodwater but also for indirect financial losses. Where denial of access to a flooded area interrupts business, insurers can receive claims from sources far away from the geographical location of the flood. It is only by assessing the likelihood of primary flood losses accurately that these indirect consequences can also be predicted.
CLIMATE CHANGE
Following the publication of the IPCC Third Assessment Report in 2001 (IPCC, 2001a) a firmer picture of the likelihood and possible effects of climate change is available. Flood hazard is likely to increase across much of Europe (IPCC, 2001b) and this will have some effect on the insurance industry. Although recent events in Europe cannot in themselves be attributed to climate change, heavy rainfall and peak river flows have been increasing in duration and magnitude over the last 50 years (DEFRA, 2001a). In addition to precipitation events, an increase in coastal storm surge is predicted, with estimates of a rise of between 9 and 69 cm for parts of the UK during the next 50 years (Hulme
et al., 2002). Increasing numbers of insurers are therefore
relying on computer models to assess flood exposure.
Flood modelling for insurance
purposes
BACKGROUND
Flood modelling for insurance has developed during the last 15 years. Natural catastrophe modelling for insurance purposes began in the 1990s (Huntingdon et al., 2002) following the north European windstorms which occurred in 1987 and 1990 and led to considerable insured losses.
Table 1. Major historic losses in Europe
Date Country Type Casualties Economic loss Insured loss
1362 Germany, Denmark Coastal c. 100,000 -
-1421 (Nov) Netherlands Coastal 10,000 -
-1570 Netherlands, Belgium Coastal tens of thousands -
-1717 Germany, Netherlands Coastal 11,500 -
-1755 Portugal (Lisbon),Spain Tsunami c. 10,000 -
-1910 Paris Riverine - EUR 8.5bn
-1928 (Jan) UK Coastal 14-
-1947 UK Riverine 0 EUR 450m
-1953 UK, Netherlands Coastal 1,932 EUR 18bn
-1962 Netherlands, Germany, Denmark Coastal 350 EUR 4bn
-1966 Italy Riverine 39 EUR 10bn
-1983 Spain Riverine 40 EUR 2bn
-1993 Germany, Netherlands, Belgium, France, Luxembourg Riverine 14EUR 1.4bn EUR 620m
1994 Italy Riverine 64 EUR 11bn EUR 581m
1995 Germany, Netherlands, Belgium, France, Luxembourg Riverine 28 EUR 2.7bn EUR 581m
1997 Poland, Czech Republic Riverine 100 EUR 3.8bn EUR 581m
1998 UK Riverine 5 - EUR 215m
1998 Slovakia, Czech Republic Riverine 63 -
Table 3. Insured losses from 2002 floods in Central and Eastern Europe
Insurer/Reinsurer Loss estimate Notes* Source*
Zurich EUR 136 155m Reuters (Sep 5)
Allianz Europe EUR 550m Reuters (Oct 10)
Allianz Czech EUR 112m 2800 claims Allianz (03.02.2003)
Allianz Austria EUR 120m Guy Carpenter (Aug 30)
Allianz Global EUR 664m Third quarter results 18 Nov Www.tradingcharts.com
Kooperativa (Czech) EUR 320m Czech association of insurers website 02.2003
Ceska pojistovna (Czech) EUR 288m Czech association of insurers website 02.2003
Swiss Re EUR 165m Swiss Re (Sep 10)
Munich Re EUR 495m Munich Re third quarter results Munich Re
Partner Re EUR $120m Partner Re third quarter results Partner Re
Hanover Re EUR 46.5m Hanover Re Third quarter results Hanover Re
Converium EUR 39m Converium third quarter results Converium
* All 2002 unless marked otherwise
Table 2. Economic losses from 2002 floods in central and eastern Europe
Countries Loss estimate Notes Source
Czech Republic EUR 2.6bn EUR 1bn insured (estimated 95% Czech Insurance Association
reinsured) 31.01.03
Germany EUR 9.2bn* German Govt. loss estimate UIB Market update
(15 Nov, 2002)
Austria EUR 3bn EUR 200m insured Swiss Re (10 Sep, 2002)
Slovakia EUR 35m Guy Carpenter (30 Aug, 2002)
*on 25th September, 2002, Reuters reported a loss estimate of EUR15bn
Industries Loss estimate Notes Source
CEZ EUR 27m State electric company www.wood.cz
Spolana chemical works EUR130m Cleanup estimates for contaminated Www.rivernet.org
buildings of state petrochemical company,Unipetrol
Locations Loss estimate Notes Source
Prague Metro EUR 75m Reuters (Oct 17, 2002)
Czech Cultural monuments EUR 74m Museums, galleries, theatres, libraries Www.reliefweb.int
and institutions and church buildings
However, the use of flood modelling by insurance companies is lagging behind their adoption of, for example, earthquake modelling (Bommer et al., 2002).
Flood maps are in the public domain in many countries
but in the UK such mapping has been of limited availability. Consequently, many insurers have developed their own flood maps, some of which may be better than those available to the government (Crichton, 2002).
R. Sanders, F. Shaw, H. MacKay,H.Galy and M. Foote Flood models range in complexity from simply intersecting a plane representing the water surface with a digital elevation model (DEM), to full three-dimensional solutions of the Navier-Stokes equations (Bates and De Roo, 2000). For insurance purposes, the requirement for detailed local hydrological models is usually overridden by the requirement for national or regional coverage. The insurance industry uses models for two main purposes, insurance rating and exposure analysis. Direct insurers are concerned with rating and must also be seen to use a consistent basis of rating for all policyholders. High resolution regional and national models rather than very detailed models of local hydrology are therefore required. Reinsurers are mostly concerned with accumulation of risk and may therefore be able to work at a lower resolution than insurers for whom rating is the primary concern. Insurance companies in the UK, for instance, wish to rate risks at either a unit postcode, which has an average of 17 properties (Raper et al., 1992), or at an individual address level. The models are required to provide either a flood risk for different return periods for all properties, or an event-based analysis based either on a single event, e.g. floods in the UK in the year 2000, or a probabilistic analysis based on historical and hypothetical events.
There is some resistance to non-government agencies carrying out flood risk analysis. A recent publication voiced the opinion that this work should be carried out by the Environment Agency and not left to individual developers that are only interested in particular sites (Huntingdon et
al., 2002).
WHAT FLOOD RISK INFORMATION DO INSURERS NEED?
To be able to assess and quantify accurately their potential exposure to flood events, and to price flood insurance products, insurers need detailed information on flood hazard and the vulnerability of the exposed property portfolio.
Insurance underwriters are primarily concerned with location, frequency and severity. The key questions are therefore: where will flooding occur, how frequently will it occur and how much damage could result? Supplementary questions concern depth of flooding, duration of flooding and the degree of flood protection, all of which affect the severity of flood damage.
To enable these questions to be answered, insurers need information. There is a wealth of data available to help with risk assessment and quantification, e.g. meteorological records, terrain data and hydrological data. However, the quality of these data must be known and understood if they are to add value to the risk assessment process. The facility
to combine and analyse the available data successfully is key to creating information that adds value to the insurers flood risk management process.
HOW CAN THE FLOOD RISK INFORMATION REQUIREMENTS OF INSURERS BE MET?
In the past, a lack of adequate hazard information has made the assessment of risk from flooding, both from tidal and non-tidal events, problematic.
One of the known problems with existing tools for the assessment of flood risk is the resolution of available terrain models. The key data set for flood modelling is the digital elevation model (DEM) on which the flood model is based. Existing UK flood risk maps were based on weak DEMs and were criticised publicly by leading engineering consultants (Burgess et al., 2000). In 2000, the then Ministry of Agriculture, Fisheries and Food commissioned three leading flood engineering consultancies to report on a
National Appraisal of Assets at Risk from Flooding and Coastal Erosion. The report by Halcrow Maritime, HR
Wallingford and the Flood Hazard Research Centre identified a number of weaknesses in the currently available data for establishing areas at risk from flooding. The consultants noted that a general limitation of existing information is that high resolution topographic mapping of flood areas is not consistently available (DEFRA, 2001b). This represents a significant problem for UK insurers who currently rely on the resulting maps for flood risk assessment.
However, advances in technology mean that higher resolution DEMs are now available. Their use in flood models for insurance purposes can contribute to the risk assessment process, providing better estimation of exposure and more accurate information for rating individual properties.
Sources of terrain information
Terrain information is generally the weakest component of sophisticated flood models. Terrain information includes both detailed information on land cover, which dictates resistance to floodwater distribution, and terrain elevation data which dictates downward flow of floodwater. The information required includes both Land Cover Maps (LCMs) and Digital Elevation Models (DEMs). The source data of the terrain information are the compilation of a variety of ground observations, supplemented by various remote sensing techniques, which are aerial and satellite measurements. The traditional sources of terrain information are government mapping agencies. The LCMs available
from national mapping agencies tend to be good to excellent in quality. The DEMs tend to be lacking in sufficient information for sophisticated flood modelling (Shaw and Sanders, 2001).
TECHNIQUES FOR COLLECTING TERRAIN INFORMATION
Ground observations, due to their manual data collection methods, tend to be used for provision of relatively localised terrain information. Remote sensing of terrain information makes possible the collection of data over broad areas, enabling entire regional and national drainage basins and flood zones to be recorded and analysed. The remote sensing techniques differ considerably, in the density of the sampling points, the accuracy of the sampling information and the level of effort, or cost, required to collect and process the data. The techniques currently employed for collection of terrain information include:
Ground Survey
Aerial Photography (Photogrammetry) Light Detection and Ranging (LIDAR)
Interferometric Synthetic Aperture Radar (IFSAR, both airborne and spaceborne)
Ground survey
Ground survey technology, which has existed for centuries, is the most accurate measurement of terrain information. These surveys can achieve highly detailed information regarding observation of land cover and +/ 1 cm terrain elevation accuracy. Ground surveys are still the accepted methodology for site-specific projects, such as civil engineering, that require the highest possible precision. The introduction of highly accurate Global Positioning System (GPS) survey equipment has provided significant improvements in the cost and acquisition time of elevation data; however, ground surveys are very expensive due to their intensive labour effort. For national and regional studies the cost and time requirement of undertaking ground survey is prohibitive.
Photogrammetry
Photogrammetry, which has existed from the early 20th Century, is based on the acquisition of aerial photography and the subsequent extraction of both land cover and elevation data by viewing the photos in a 3-dimensional photogrammetric workstation. Photogrammetry can provide precise land cover information and +/ 4 cm elevation accuracy. Photogrammetry usually demands considerable manual involvement in both data capture and extraction.
While automated data extraction methods, such as auto correlation, have reduced the time required for manual extraction of elevation points, these methods tend to smooth the measurement of the elevation points over wide areas. This can introduce significant errors for applications such as flood modelling that require a densely populated set of elevation points. Photogrammetry is a relatively expensive remote sensing option for large area mapping projects.
HRSC The High Resolution Stereo Camera (HRSC) is an
airborne imaging system which, with photogrammetric processing software, provides a very high resolution DEM. It has been developed by a group from DLR (the German Space Centre) and the Remote Sensing Group of the Institute of Geology, Geophysics and Geoinformatics from the Free University of Berlin. The current version of the system has a horizontal resolution of 15 to 25 centimetres and a vertical accuracy of 10 to 15 centimetres. The image data is obtained from a flight height of 3000 metres with a swath width of 1560 metres and includes panchromatic and spectral data. The system has been used for high resolution studies of cities and urban areas and other specific locations. (Nuekum et
al., 2001) LIDAR
LIDAR has become a widely accepted and validated option for collection of terrain information. There are over one hundred LIDAR data collection systems now operating globally, including many commercial operators and a small number of government agencies, such as the Environment Agency of England and Wales. These systems can provide highly accurate, +/ 10 cm, elevation data. LIDAR systems, mounted on fixed wing or rotary aircraft, have provided a significant benefit to many terrain 3-D landscape observation requirements, such as corridor mapping and line-of-sight applications. LIDAR mapping is limited by weather conditions, a small observation foot print of an area of interest and considerable data processing requirements. These factors have positioned LIDAR as a suitable technology for some areas of interest, but the technology is generally cost-prohibitive for target areas above 20 000 km². Nonetheless, LIDAR has emerged as a viable option for local and regional terrain information.
IFSAR
IFSAR is a relatively new digital mapping technology, developed for US military applications where high resolution image data and precise elevation data are required in areas of interest where significant use of ground control is not an option.
R. Sanders, F. Shaw, H. MacKay,H.Galy and M. Foote antennae mounted on an aircraft and displaced by a known distance. This antenna separation is referred to as the interferometric baseline. One antenna acts as both a transmitter and receiver, the second as a receiver only. The baseline provides a slightly different path length in the reflection of the radar pulses from terrain points back to the antennae. This path length difference, or phase difference, coupled with precise aircraft positional data, provides the information required to measure the terrain elevation points. IFSAR is probably best known through the radar earth observation satellites such as the European Space Agencys ERS 1 and 2, the Canadian Space Agencys Radarsat and NASAs Shuttle Radar Topographic Mission (SRTM). Airborne IFSAR systems differ from the orbiting platforms and offer several distinct advantages for flood modelling and additional applications where improved vertical accuracies are required.
Operational radar satellites have one antenna, which means that they must observe an area on two passes to collect the two data sets required for interferometric measurement of elevation. The airborne IFSAR systems utilise two radar antennae, enabling single pass data collection. The single pass system provides a significant reduction in time and resources expended, as well as measuring a target area during single, rather than multiple, observations.
The other main advantage of airborne IFSAR systems is the superior vertical accuracy. The orbiting satellites are limited to a +/5 metre vertical accuracy at best. This is not sufficient for the requirements of detailed flood modelling but can be of use in coarse models. Airborne IFSAR system is capable of collecting for instance, +/1 metre vertical data from a flight altitude of 28 000 feet and +/50 cm from a flight altitude of 20 000 feet.
Unlike aerial photography, IFSAR systems are not dependent upon sunlight for viewing the target area, using instead the microwave energy transmitted from the aircraft for target illumination. This allows data capture by day or night. The ability to acquire data at night is a significant benefit when operating in an area of exceptionally heavy daytime air traffic. IFSAR technology also avoids the schedule delaying data acquisition window of aerial photography, which is confined to just 2 hours +/ solar noon to prevent shadows in the imagery.
The systems are also reasonably weather independent. This capability permits data capture in cloudy and rainy conditions that would ground optical airborne systems, a significant advantage, not just in Great Britain but also in any coastal or tropical environment. The only significant weather limitation is severe wind aloft. The elevation and image data sets, which are collected simultaneously, are fully geo-referenced without further processing.
Summary of available methods
Of the systems detailed above, the airborne photogrammetric system, the LIDAR and the IFSAR are capable of producing high resolution DEMs, within a limited timescale. The IFSAR has several advantages for the collection of data for flood modelling across a national territory such as the UK, namely the speed of acquisition and processing, combined with an accuracy which is comparable to that of the other components of a flood model, the ability to collect data at night when air-traffic control regulations allow survey planes to fly, the ability to fly in cloudy conditions and the price and data size of the output. Although there is nothing inherently limiting in the alternative technologies to prevent them being used for such a national project (Mercer, 2001) the IFSAR is most suitable.
It should be noted that the systems discussed here are not mutually exclusive, although IFSAR is more suited to large regional and national surveys; fusing or merging LIDAR or photogrammetric DEMs into an IFSAR DEM in areas such as high density urban centres is frequently carried out. Such an amalgamated data set utilises the best characteristics of each of the data sets. (Damon, 2002)
UK flood modelling
Flood modelling for insurance in the UK was originally centred around coastal flood risk which was perceived to be the major interest The Proudman Oceanographic Laboratory report (Dixon and Tawn, 1994) provided estimates of coastal surge depths for different return periods at sites around the UK. Ordnance Survey 1:10 000 scale mapping provided a basic elevation model. It was considered that coastal flood was less sensitive to poor data than riverine flood. With the development of new sources of elevation data such as IFSAR and the development of the Flood Estimation Handbook from CEH (CEH, 1999), it became possible to model the more sensitive issues of riverine flood. The first commercial use of IFSAR data in the UK was the Thames flood model, in a pilot project undertaken in 1998/99. Elevation data was aquired in the River Thames drainage basin for use in a new flood risk analysis system. The availability of IFSAR for collection of data over a wide area in a short time without compromising resolution was a key factor in the commercial viability of the project.
The project used flood data provided for the River Thames by HR Wallingford which also provided validation on methodology. The project covered the main reaches of the river which is more than 240 km long and is both tidal and non-tidal. (Galy and Sanders, 2001; Sanders and Tabuchi, 2000). Considerable research has been carried out to determine loss estimates by water depth (Black and Evans,
1999) and this was used as one input into the loss estimation methodology which is a key part to using flood model results to estimate losses.
The project made use of both the high accuracy and the high resolution of the elevation data to produce the most accurate regional model available in the UK. The model allowed insurers to carry out portfolio analysis and site analysis in the Thames floodplain which carries the highest economic risk in the UK. (DEFRA, 2001). The flood model was made available to insurers in 1999 and has provided considerable information regarding flood exposure.
NEXTMAP Britain
In 2001 it was recognised that there would be widespread interest in many markets for a consistent, high accuracy national DEM of Britain. This prompted the announcement of the NEXTMap Britain programme. The NEXTMap Britain programme is one of a series of NEXTMap programmes being undertaken worldwide. The intention is to capture high accuracy elevation data of selected North American, European and other nations.
TECHNICAL SPECIFICATION OF STAR-3I SYSTEM
The STAR-3i system used for NEXTMap Britian is an X-Band, single-pass and across-track airborne IFSAR system. The system is side-looking, has a wavelength of approximately 3 centimetres, and a typical incidence angle range of between 30 and 60 degrees. The system is permanently mounted in a dedicated LearJet 36 aircraft, and has two antennae mounted in a solid invar frame with a 1 metre baseline. (Li et al., 2002)
TECHNICAL SPECIFICATION OF NEXTMAP BRITAIN
Most of the NEXTMap Britain acquisition was flown at 28 000 feet to provide a 9-kilometre swath with a 1.5-kilometre overlap in flight lines. The vertical accuracy for the elevation data is +/1.0-metres RMSE. The data were collected at a flying altitude of 20 000 feet for south-east England and captured elevation data for approximately 50 000 km² with a vertical accuracy of 50-cm RMSE. Both data sets have a DEM posting of 5.0 metres, resulting in 11.2 billion sample elevation points. The ortho-rectified radar image (ORI) resolution is a consistent 1.25 metres, resulting in 179.2 billion image pixels. The elevation data and the ORI are fully geo-referenced to each other, allowing the ORI to be draped over the DEM to support analysis in a 3-D environment. Data were collected during two 5-hour
missions per 24 hours, primarily at night. (MacKay, 2001) The fully ortho-rectified IFSAR imagery is being used by a major UK insurer for detailed LCMs and the highly accurate DEMs are the key elevation input to a river flood modelling process developed for this project.
Benefits
A key feature of the risk information system based on IFSAR elevation data is its accuracy, enabling unit postcode-level flood risk information to be captured and analysed at very detailed levels. Such detailed flood modelling provides insurers with:
l the ability to monitor exposure
l information to allow more accurate rating l improved exposure control
l better setting of reinsurance limits l potential for reduced losses
A key advantage is the opportunity to ensure that the technical rating of the portfolio is more accurate. Flood risk is just one part of the rating process, but it has caused disproportionate effects on operating results. Improved understanding of the true risk exposure will enable the reclassification of low, medium and high risk properties to provide a better risk-weighted income distribution.
This better understanding of the flood risk exposure at the direct insurance level provides a sound basis for assessment of the associated reinsurance requirements.
Conclusions
Insurance plays a fundamental role in natural hazard management. In many cases, insurers will pay the financial losses and reinstatement costs resulting from hazard events. Consequently, insurers are often willing to invest in analysis and mitigation measures prior to the occurrence of such events in an attempt to reduce their exposure to financial loss. Insurance companies are now turning to technological solutions to assess their flood exposures and to price the flood element of their insurance products. Historically, the flood risk information needs of insurers have been difficult to meet due to insufficient resolution of available elevation data and the cost of producing elevation data of acceptable resolution at a national and regional level. IFSAR is an appropriate source of terrain information relative to other sources. The Willis Thames flood project established that the NEXTMap DEM series from Intermap Technologies Inc. provides a suitable DEM for flood risk identification and mapping.
R. Sanders, F. Shaw, H. MacKay,H.Galy and M. Foote
References
Association of British Insurers, 2002. Statement of principles on
the provision of flooding insurance. ABI News Release, 26th
September 2002
Bates, P.D. and De Roo, A.P.J., 2000. A simple raster-based model for flood inundation simulation. J. Hydrol., 236, 5477. Black, A.B. and Evans, S., 1999. Flood damage in the UK: New
insights for the insurance industry: A report presenting the Dundee Flood Loss Tables. University of Dundee, Dundee, UK. Bommer, J., Booth, E., Spence, R., Erdik, M., Tabuchi, S., Aydinoglu, N., del Re, D. and Peterken, O., 2002. Development of an earthquake loss model for Turkish catastrophe insurance. J. Seismol., 6, 431446.
Burgess, K.A., Samuels, P.G., Chatterton, J.B., Penning-Rowsell, E. and Deakin, R., 2000. Assessment of economic value of national assets at risk from flooding and coastal erosion. Ann. Conf. River and Coastal Engineering. July 2000. M.A.F.F. CEH, 1999. Flood Estimation Handbook. Centre for Ecology and
Hydrology, Wallingford, UK.
Crichton, D., 2002. UK and Global Insurance Responses to Flood Hazard. Water International, 27, 119131.
Damon, J.J., 2002. Fusing LIDAR and IFSAR DEMs: A seven-step methodology. Proc. 22nd ESRI International User Conference, San Diego, California, USA.
DEFRA, 2001a. To what degree can the October/November 2000 flood events be attributed to climate change? DEFRA FD2304 Final Report. London, UK.
DEFRA, 2001b. National appraisal of assets at risk from flooding and coastal erosion, including the potential impact of climate change. Final report.
Dixon, M.J. and Tawn, J.A., 1994. Extreme sea-levels at the UK A-Class sites: Site-by site analyses. Proudman Oceanographic Laboratory, Internal Document No. 65, Bidston, UK. Galy, H. and Sanders, R., 2002. Using Synthetic Aperture Radar
Imagery for Flood Modelling. Transactions in GIS, 61, 3142. Hulme, M., Jenkins, G.J., Lu, X., Turnpenny, J.R., Mitchell, T.D., Jones, R.G., Lowe, J., Murphey, J.M., Hassell, D., Boorman, P., McDonald, R., and Hill, S., 2002. Climate Change Scenarios for the United Kingdom. The UKCIP02 Scientific Report, Tyndall Centre for Climate Change Research, School of Environmental Sciences, University of East Anglia, Norwich, UK.
Huntingdon, S., Knight, D. and MacDougall, K., 2002. Flood management tools. In: Flood Risk Management, G. Fleming (Ed.), Thomas Telford, London. 151168.
IPCC, 2001a. Climate Change 2001: Synthesis report. Contribution of Working Groups I, II and III to the Third Assessment Report of the Intergovernmental Panel on Climate Change, R.T. Watson (Ed.). Cambridge University Press, Cambridge, UK.
IPCC, 2001b. Climate Change 2001: Impacts, adaptation and vulnerability. Contribution of Working Group II to the Third Assessment Report of the Intergovernmental Panel on Climate Change, J.J. McCarthy, O.F. Canziani, N.A. Leary, D.J. Dokken and K.S. White (Eds.), Cambridge University Press, Cambridge, UK. Li, X. Baker, A.B. and Hutt, T., 2002. Accuracy of airborne IFSAR mapping Proc. 2002 FIG/ASPRS/ACSM Ann.conf., American Society for Photogrammetry and Remote Sensing.
MacKay, H., 2001. Mapping Great Britain at 1-Metre Z Values, The Ranger, J. Defence Geomatics, 2123.
Mercer, B., 2001. Comparing LIDAR and IFSAR: What can you expect? Proc. Photogramm. Week 2001, Stuttgart, Germany. Neukum, G. and the HRSC-Team, 2001. The airborne HRSC-AX
camera: evaluation of the technical concept and presentation of application results after one year of operations. Photogrammetric week 01, Wichmann Verlag, Heidelberg, Germany.
Peterken, O. and Edwards, T., 2001. Catastrophe risk management at government level: the motivations and options for risk export. Risk Technology Insights II, Willis, London, UK.
Peterken, O. and Foote, M., 2001. Flood and the energy industry how to quantify the true risk of flooding. Oil, Petrochemicals and Energy Risk Association, London 2001 http:// www.oilpera.co.uk/presentations/NaturalPerils0901/Willis.pdf Raper, J.F., Rhind, D.W. and Shepherd, J.W., 1992. Postcodes:
The new geography. Longman, Harlow, UK.
Rodda, J.C. and Rodda, H.J.E., 1999. Hydrological Forecasting. In: Dealing with natural disasters: achievements and new challenges in science, technology and engineering, The Royal Society, London. 7599.
Sanders, R. and Tabuchi, S., 2000. Decision support systems for flood risk analysis for the River Thames, United Kingdom. Photogramm. Eng. Remote Sens., 66, 11851193.
Shaw, F. and Sanders, R., 2001. UK Flood: risk and opportunity. Risk Technology Insights II, Willis, London, UK.