HAL Id: hal-03031989
https://hal.archives-ouvertes.fr/hal-03031989
Submitted on 30 Nov 2020HAL is a multi-disciplinary open access archive for the deposit and dissemination of sci-entific research documents, whether they are pub-lished or not. The documents may come from teaching and research institutions in France or abroad, or from public or private research centers.
L’archive ouverte pluridisciplinaire HAL, est destinée au dépôt et à la diffusion de documents scientifiques de niveau recherche, publiés ou non, émanant des établissements d’enseignement et de recherche français ou étrangers, des laboratoires publics ou privés.
Experimental study of the hygromechanical behaviour of
a historic painting on wooden panel : devices and
measurement techniques
Jean-Christophe Dupré, Delphine Jullien, Luca Uzielli, Franck Hesser,
Lorenzo Riparbelli, Cécilia Gauvin, Paola Mazzanti, Joseph Gril, Gilles
Tournillon, Danièle Amoroso, et al.
To cite this version:
Jean-Christophe Dupré, Delphine Jullien, Luca Uzielli, Franck Hesser, Lorenzo Riparbelli, et al.. Ex-perimental study of the hygromechanical behaviour of a historic painting on wooden panel : devices and measurement techniques. Journal of Cultural Heritage, Elsevier, 2020, �10.1016/j.culher.2020.09.003�. �hal-03031989�
Experimental study of the hygromechanical behaviour of a historic
painting on wooden panel : devices and measurement techniques
Jean-Christophe DUPRE1, Delphine JULLIEN2, Luca UZIELLI3, Franck HESSER1, Lorenzo RIPARBELLI3, Cécilia GAUVIN4, Paola MAZZANTI3, Joseph GRIL5,
Gilles TOURNILLON6, Danièle AMOROSO7, Philippe Hazael MASSIEUX7, Pierre STEPANOFF8, Marina BOUSVAROU8
1
Institut PPRIME, UPR 3346, University of Poitiers-CNRS, Poitiers, France
2
LMGC, Univ. Montpellier, CNRS, Montpellier, France
3
DAGRI, University of Florence, Florence, Italy
4
Cécilia Gauvin Consulting, the Netherlands
5
Université Clermont Auvergne, CNRS, Sigma Clermont, Institut Pascal, Clermont-Ferrand, France
6
Atelier Tournillon, Sainte Cécile les Vignes, F-84290, France
7
Atelier Amoroso Waldeis, Villeneuve les Avignon, F-30400, France
8
Musée Fabre, Montpellier, France
Corresponding author: Jean-Christophe DUPRE:, jean.christophe.dupre@univ-poitiers.fr
Abstract
This article describes the experimental devices and the processes used to study the hygromechanical behaviour of a historic painted wooden panel (La Sainte Trinité couronnant la
vierge, 1516, anonymous, Fabre Museum of Montpellier). A climate showcase was designed for
in-museum use, with two glasses allowing visitors as well as scientists to observe both sides simultaneously. The evaluation of the hygroscopic behaviour was done by measuring relative humidity (RH), temperature and variations of panel weight. Variations of panel shape, strain and curvature were observed by two methods: locally with three pairs of displacement transducers fixed on the rear face, and over the entire panel surface by a non-contact optical technique, stereo mark tracking, used simultaneously on both faces. The correlation between local and whole-field measurements was very good. Continuous monitoring (several data per hour over three years) was required to observe the behaviour of the panel during imposed climate variations. The first test, detailed in this paper, was performed before frame removal and panel restoration. It consisted in a stabilization of the panel at 52% RH during 2 months and an increase to 63% RH during 3 months. The small amount of total mass variations, from 31.980 kg to 31.910 kg at 52% RH and 32.088 kg at 63% RH, could not be explained without taking into account the phenomenon of sorption hysteresis. The whole field relief measurement exhibited a concave shape with a maximum amplitude of 16 mm. It showed that shape deformation, ie out-of-plane displacement, was convex bending with a maximum deflection of 1.5 mm and a maximum strain of 0.1 %. Comparable local data had been obtained by the optical and DKs methods. DKs results were ten times more accurate than optical ones. The horizontal strain exhibited a global shrinkage during initial stabilization and a global swelling during RH increase. Heterogeneity of the strain field can be related to the cracks observed on the back face, and to the glued cross-beams. Assuming a linear relationship between swelling and moisture content, we expected, for a 0.6% increase of moisture content, a radial strain of 0.10% and a tangential strain of 0.22%. These results are higher than the ones measured, which can be explained by the cross bars glued on the boards and the cracks. This comparison will be continued for the next stages (crossbars removal, panel restoration).
Keywords: Wood; panel painting; hygromechanical behaviour; optical method; strain
Highlights
Continuous monitoring of the deformation and strain of a historic panel painting in a museum A historic wooden panel painting is placed in a climate showcase to evaluate its hygromechanical behaviour.
Bending movements and strains are linked to humidity variations.
Study of the hygromechanical behaviour of a wooden panel painting using a balance, couples of displacement transducers and a non-contact optical technique,
Promoting public understanding of art conservation practice and collaboration between museum professionals and researchers
1. Introduction
An exhibition planned in 2018 at the Fabre Museum of Montpellier intended to promote public understanding of art conservation practice and collaboration between museum and research actors [1]. This project involved several research laboratories, curators of the Museum and restorers. This paper describes the initial part of this collaboration consisting in the assessment of the hygromechanical behaviour of a wooden panel painting, before and after its structural and pictorial conservation. Indeed such structures experienced frequent climatic variations during the several centuries of their existence, leading to deformations and cracks of the wooden panel that were transmitted to the paint layer [2][3][4]. In the past, rigid frames and structures were used to avoid distortions; nevertheless such devices could introduce large mechanical stress leading to serious damage to the artwork. Specifically, the artwork studied in this project showed large damage produced by an inappropriate "cradling" intervention implemented in an unknown period, mainly consisting of several cross-beams glued on the back face of the panel.
Modern conservation techniques try to prevent possible damage through flexible frames and structures. Their optimised design requires an improved knowledge of the hygromechanical behaviour of both the panel and the back frame designed and built on purpose [5][6][7].
The location of the artwork in the middle of a museum hall open to the public required the design and implementation of specifically build equipment: a climatic enclosure and a suitable optical measuring system. Furthermore, a continuous monitoring (several data per hour during three years) was necessary to follow the behaviour of the panel during the imposed climatic variations. The experimental set-up and the principle of the experimental techniques will be detailed in this paper, together with the first part of the experimental campaign. The data recorded to describe the hygromechanical behaviour of the panel are the temperature, the relative humidity, the variations of the panel weight and the deformations. The weight was determined using a balance placed inside the show case. Changes in the shape deformation and the panel strain due to the climatic variations, were observed using two methods: three sets of displacement transducers fixed on the back face of the panel measured local curvatures [8] while a non-contact optical technique, mark tracking, was used for the assessment of the entire surface of the panel [9][10][11][12]. The correlation between local and whole-field measurements will be verified. The following paper will cover the whole campaign, and address the effects of the original engaged frame, of the inappropriate "cradling" mentioned above, of the results of the conservation work, and of the flexible back frame added as a result of this study.
2. Research aim
In order to acquire extensive data on the hygromechanical behaviour of the studied panel painting we have developed an experimental set-up including: a showcase allowing humidity variations to be applied while keeping both the painted face and the back face of the panel visible to visitors of the museum; a balance for weight variation measurement; three sensors for local
strain measurement (deformometric kits, DK); and 2 stereo-image acquisition devices for the whole-field shape variation and strain measurement on the two faces of the panel. The monitoring allows us to show the correlation between the various data obtained and to describe the behaviour of the structure composed of the panel and its engaged frame, submitted to a variation of hygrothermal conditions.
3. Material and methods
3-1. The wooden panel and its original frame
La Sainte Trinité couronnant la vierge is an oil-on-wood panel of the sixteenth century,
anonymous, which can be attributed to Flemish or Spanish art (Figure 1-a). The panel is presented in a softwood frame, 135 mm wide and 40 mm thick in average, linked with eight metallic fasteners distributed around the periphery of the panel (Figure 1-b). Two metal plates with ring screwed in the upper part of the frame allow it to be fixed to the wall.
The unframed panel is 1370 mm high and 980 mm wide; the thickness varies between 10 and 13 mm. It consists of four vertical oak (Quercus sp.) boards numbered from 1 to 4 from right to left, mostly separated (unglued) from each other (blue lines on Figure 1-a). Vertical cracks have been detected (red lines on Figure 1-a) on boards 1 to 3. The boards are quarter sawn (radial grain), except board 4 which is flat sawn (tangential grain), connected by seven horizontal crossbars of section 35 mm (width) by 15 mm (thickness) made of fir (Abies sp.) and glued onto the oak planks (Figure 1-b). Additional vertical crossbars of same section of fir wood are nailed to them, thus forming half-lap joints. The vertical crossbars at the left and right edges of the back face are one piece, while the other four vertical crossbars are divided into six pieces. The entire back face of the panel and the crossbars is covered with a brown layer whose composition has been identified on a sample taken, by micro-chemical analyses completed with an analysis by Fourier Transform Infrared Spectroscopy. The material consists of a mineral component based on lead white (or ceruse) mixed with red earth (iron oxides) and an organic part of a lipid nature (oil). It seems that this layer is more of a paint than a wash. Finally, it is important to note the presence of other layers in the sample, including residues from preparatory layers, very thin, that can be identified with a sizing material.
The state of the panel described previously is an outcome of a previous conservation intervention, that may be regarded as inappropriate; the presence of the glued cross-beams clearly produced the vertical cracks in the boards, the separation between the boards, the cupping of the panel (different in its upper and lower parts), and the severe damage areas present on the paint layers, not described here.
Figure 1 : Front face (a) and back face (b) of the panel
3-2. Climate showcase
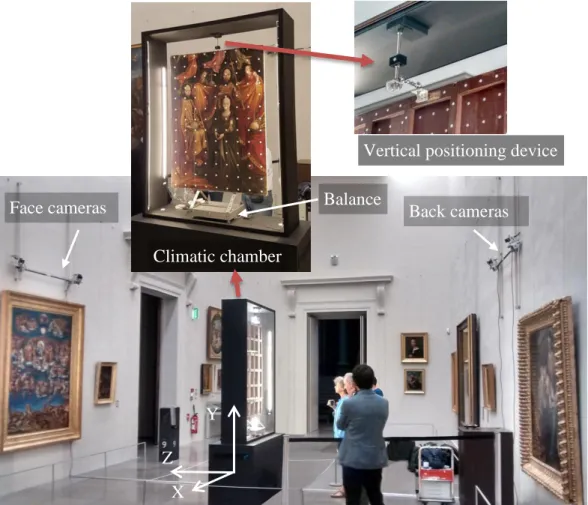
The showcase is made of four plywood panels and two anti-glare glasses that allow pictures to be taken, with dimensions 2400 mm × 1700 mm × 320 mm. It is mounted on a storage cabinet in which the humidity generator, the display unit of the scale and the computer for data acquisition are placed (Figure 2).
The CIC-PMCG unit (Preservatech trademark) is a humidity generator that uses ionic electronic membrane to control the relative humidity (RH) in the showcase in the range 17% and 60% (with an accuracy of +/- 3%) at a temperature (T) between 0 and 40°C simply by drawing moisture necessary for microconditioning from the surrounding environment. 22 mm input and output silicone hoses allow for air distribution and recirculation. A RH sensor is placed in the showcase and connected to the unit to regulate the climate. A second independent sensor is placed inside the showcase and connected to the computer to continuously record RH and T. The equipment does not control the temperature, which therefore depends on the temperature of the Museum’s hall where the showcase is placed.
3-3. Weight measurement and isostatic restraint of the panel
The weight variation of the panel is measured using a Sartorius industrial scale, model Combics type CAWIP-1-60ED-I, with a range of 60 kg, an accuracy of 2g and dimensions of the plate of 400 mm × 300 mm × 94 mm. The weighing system uses a strain gauge sensor. The instrumented tray is connected by a 3 m cable to the display unit, itself connected to the computer via an RS232 interface.
The panel rests on the weighing pan, contact being made through two sliding supports that allow it to cup freely (Figure 2). It is held standing vertically by means of a horizontal connecting rod, terminated by two ball joints. One of these ball joints is connected to a steel bracket screwed to the back of the panel, near the centre of its upper edge, while the other one is connected to a second steel support rigidly bonded to the top of the showcase with a threaded rod to adjust the vertical position. This mechanism allows the panel to be held vertically, totally free to deform (realizing this way an externally isostatic constraint), and without affecting the weight measurement.
(a) (b)
Figure 2 : The apparatus in the museum: climate chamber, optical device and vertical positioning device
3-4. Local strain and cupping measurement
The panel is monitored with 3 Deformometric Kits (DKs) [8] glued at the back of boards 2 and 3: DK1 and DK2 are placed in the upper and lower parts of board 2 respectively, DK3 in the lower part of board 3, horizontally aligned with kit 2 (Figure 3-a). The locations of the DKs have been chosen on undamaged parts of the boards, crossing no wood cracks nor separations between the two columns, otherwise the instrumental reading of the DK would have taken into account simultaneously both the deformation of the support and the movements of the crack lips without the possibility of decoupling the two contributions. The DK is an instrument that allows the continuous local monitoring of the deformation dynamics of the wooden panel with respect to both the external forces applied and the hygroscopic coactions: in other terms, it allows to understand the reactivity of the panel, the evolution of the cupping over time, and under some hypotheses (detailed in [8], with the operating principles) the deformation of the panel in the proximity of the device. It consists (Figure 3-b) in measuring the distance a and b between the two columns by two displacement transducers. Knowing the vertical distances m and z, geometrical characteristics of each kit, it is possible to calculate the base dimension e where the columns are fixed. Assuming that the base line c and g are an arc of circle, it is possible to calculate their length and thus the circumferential strains and the cupping angle . Uncertainty is a function of geometric parameters. For example, we have obtained for DK1: a=168.2 mm, b=166.7 mm, m=70.5 mm, z=29.8 mm, which gives an uncertainty close to 0.02% in strain and 0.06° for the cupping angle. Although not all of the above assumptions are fully true in this case, however data resulting from DKs were very useful in monitoring the panel’s distortions and especially their evolution over time.
Face cameras Back cameras
Y
X Z
Climatic chamber
Vertical positioning device Balance
a) b)
Figure 3 : a) Position of the 3 deformometric kits b) schematic representation from [8]
3-5. Optical measurements
Several optical techniques have been used for mechanical studies of historic wooden panels. The fringe pattern profilometry technique (FFP) [9][18] gives the relief and out-of-plane variations of a panel. It is being used to measure the relief of Mona Lisa painting [18][19]. More recently shearography [16][17] coupled with FFP has been used to study the changes and damage areas of an artwork: FFP gives global variations of the out-of-plane displacement while shearograms detect local defects such as bubbles, delamination and tunnels caused by wood worms. These techniques are too complex to be implemented in a museum for automatic readings during several months and with visitors around. In addition, surface strains cannot be evaluated by FFP that gives only the relief. Photogrammetry, used in cultural heritage studies for 3D reconstruction of an object by multiple views [20], was also difficult to implement in this case.
It was finally decided to obtain the 3D coordinates of surfaces by methods based on a triangulation calculation with a stereoscopic vision system. Two techniques have been considered: stereo-correlation [13][14][15] and stereo-mark tracking [9][10][12]. Both give the coordinates and the displacement of the zones of interest by following particular marks on the surface - that is to say, a gradient of grey level. The first one uses the painting or the natural aspect of the wood as marks. The second one follows a series of markers placed on the surfaces. All tests were performed using DEFTAC3D, a homemade software which controls image acquisition and analysis, computing displacements and strains on the specimen surface. For the back face of the panel, only the second solution could be used because the optical appearance is uniform due to the brown coating. Furthermore, the shadow of the crossbars moved during panel movement and introduced errors in the correlation process. For the painted face, both techniques were tested and several images of the same panel condition were recorded and analysed. In this case, the expected displacements are zero so the standard deviation of the measured displacement can be used to compare the two methods and assess their performance (Table 1). For the painted panel La Sainte Trinité, DIC was not effective enough due to the low contrast, and dark or bright zones (Figure 4) gave a large error or decorrelation phenomenon (wrong results). By increasing the size of the subset (100x150 pixels2 to 200x200 pixels2) the standard deviation decreased thanks to the lower number of areas with a decorrelation phenomenon. A median filter eliminated these wrong results, dividing the uncertainty in z displacement by 10. However this procedure was difficult to implement in the other directions (x,y), so that the mark
1
tracking technique was finally preferred. It should be noted that the choice of method depends on the paint; for another painting such as Sainte Agnès (Figure 4), very contrasted with many details enhancing the correlation, DIC and mark-tracking techniques gave similar results, and a better accuracy than La Sainte Trinité.
Paintings Methods 𝜎𝑥 (mm) 𝜎𝑦 (mm) 𝜎𝑧 (mm)
La Sainte Trinité DIC (front) 0.2 (100x150) 0.14 (200x200)
1.98 (100x150) 0.34 (200x200)
0.94 (100x150) 0.25 (200x200)
mark tracking (front) 0.014 0.028 0.047
Sainte Agnès DIC 0.028 (150x150) 0.042(150x150) 0.045 (150x150)
mark tracking (back) 0.029 0.040 0.055
Table 1: Standard deviation of the 3 components of displacement, for DIC (with several subset sizes) and mark-tracking methods.
Figure 4 : Two examples of paintings: (left) La Sainte Trinité couronnant la vierge, 1516, oil-on-wood panel, Montpellier, musée Fabre, D61.1.379 (Depository of the Emile Zola Central Media Library) (before the removal of protections) and (right) Le couronnement de Sainte Agnès
entourée des scènes de sa vie, 1519, oil-on-wood panel, Montpellier, N° IOM3999, property of
the diocesan association of Montpellier, classified as a monument on 2005/05/02
3.5.1. Principle (see appendix A)
3D coordinates of the marks 𝑋̅ = (𝑋, 𝑌, 𝑍) are obtained by triangulation, knowing the position and orientation of the two cameras and the position of each mark in the referential of the two sensors, camera 1 and 2 (Figure 5-a) [9][10][21]. The procedure used by DEFTAC3D consists in defining a subset around each mark and an intensity threshold in order to extract the mark from the background (the painting). The marks could be white or black; in this case, the white colour was chosen. This procedure is automatic, the intensity threshold being modulated when the brightness of the images changes during the test, e.g. due to a modification of floor lighting or surface condition.
Displacements 𝑈̅ = (Ux, Uy, Uz) are obtained by calculating the difference in position between
two recorded images at different times or loading states. Uz represents the out-of-plane displacement.
a) stereoscopic device
(b) Strain tensor calculation (deformed state) (c) Cupping and local strain calculations Figure 5: Mark tracking technique, schematic representation of triangulation process and
principle of the calculation of the strain field and the local strain
3.5.2. Strain calculation
The strain can be calculated globally to visualize the strains on the panel surface, or locally to study, for example, the curvature (cupping) and local strain in a given direction.
2 2 x Cx2 Cy2 Cx1 Cy1 X Y Z L1 L2 1 1 dx1 dx2 X Y Z N 2 1 X Z
=
2-
1 1 2 3 back face 1 2 +3.5.2.1 Whole-field strain calculation (see appendix B)
The strains are calculated by a finite differences process on a subset defined by 4 marks, where the deformations are assumed homogenous (Figure 5-a). Two vectors (dX1, dX2) in the initial state and two vectors in the deformed state (dx1 , dx2) are defined. For each loading step, the normal 𝑁̅ to the surface, locally defined by the markers, is calculated. Following the process described in appendix B, the strain tensor locally defined in a referential (1,2) tangential to the surface is then calculated [9][10]. It gives the strain values in direction 1 and 2 and the shear strain (Figure 5-b). This process is repeated on the whole surface. In the studied case the direction 1 is close to the horizontal axis (X), so that in next sections, the deformation in direction 1 will be called horizontal strain.
3.5.2.2 Cupping and local strain calculation
This calculation is done with series of 3 marks aligned horizontally. Cupping angles are obtained as shown in Figure 5-c. Considering a small variation of the angles, the local horizontal strains are obtained with the difference in distance of marks 3 and 1. It should be noted that front and back faces are defined using the same orientation axis, so that <0 corresponds to a concave deformation of the front face and a convex deformation of the back face ([8]).
3.5.3. Performance
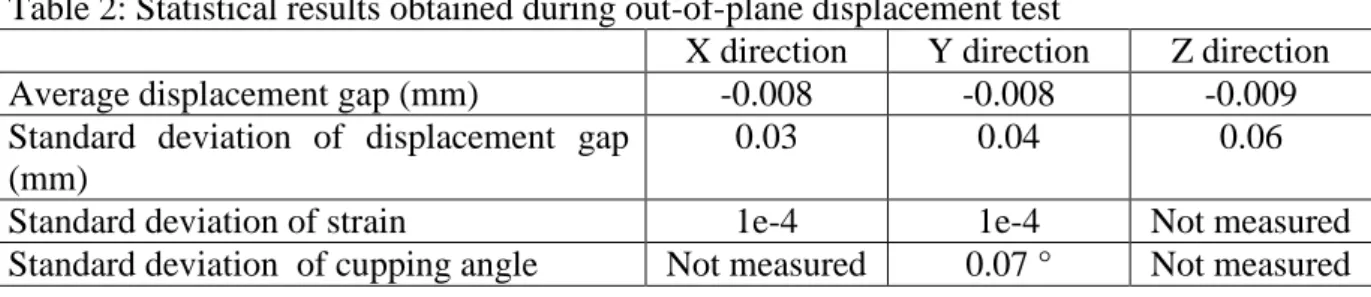
The study shown in Table 1 was sufficient to compare methods but not to evaluate the uncertainty, which was assessed by applying out-of-plane displacements of the grid used for calibration in the range of -20 to +20mm with a 5mm step. Such displacements induce variations of grey levels and distortion and are another source of error that can disrupt results. The bias error between imposed and measured displacements resulted in a standard deviation of 0.03 to 0.06 mm in the 3 directions (Table 2). The expected strain being equal to zero in this case, its calculated standard deviation (0.01%) gave a direct estimate (Table 2). Assuming a confidence interval of 95%, the uncertainty, defined as twice the standard deviation, is 0.06, 0.08 and 0.12 mm for the 3 displacements, 0.02% for strain and 0.14° for cupping angle.
Table 2: Statistical results obtained during out-of-plane displacement test
X direction Y direction Z direction
Average displacement gap (mm) -0.008 -0.008 -0.009
Standard deviation of displacement gap (mm)
0.03 0.04 0.06
Standard deviation of strain 1e-4 1e-4 Not measured
Standard deviation of cupping angle Not measured 0.07 ° Not measured
3.5.4. Arrangement of the devices
Small white stickers were placed on both faces of the panel; round markers were cut out of Japanese paper and reversibly attached to the paint layer with a weak adhesive face (9x13 marks) (Figure 2). Sticky round labels were glued on the back face (Figure 3-a) allowing to assess the panel and/or the cross bars (studied grid 10x12 marks).
Four cameras were placed on the walls to record images of both faces (Figure 2). The painted panel is placed in the climate chamber with two anti-reflective glasses. The lighting is done by 4 LED strips in the left, right, top and bottom edges of the showcase. The optical deviations due to the thickness of the glass are taking into account in the calibration process.
4. Results
The campaign presented in this paper concerns the first study period corresponding to a stabilization of the relative humidity of the panel - engaged frame assembly maintained at 52% RH then at 63% RH. Temperature T is not controlled but stays at 23+/-3°C
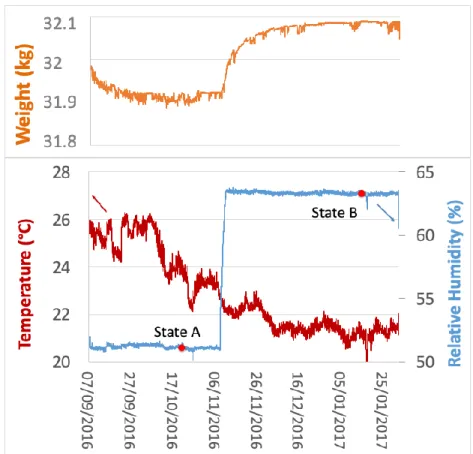
Figure 6: Evolution of temperature, relative humidity and mass of the panel-frame assembly.
4-1. Interpretation of weight measurement
Wood is a hygroscopic material: it absorbs and releases water to be in equilibrium with its environment. Figure 6 shows the evolution of the mass of the panel and its frame, according to the RH and T ambient conditions. From 7 September to 7 November 2016, the assembly made of the panel and its engaged frame was subjected to a constant RH of 52%. Starting from an initial mass of 31.980 kg, it has reached a stable mass of 31.910 kg after two months. Then the environment was set to 63% RH, and the mass stabilized at 32.088 kg after 3 months.
The total mass of 32kg is distributed into 16 kg of softwood frame, 1 kg of metal pieces fixed on it, 4 kg of fir reinforcement, 1 kg of deformometric kits and 10 kg of oak panel. The relationship between the equilibrium moisture content (EMC) of the wood and the RH of the environment at a given T is classically represented in the literature by two hygroscopic equilibrium curves: adsorption and desorption isotherms, for increasing and decreasing RH respectively, thus introducing the hysteresis phenomenon. The moisture content (MC) of wood in a varying
environment tends to reach an EMC placed between these two curves, according to a trajectory that depends on the history of climatic conditions. Varnier [22] proposed equations for these boundary curves based on a limited number of parameters:
𝑤+(ℎ) = 𝑤𝑠. exp[𝜑+. ln ℎ . exp(𝛼+ℎ) ] (1)
𝑤−(ℎ) = 𝑤𝑠. exp[𝜑−. ln ℎ . exp(𝛼−ℎ)] (2) where h is the RH value, 𝑤+ and 𝑤− the EMC of the adsorption and desorption isotherms,
respectively, 𝜑± and 𝛼± constants defining the shape of the isotherms, and 𝑤𝑠 the fiber saturation point (FSP), i.e. the EMC reached by wood in a saturated environment (h=100%). The FSP depends on T according to :
𝑤𝑠 = 𝑤𝑠0− 𝛽. 𝜃 (3)
where 𝜃 is the value of T expressed in °C, 𝑤𝑠0 the FSP at 0°C and 𝛽 a constant. According to
Varnier [22] 𝑤𝑠0 and 𝛽 depend on the wood species while 𝜑
± and 𝛼± can be given sets of values
for all softwood species and for all hardwood species. Parameter estimates are given in Table 3 for each of our wooden parts: douglas for the frame, spruce (similar to fir) for the reinforcement, oak for the panel.
The temperature inside the climate showcase was influenced by the ambient temperature, lower in winter; we recorded an average value of 24°C and 21°C for the relative humidity levels of 52% and 63% respectively. Table 4 shows the expected values of EMC in adsorption (w+), desorption (w+) and mean value <𝑤±>, for the two considered environments, for each species, calculated from equations (1) and (2). The “total” line is calculated from the moisture contents obtained for each species, considering the proportion of the different types of wood, indicated in the last column.
Assuming that the initial mass corresponds to a MC of 11.3%, average of the mean values of the two considered states (10.2% and 12.4%), we can estimate the dry mass of wood of the panel-frame assembly as m0=30/1.113=26.9 kg and thus calculate the mass corresponding to each
EMC. The 2 kg mass of metal pieces and deformometric kits is kept constant.
Table 3: Constants used to described sorption isotherms according to equation (3) [22] 𝑤𝑠0 (%) 𝛽 (10-3
) 𝜑+ 𝜑− 𝛼+ 𝛼−
Douglas (frame) 29.4 1.02 0.820 0.761 1.435 0.988
Spruce (fir reinforcement) 30.4 1.12
Oak (panel) 33.4 1.08 0.849 0.852 1.647 1.088
Table 4: Estimates of EMC and corresponding total weight
T, RH 24°C, 52% 21°C, 63% initial mass w+ (%) w- (%) <𝑤±> (%) w+ (%) w-(%) <𝑤±> (%) proportion Douglas 8.7 11.7 10.2 10.7 14.2 12.4 53.3% Spruce 8.9 12.0 10.5 11.0 14.5 12.8 13.3% Oak 8.3 11.6 12.7 10.3 14.3 12.3 33.3% Total 8.6 11.7 10.2 10.6 14.2 12.4 m+ m- measured m+ m- measured Mass kg 29.3 30.1 29.9 29.8 30.8 30.1
m+ and m- : corresponding total weight compared with measured value.
Figure 7 illustrates how the mass of wood evolves, from its initial value of 30kg at intermediate RH (estimated at 57.5%), to the stabilized value at 52% RH and then at 63% RH. It does not reach the adsorption or desorption curves but follows their trends. We have measured a small increase of 0.6% of the mass of the panel-frame assembly, from 52 to 63% RH: this is much smaller than the 2.0% corresponding to the increase of adsorption curve on this interval. These measurements clearly show the error being made by an estimation solely based on the adsorption, desorption or even average curves for predicting a change in moisture content resulting from a given RH variation.
Figure 7: Measured mass as function of relative humidity, compared to adsorption and desorption curves calculated in table 4.
4-2. Relief measurement
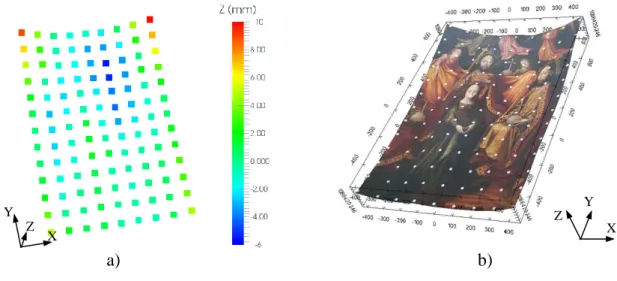
3D coordinates of each marks have been represented on Figure 8-a. The relief of the panel was concave with an amplitude of 16 mm (Figure 8). The maximum of the curvature is located on the upper part of the panel especially on the two corners. Bilinear interpolation between these data allows us to view a mapping of the painting. The back face relief was also determined and gave similar results.
a) b) X Y Z X Y Z
Figure 8: Panel relief of the front face (Z values x10): a) 3D coordinates of the marks, b) a mapping view using ParaView software (bilinear polynomial interpolation and assumption of a continuous relief field).
4-3. Deformation of the panel induced by relative humidity (RH)
4.3.1. Whole-field analysis
This section analyzes the deformations of the panel, as provided by the collected data. A more thorough analysis will be provided in a future paper, with greater attention to conservation aspects. It should be however borne in mind that the deformations here considered are strongly influenced by the presence of the glued cross-beams, which can be seen as the result of an inappropriate intervention that strongly contributed to the separation and cracking of the boards, and to the damages of the paint layers.
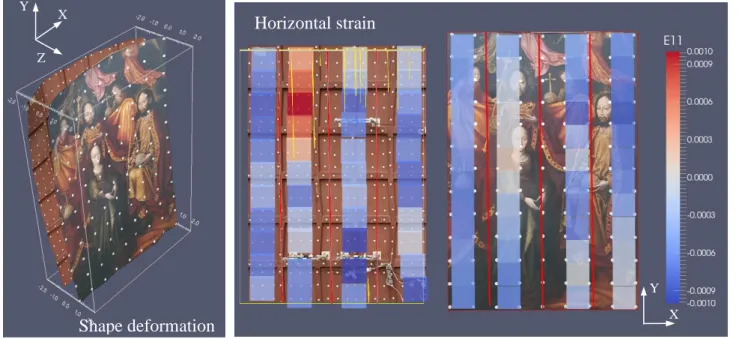
The out-of-plane displacements of the two faces of the panel were plotted (Figure 9) for states A and B, i.e. after stabilization in the climatic chamber of the panel and after a 10% RH increase and stabilization, respectively (see Figure 6). In the first few days we observe a concave bending due to the decrease in the moisture content of the wood (Figure 9-a). After 40 days, no more change is observed (state A). The increase in RH results in a stabilized convex bending on state B. As the initial state was not a stabilized state of the panel, we have observed that the out-of-plane displacement values are a small convex bending due to the 10% increase in RH. Taking state A as the new initial state, we can observe (Figure 9-b) the effect of the 10% RH increase with a maximum deflection of 1.5 mm.
Note: According to the fixation system described in previous section 3-3, the centre of the upper edge of the panel should show no out-of-plane displacement. In fact, the vertical threaded bar proved to be insufficiently rigid, and the horizontal connecting rod suffered variable out-of-plane displacements (Figure 9) under the action of the variable overturning moment, which was produced by the progressive horizontal displacement of the centre of gravity of the deforming panel.
a) State A versus initial state
b) State B versus state A
Figure 9: shape deformation and horizontal strain of the front and back faces of the panel relative to the initial state (September 2016) or relative to the stabilised state A, view from the
front face (cracks in yellow, joints between the boards in red)
The strain fields of the painted front face and of the back face have been plotted for each of the 4 vertical oak boards, for which a continuous material has been assumed (Figure 9). We focus here on the horizontal strain E11 because it corresponds to the radial or tangential direction
of the material, perpendicular to the grain of the boards, which presents the most significant moisture-induced deformations. Relatively to the initial condition in September 2016, E11 strain
exhibits a global shrinkage during initial stabilization and a global swelling during the 10% RH increase (Figure 9-a). As with the visualization of the out-of-plane displacement, to observe the effect of +10% RH, state A was taken as the reference state (Figure 9-b). The panel is mainly
Shape deformation X Y Z X Y Z Horizontal strain X Y X Y Horizontal strain Shape deformation
subjected to a swelling with an average strain of about 0.08%. A heterogeneous strain field is observed, especially on the back face; these heterogeneities, for example in the upper left corner of the panel, being related to the cracks observed on the back face (in yellow on Figure 9), and to the glued cross-beams possibly having produced them. In these areas a positive strain can be interpreted as the opening of a crack and a negative one as the closing of a crack. We have to note that in the back view, the pitch of the strain field is not regular because some subsets have been shifted to avoid the overlapping by the Deformometric Kits.
An increase of about 0.6% of moisture content between states A and B has been measured. According to the literature [23] the mean swelling coefficients of oak are 4.5% and 9.7% in radial and tangential directions, between dry and saturated states, with a fibre saturation point of 31%. Assuming a linear relationship between swelling coefficients and moisture content, we can roughly calculate that an increase of 0.6% of moisture content corresponds to a radial strain of 0.10%, and a tangential strain of 0.22%, in the case of unrestrained boards.
Considering the orientation of the boards, we could have expected higher values of strain in board 4 (on the left edge), which is a tangential board, compared to boards 1 to 3 which are radial boards: on the contrary, we cannot observe a significant difference. Anyway, the observed horizontal strains, ranging from 0.0 to 0.1%, are obviously limited by the effect of the crossbars (which are glued on the boards with their longitudinal direction perpendicular to the longitudinal direction of the boards) and disturbed by the effect of the cracks in the upper parts of the boards 1, 2 and 3. The engaged frame may also contribute to restraint the deformation of the panel painting.
4.3.2. Local analysis
The local analysis is done using the 3 DKs placed on the back of the panel and giving locally and accurately the strain and the cupping angle. With the optical technique it is possible to obtain comparable values with a lower accuracy (uncertainty of 0.02% for strain and 0.14° for cupping angle, respectively 0.003% and 0.014° for the DKs). An average filtering (on 24 data) is applied to the results (grey points). Nevertheless, the instrumental readings taken with optical methods and with DK show a good agreement, both for the values and for their evolution over time (Figure 10). It should be noted that the same filtering can be used on the DK strain.
a) Horizontal strain
b) Cupping angle
Figure 10: Comparison between data obtained by the DK1 and the mark tracking method
5. Conclusion
Several devices and techniques have been developed and used to study the hygromechanical behaviour of a wooden panel visible in situ in a Museum hall open to the public. First, an RH-controlled showcase has been developed to control variations of the micro-environmental conditions surrounding the panel. It has been designed to be placed in a museum, with two glasses allowing the visitors to see both faces of the panel and also the use of optical techniques. A balance was included to measure the variations of panel weight. The DKs allowed us to follow accurately the local curvature and deformation on chosen zones and directions. They could be used continuously even if the panel was moved. The used optical technique was a non-contact
and non-disturbing method even if in this case we had to put marks on the two surfaces. It provided global data (displacement and deformation) on the whole front and back faces of the panel and can be used locally too, even if the accuracy is lower than that of DKs.
The combination of these techniques allows us to study the hygromechanical behaviour of a wooden panel painting. Mass measurement, global deflexion and strain with optical techniques, local strains with DKs are complementary. A study of the painting including the hygrothermal conditions, the effects of the frame and of the conservation, will be presented in a next paper.
Acknowledgement
The authors sincerely thank the Fabre Museum, its staff and all the involved professionals, for their dedication and for the support provided.
Funding:
This research work has been based on a formal joint agreement [Contract number 160574] between Montpellier Méditerranée Métropole (the Fabre Museum financing institution) and the Universities of Montpellier, Poitiers and Firenze.
Appendix A : Principle of the mark-tracking method
The first step consists in calculating the coordinates 𝐶̅𝐶1 and𝐶̅𝐶2 of each mark in the referential
of the two sensors (camera 1 and 2) (Figure A-1): [9][10][21]
𝐶̅𝐶𝑗 = (𝐶𝑥𝑗 𝐶𝑦𝑗) = ( ∑ 𝑥𝑖(𝐼𝑖−𝐼𝑠)𝑖 ∑ (𝐼𝑖−𝐼𝑠)𝑖 ∑ 𝑦𝑖(𝐼𝑖−𝐼𝑠)𝑖 ∑ (𝐼𝑖−𝐼𝑠)𝑖 ) with j=1,2 (A.1)
i is the index of each pixel of (𝑥𝑖, 𝑦𝑖) coordinates and 𝐼𝑖 grey level. A subset is delimited around each mark defining the area of interest. 𝐼𝑠 is an intensity threshold of the studied subset. This last defines whether a pixel belongs to the markers or is a part of the image background. These subsets are automatically defined, furthermore their intensity threshold can be modulated when the brightness of the images changes during the test (due to a change in the lighting of the floor, a change in the surface condition ...), for example, according to the average of the values of the subset.
The 3D coordinates 𝑋̅ = (𝑋, 𝑌, 𝑍) of the marks are given by: {R̿1 X̅ = G̿1 C̅C1
R
̿2 X̅ = G̿2 C̅C2 (A.2)
With 𝐺̿1, 𝐺̿2 the transformation matrix (1, 2,L1, L2 the magnifications and the positions of the
cameras) and 𝑅̿1 , 𝑅̿2 the rotations (angular positions: 1, 2,1, 2) ((Figure 5-a)
Displacements are obtained by calculating the difference in position between two mechanical states: 𝑈̅ { Ux(𝑋, 𝑌, 𝑍(𝑋, Y)) Uy(𝑋, 𝑌, 𝑍(𝑋, Y)) Uz(𝑋, 𝑌, 𝑍(𝑋, Y)) (A.3)
Calibration is required to obtain geometric parameters. It consists in solving formula (A-2) using data obtained from images of a grid of marks with known positions of points. A recording of several images for different grid positions allows to calculate the parameters and to identify a 3D polynomial function related to optical distortion We have to note that the calibrations of the two couples of camera are done in the same referential, the coordinates and displacements obtained are then in the same referential too (X,Y,Z)
Appendix B : Strain tensor calculation
The strains are calculated by finite differences on a subset defined by 4 marks. Two vectors (dX1, dX2) in the initial state and two vectors in the deformed state (dx1 , dx2) are calculated (Figure 5). For each loading step, the normal 𝑁̅ to the surface, locally defined by the markers, is calculated. It gives two angles (, ) defining the orientation of the normal both in the initial state and in the deformed state.
The gradient tensor of the transformation F̿ [9][10] is obtained by solving the system dXiF̿dxi with i = 1,2:
F̿ = [
FXX FXY 0 FYX FYY 0 FZX FZY 0
] (A.4)
Each component of this tensor is expressed by the coordinates and displacements of the four marks. Then the 2D strain Green-Lagrange tensor 𝐸̿ located on the surface of the panel can be calculated in the referential (1,2). It represents the Lagrangian deformations assumed uniform in the area defined by the four marks [2]:
𝐸̿ = 12(𝐹̿𝑇𝐹̿ − 𝐼̿) = [E11 E12
References
[1] Dans le Secret des œuvres d’art, editors M. Hilaire, P. Stépanoff, Snoeck, Gand, 2018, ISBN: 97894-6161-434-6
[2] T. Arends, L. Pel, H.L. Schellen, D. Smeulders, Relating relative humidity fluctuations to damage in oak panel paintings by a simple experiment. Studies in Conservation (2018) 1-14. https://doi.org/10.1080/00393630.2018.1481351.
[3] L. Krzemień, M. Kot, M. Łukomski, Stress Assessment in Artistic Materials Using a Micro-Scratching Technique, Exp Tech (2018) 42: 473. https://doi.org/10.1007/s40799-018-0245-2 [4] D. Hunt, L. Uzielli, P. Mazzanti, Strains in gesso on painted wood panels during humidity changes and cupping, Journal of Cultural Heritage, 25 (2017) 163-169, https://doi.org/10.1016/j.culher.2016.11.002.
[5] B. Marcon, P. Mazzanti, L. Uzielli, L. Cocchi, D. Dureisseix, J Gril , Mechanical study of a support system for cupping control of panel paintings combining crossbars and springs, Journal of Cultural Heritage 13S (2012) S109–S117
[6] C. Castelli, G. Gualdani, L. Gusmeroli, P. Mazzanti, L. Riparbelli, A. Santacesaria, M. Togni, L. Uzielli, Il restauro del supporto ligneo della Natività attribuita a Cesare da Sesto. Messa a punto di un metodo per il dimensionamento e l’adeguamento elastico della traversatura originale. [Conservation of the wooden support of the Nativity panel attributed to Cesare da Sesto. Definition of a method for dimensioning and adjustment of the flexibility of the original crossbar system], OPD Restauro 30 (2018) 186-204
[7] C. Gauvin. Experimental and numerical study of the hygromechanical behaviour of a wooden panel. Theses, Université de Montpellier (2015) URL https://hal.archives-ouvertes. fr/tel-01285397.
[8] L. Uzielli, L. Cocchi, P. Mazzanti, M. Togni, D. Jullien, P. Dionisi Vici, The Deformometric, Kit: a method and an apparatus for monitoring the deformation of, wooden panels, Journal of Cultural Heritage Special issue on wood science and conservation, 13S (2012) S94–S101 (2012). [9] F. Brémand, M. Cottron , P. Doumalin, J.C. Dupré, A. Germaneau, V. Valle Mesures en mécanique par méthodes optiques, Techniques de l'ingénieur, 2. R1850, 2011.
[10] A. Germaneau, P. Doumalin, J.-C. Dupré, C. Brèque, F. Brémand, S. D’Houtaud, P. Rigoard, Experimental analysis of mechanical response of stabilized occipitocervical junction by 3D mark tracking technique, European Physical Journal, 14th International Conference on Experimental Mechanics, Poitiers (France), EPJ Web of Conferences 6, 21004 (2010)
[11] C. Gauvin, D. Jullien, P. Doumalin, J .C. Dupré, J. Gril. Image Correlation to Evaluate the Influence of Hygrothermal Loading on Wood. Strain, 50(5) (2014) 428–435 doi: 10.1111/str.12090. URL https://hal.archives-ouvertes.fr/hal-01286462.
[12] C. Gauvin, A. K, S. Beall, S. Ekelund, I. Breebaart, R. K. Gotink, J-C Dupré, F. Hesser, P. van Duin, P. Noble , Strain measurements during structural conservation treatment and the long-term monitoring of a 17th-century Dutch panel painting, ICOM-CC conference, Copenhagen 4-8 September 2017.
[13] J. Colmars, B. Marcon, E. Maurin, R. Rémond, F. Morestin, P. Mazzanti, J. Gril, Hygromechanical response of a panel painting in a church, monitoring and computer modeling. International conference on wooden cultural heritage, Evaluation of deterioration and management of change, Oct 2009, Germany (2009).
[14] D. Dureisseix, J. Colmars, A. Baldit, F. Morestin, H. Maigre. Follow-up of a panel restoration procedure through image correlation and finite element modeling. International Journal of Solids and Structures, Elsevier, 48 (2011) 1024-1033.
[15] J-J Orteu. 3-D computer vision in experimental mechanics. Optics and Lasers in Engineering, Elsevier, 47 (3-4, SI), (2009) 282-291.
[16] M. Morawitz, N. Hein, I. Alexeenko, M. Wilke, G. Pedrini, C. Krekel, W. Osten, Detection of transport and age induced damages on artwork: an advanced concept. Edited by: Pezzati, L;
Targowski, P, Conference on Optics for Arts, Architecture, and Archaeology IV , Munich, GERMANY, MAY 15-16, 2013, SPIE
[17] D. Buchta, N. Hein, G. Pedrini, C. Krekel, W. Osten, Artwork Inspection by Shearography with Adapted Loading, Experimental Mechanics 55 (2015) 1691–1704, DOI 10.1007/s11340-015-0070-9
[18] F. Brémand, P. Doumalin, J-C Dupré, F. Hesser, and V. Valle, “Relief analysis of the Mona Lisa’s wooden panel”, SEM Proceedings of the XIth International Congress and Exposition, June 2-5, 2008, Orlando, Florida
[19] J.P. Mohen, M. Menu, B. Mottin, Mona Lisa, inside the painting. Abrams, New York, United States (2006)
[20] I. Aicardi, F. Chiabrando, A. Maria Lingua, F. Noardo, Recent trends in cultural heritage 3D survey: The photogrammetric computer vision approach, Journal of Cultural Heritage, 32 (2018) 257-266
[21] N. Bretagne, V. Valle and J.-C. Dupré, Recent developments of the mark tracking technique: application to strain field and volume variation measurements, NDT & E
International 38/4 (2005) 290-298.
[22] M. Varnier, Comportement thermo-hygro-mécanique différé des feuillus - Des sciences du bois à l'ingénierie, Thèse de Doctorat de l'université de Limoges, 15-03-2019
[23] J. Gérard, D. Guibal, S. Paradis, M. Vernay, J. Beauchêne, L. Brancheriau, A. Thibaut, (2011). Tropix 7. CIRAD. https://doi.org/10.18167/74726F706978
![Figure 3 : a) Position of the 3 deformometric kits b) schematic representation from [8]](https://thumb-eu.123doks.com/thumbv2/123doknet/14594652.543011/7.892.221.729.138.426/figure-position-deformometric-kits-b-schematic-representation.webp)