HAL Id: hal-02071081
https://hal.umontpellier.fr/hal-02071081
Submitted on 11 Jun 2021
HAL is a multi-disciplinary open access
archive for the deposit and dissemination of
sci-entific research documents, whether they are
pub-lished or not. The documents may come from
teaching and research institutions in France or
abroad, or from public or private research centers.
L’archive ouverte pluridisciplinaire HAL, est
destinée au dépôt et à la diffusion de documents
scientifiques de niveau recherche, publiés ou non,
émanant des établissements d’enseignement et de
recherche français ou étrangers, des laboratoires
publics ou privés.
Distributed under a Creative Commons Attribution - NonCommercial - NoDerivatives| 4.0
International License
Transient immediate postoperative homotopic functional
disconnectivity in low-grade glioma patients
Arthur Coget, Jeremy Deverdun, Alain Bonafé, Liesjet Dokkum, Hugues
Duffau, François Molino, Emmanuelle Le Bars, Nicolas Menjot de Champfleur
To cite this version:
Arthur Coget, Jeremy Deverdun, Alain Bonafé, Liesjet Dokkum, Hugues Duffau, et al.. Transient
im-mediate postoperative homotopic functional disconnectivity in low-grade glioma patients.
Neuroimage-Clinical, Elsevier, 2018, 18, pp.656-662. �10.1016/j.nicl.2018.02.023�. �hal-02071081�
Contents lists available atScienceDirect
NeuroImage: Clinical
journal homepage:www.elsevier.com/locate/ynicl
Transient immediate postoperative homotopic functional disconnectivity in
low-grade glioma patients
Arthur Coget
a,b,c,⁎,1, Jérémy Deverdun
b,c,1, Alain Bonafé
a, Liesjet van Dokkum
c, Hugues Du
ffau
d,e,
François Molino
c,f, Emmanuelle Le Bars
a,b,c,2, Nicolas Menjot de Champ
fleur
a,b,c,g,2aDépartement de Neuroradiologie, Hôpital Gui de Chauliac, Centre Hospitalier Régional Universitaire de Montpellier, Montpellier, France
bInstitut d'Imagerie Fonctionnelle Humaine (I2FH), Hôpital Gui de Chauliac, Centre Hospitalier Régional Universitaire de Montpellier, Montpellier, France cLaboratoire Charles Coulomb, CNRS UMR 5221, Université de Montpellier, Montpellier, France
dDépartement de Neurochirurgie, Hôpital Gui de Chauliac, Centre Hospitalier Régional Universitaire de Montpellier, Montpellier, France eInstitut de Neurosciences de Montpellier, INSERM U1051, Hôpital Saint Eloi, Montpellier, France
fInstitut de Génomique Fonctionnelle, CNRS UMR 5203 - INSERM U66, Université de Montpellier, France gDépartement d'Imagerie Médicale, Centre Hospitalier Universitaire Caremeau, Nîmes, France
A R T I C L E I N F O
Keywords: Brain mapping Functional neuroimaging Glioma
Magnetic resonance imaging Neuronal plasticity Neurosurgery
A B S T R A C T
Background and purpose: The aim of this longitudinal study is to evaluate large-scale perioperative resting state networks reorganization in patients with diffuse low-grade gliomas following awake surgery.
Materials and methods: Eighty-two patients with diffuse low-grade gliomas were prospectively enrolled and underwent awake surgical resection. Resting-state functional images were acquired at three time points: pre-operative (MRI-1), immediate postpre-operative (MRI-2) and three months after surgery (MRI-3). We simultaneously performed perfusion-weighted imaging.
Results: Comparing functional connectivity between MRI-1 and MRI-2, we observed a statistically significant functional homotopy decrease in cortical and subcortical supratentorial structures (P < 0.05). A functional homotopy increase was observed between MRI-2 and MRI-3 in parietal lobes, cingulum and putamen (P < 0.05). No significant functional connectivity modification was noticed between MRI-1 and MRI-3. Regional cerebral blood flow appeared transiently reduced on MRI-2 (P < 0.05). No correlation between neurological deficit and interhemispheric connectivity results was found.
Conclusion/interpretation: We found a supratentorial widely distributed functional homotopy disruption between preoperative and immediate postoperative time points with a complete restitution three months after surgery with simultaneous variation of regional cerebral bloodflow.
1. Introduction
Diffuse low-grade gliomas (DLGG) are slow-growing infiltrating tumors. Patients often show normal clinical exam (Duffau, 2014), which is classically attributed to plastic changes in both anatomical and functional connectivity. However, exhaustive neuropsychological eva-luation has been able to highlight cognitive deficits that are probably related to white matter bundles infiltration (Duffau, 2013). Awake surgery with electrical stimulation has nowadays been recognized as the optimal treatment. It specifically allows for 1) optimal resection with 2) decreased postoperative deficit, and 3) improved overall
survival, delaying the anaplastic transformation of the tumor (Duffau,
2013). The improvements in functional outcome are associated with post-operative plasticity. In order to even further limit possible deficits after surgery it is important to improve our understanding of these plasticity effects.
Surprisingly, only few studies have addressed this issue in DLGG with structural and functional MRI (fMRI). This could be related to practical difficulties when dealing with patients in the postoperative condition. Immediately after surgery they are likely to present confu-sion or deficits that hinder cooperativity, which is required for classical task-oriented fMRI protocols. However, this can be circumvented by
https://doi.org/10.1016/j.nicl.2018.02.023
Received 25 August 2017; Received in revised form 21 February 2018; Accepted 23 February 2018
⁎Corresponding author at: Department of Neuroradiology, University Hospital Center, Gui de Chauliac Hospital, 80 Avenue Augustin Fliche, 34295 Montpellier Cedex 5, France. 1Arthur Coget and Jérémy Deverdun contributed equally to this work.
2Nicolas Menjot de Champfleur and Emmanuelle Le Bars contributed equally to this work.
E-mail address:arthur.coget@chu-montpellier.fr(A. Coget).
Abbreviations: DLGG, diffuse low-grade glioma; FA, fractional anisotropy; fMRI, functional MRI; rCBF, relative cerebral blood flow; RS, resting state; VMHC, voxel mirrored homotopic connectivity
Available online 26 February 2018
2213-1582/ © 2018 The Authors. Published by Elsevier Inc. This is an open access article under the CC BY-NC-ND license (http://creativecommons.org/licenses/BY-NC-ND/4.0/).
using task-free resting state (RS) fMRI that is based on the correlation in spontaneous blood-flow fluctuations between spatially separated brain regions. Several functional networks have thereby repetitively been identified (Barkhof et al., 2014;Damoiseaux et al., 2006) and plasticity of RS-fMRI networks has been successfully assessed in various clinical contexts (Bluhm et al., 2007;Greicius et al., 2004), including brain tumors (Briganti et al., 2012;Otten et al., 2012). Nevertheless, only two longitudinal RS-fMRI studies were identified (Boyer et al., 2016;Vassal et al., 2016).
Focusing on the immediate postoperative period, using Reho and ALFF analysis based on RS-fMRI, Boyer and colleagues highlighted a transient functional hypoactivity in the neocerebellum, which could partly explain the transient neurological deficits observed after surgery (Boyer et al., 2016). In addition, patients with DLGG located in the supplementary motor area showed immediate postoperative fluctua-tions of RS functional connectivity of the sensori-motor network (Vassal et al., 2016). Both studies thus underline the importance to evaluate RS connectivity immediately after surgery. Moreover, they hint at the re-levance of intrahemispheric and interhemispheric connectivities changes in relation to functional recovery.
Consequently, the current research aims at evaluating, in a long-itudinal manner, the large-scale perioperative resting-state networks plasticity following DLGG resection, with a specific interest in both intrahemispheric and interhemispheric connectivities.
2. Material and methods
2.1. Population
Eighty-two patients with DLGG were included in this study. They were selected from a large database in which DLGG patients are pro-spectively enrolled in a systematic manner when treated at our center. Inclusion criteria were: 1) awake surgical resection; 2) available his-topathology; 3) longitudinal fMRI follow-up on the same magnet at all time-points. Perioperative clinical data were collected. Broad neuro-logic deficits were classified as aphasia, sensorimotor or cognitive deficits. Note that all reported deficits were postoperative and transi-tory. All participants gave informed written consent before inclusion. The study was approved by the local ethical committee and is in agreement with the Declaration of Helsinki.
2.2. MRI acquisition
MRI acquisitions were performed successively before (MRI-1), within 36 h after (MRI-2) and three months post-surgery (MRI-3). All scans were executed on the same MRI magnet for each patient, i.e. ei-ther a 3.0 T magnet (Skyra, Siemens, Erlangen, Germany) or a 1.5 T magnet (Avanto, Siemens) with a 32-channel head coil. Conventional imaging included T1-weighted and axial FLAIR sequences. Afield map was acquired using a gradient echo-echo planar imaging (GE-EPI) se-quence (TE1/TE2 4.92/7.38 ms, TR 436 ms, voxel size 2.56 × 2.56 × 3 mm3,flip angle 60°, 39 slices).
RS-fMRI was performed using axial slice orientation (3.0 T magnet: 200 volumes, 39 slices, no interslice gap, voxel size 2.39 × 2.39 × 3 mm3, TR 2400 ms, TE 30 ms, flip angle 90°, BW
1875 Hz/pixel, PAT factor 2, acquisition time 8 min//1.5 T magnet: 200 volumes, 28 slices, no interslice gap, voxel size 3 × 3 × 5.5 mm3, TR 2400 ms, TE 50 ms,flip angle 90°, BW 2003 Hz/pixel, PAT factor 2, acquisition time 8 min). Participants were instructed to lay still with their eyes closed and to not concentrate or think of anything in parti-cular.
In addition, for the 3.0 T magnet only, we also performed a diffusion tensor imaging (30 directions, 55 slices, no interslice gap, voxel size 2.5 × 2.5 × 2.5 mm3, TR 6800 ms, TE 79 ms, b-value 0 and 1000 s/
mm2) and a perfusion-weighted imaging GE-EPI with contrast agent (45
volumes, 34 slices, no interslice gap, voxel size 1.77 × 1.77 × 4 mm3,
TR 1770 ms, TE 17 ms, acquisition time 1 min 30 s). A 0.2 mL/kg bolus of contrast agent was administered at 6 mL/s. The contrast agent used depended on the patient: either Gd-DOTA, gadoterate meglumine, Dotarem® (Guerbet, France) or Gd-BOPTA, gadobenate dimeglumine, MultiHance® (Bracco Imaging SpA, Milan, Italy).
2.3. Data analysis
The fMRI data analysis was carried out for all the eighty-two pa-tients. To start, we discarded thefirst five volumes of RS-fMRI to ensure both equilibration of the magneticfield and participants adaptation to the scanning environment. We then preprocessed the data, before ef-fectuating a functional connectivity analysis on two different levels: large scale regions of interest (ROI) and fine scaled voxel-to-voxel connectivity. The latter was added after the initial surprising results and allowed us to confirm our general findings. In addition, we confronted thesefindings with clinical characteristics, lesion characteristics, per-fusion variations, and structural connectivity of the corpus callosum. Analysis details are described in the following.
2.3.1. Preprocessing
The RS-fMRI acquisitions were preprocessed using SPM (SPM12;
http://www.fil.ion.ucl.ac.uk/spm/software) in MATLAB (R2014a; The Mathworks Inc.) following an 8-step method: 1) reorientation to the anterior commissure, 2) T1-segmentation (grey matter, white matter, cerebrospinalfluid), 3) slice timing, 4) unwrapping (field correction), 5) motion correction, 6) coregistration with T1-weigthed sequence, 7) normalization (based on T1), and 8) smoothing (FWHM 6 × 6 × 6 mm).
As resection cavities or tumors can lead to major artifacts after normalization, we applied a DARTEL approach without tumor masking, based on previous studies (Ripolles et al., 2012). Moreover, each nor-malized image was then verified to exclude inconsistent deformations. 2.3.2. Functional connectivity analysis
The large scale ROI-to-ROI connectivity analysis was performed using the CONN toolbox v16.a (https://www.nitrc.org/projects/conn) (Whitfield-Gabrieli and Nieto-Castanon, 2012), including a denoising with a band-passfilter [0.008; 0.09] and a linear detrending. A ROI-to-ROI multivariate regression approach was performed with CONN. Threshold was set to 0.05 with an analysis-level false discovery rate (FDR) correction at analysis level (one-sided). In this analysis, all kinds of functional connectivity have been considered (intrahemispheric, heterotopic and homotopic interhemispheric connectivities).
Focusing on interhemispheric connectivity, afine-grained voxel-to-voxel connectivity was evaluated by means of the voxel-to-voxel mirrored homotopic connectivity analysis (VMHC). It examines functional homotopy quantifying functional connectivity between a voxel an its mirrored counterpart in the controlateral hemisphere (Zuo et al., 2010). The preprocessed images were used for VMHC analysis on REST toolbox (http://restfmri.net/forum/index.php) (Song et al., 2011), including a [0.008; 0.09] band-passfilter.
Note that we tested both increased and decreased connectivities between MRI 1, MRI 2 and MRI 3, with CONN and VMHC analysis.
2.3.3. Tumors and resection cavities
Tumors and resection cavities at each time-point were manually defined by an experienced neuroradiologist using Mricron (http:// people.cas.sc.edu/rorden/mricron/) and their volumes were calcu-lated (Supplementary material 1). The obtained masks were spatially normalized to Montreal Neurological Institute (MNI) stereotactic space using the parameters derived from T1-normalization (Supplementary material 2).
2.3.4. Perfusion-weighted imaging
To verify whether results were related to perfusion variations, and
A. Coget et al. NeuroImage: Clinical 18 (2018) 656–662
more specifically to relative cerebral blood flow (rCBF) differences, we analysed the perfusion-weighted images (Mark et al., 2015;Marshall et al., 2015). Perfusion-weighted images were available for 59 out of 60 patients scanned on the 3.0 T magnet. rCBF maps were calculated for each patient on each of the 3 time-points using Olea sphere V3.0 SP3 with a block-circulant singular value decomposition (CSVD) deconvo-lution. Mean rCBF values were retrieved for the whole brain. A paired-t-test was used to compare different time points for rCBF values (P < 0.05).
2.3.5. Structural connectivity analysis
To relate results to possible structural connectivity changes, corpus callosum fibre integrity was analysed. Diffusion tensor images were available for 56 out of 60 participants on the 3.0 T, preprocessed with FSL 5.0.9 (http://fsl.fmrib.ox.ac.uk/fsl/fslwiki/) (Jenkinson et al., 2012) including, 1) brain extraction for T1 and diffusion tensor imaging data (Smith, 2002); 2) eddy current correction (Andersson and Sotiropoulos, 2016); 3) fractional anisotropy (FA) maps generation. For each scan, ROIs were manually designed on sagittal FA maps, deli-neating the corpus callosum and each of its subparts (body, genu, splenium) using Mricron software. Mean FA for these ROIs was ob-tained using in-house software implemented in MATLAB. In order to compare FA in the corpus callosum between MRI exams, a Wilcoxon rank-sum test was performed (P < 0.05).
3. Results
3.1. Population
A total of sixty participants were included on the 3.0 T magnet and twenty-two participants on the 1.5 T magnet (Table 1) (Supplementary material 1).
3.2. Main results: functional connectivity
First, we analysed the data separately for 3.0 T and 1.5 T data. However, results were comparable between groups. Therefore, we decided to perform the analysis for the entire group of eighty-two participants. Age, gender and MRI magnet were added as covariates.
3.2.1. Interhemispheric connectivity
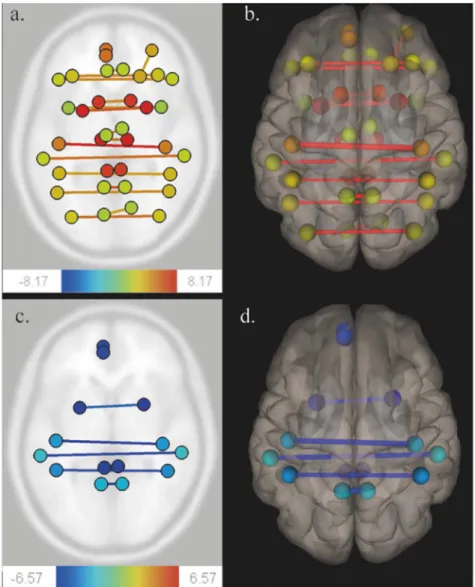
No statistically significant variation was observed in heterotopic functional connectivity for the ROI as analysed with CONN. However, a strong decrease in functional homotopy was found from MRI-1 to MRI-2 (Table 2,Fig. 1) and it increased again from MRI-2 to MRI-3 for the parietal lobes, cingulum and putamen (Table 3,Fig. 1). No significant
difference between MRI-1 and MRI-3 could be observed.
The drop in functional homotopy concerned the supratentorial cortex (frontal, parietal and occipital lobes, insula and cingulum and sub-cortical grey matter (thalamus, putamen, and caudate nucleus). This decrease was independent of the following parameters: time be-tween the surgery and the MRI-2 scan, time bebe-tween propofol with-drawal and MRI-2 scan, surgery duration, propofol dose, tumor volume, resection cavity volume, handedness, tumor location and affected hemisphere. In addition, when looking at a subgroup of participants with frontal tumors (N = 30), a similar widespread functional decrease in homotopy was observed. Unfortunately, we could not verify any other subgroups due to insufficient effectives.
3.2.2. Intrahemispheric connectivity
Besides the strong interhemispheric global decrease in functional connectivity at MRI-2, we observed some intrahemispheric changes within the frontal lobe. From MRI-1 to MRI-2 a significant functional connectivity decrease was found between the orbital portion of the right middle frontal gyrus and the dorsolateral part of the right frontal superior gyrus, as well as between the medial part of left superior
frontal gyrus and the left medial orbital part of the superior frontal gyrus. The latter functional connectivity increased again from MRI-2 to MRI-3, and no difference in intrahemispheric connectivity was ob-served between MRI-1 and MRI-3.
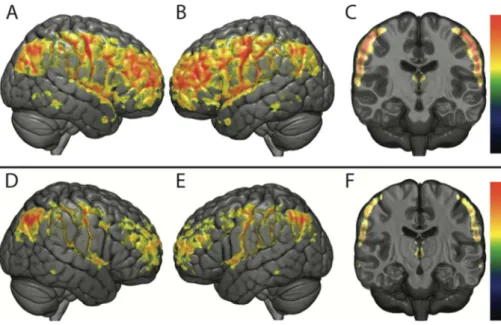
3.2.3. VMHC functional connectivity analysis
Surprised by the consistent decrease in functional connectivity be-tween homologous ROIs, we decided to confirm our findings with a second analysis: voxel-to-voxel based rather than comparing ROI. The VMHC analysis, interestingly, showed highly comparable results (Fig. 2). From MRI-1 to MRI-2 a significant decrease in functional homotopic connectivity was found (P < 0.05, FWE-corrected), for su-pratentorial cortex (frontal, parietal, occipital lobes, insula, temporal poles, cingulum), and to a lesser extent in subcortical grey matter (thalamus), and between the cerebellar hemispheres. From MRI-2 to MRI-3 this connectivity increased in the frontal and parietal lobes, as well as between the thalami, and no difference was observed between MRI-1 and MRI-3. These results were independent of the covariates age, gender and MRI magnet.
Table 1
Characteristics of the patients.
Characteristics of the patients Number Mean (SD) % All patients 82 3.0 T magnet 60 73.17% 1.5T magnet 22 26.83% Age 38.11 (8.71) Gender Male 40 48.78% Female 42 51.22% Handedness Right 67 81.71% Left 8 9.76% Ambidextrous 7 8.54% Tumor side Right hemisphere 29 35.37%
Left hemisphere 53 64.63% Location Frontal lobe 30 36.59% Frontoinsular 7 8.54% Temporal lobe 10 12.2% Temporoinsular 6 7.32% Insula 5 6.1% Frontotemporoinsular 19 23.17% Parietal 5 6.1%
Histopathologya Oligoastrocytoma, Grade II 66 80.49%
Oligoastrocytoma, Grade III 2 2.44% Oligodendroglioma, Grade II 7 8.54% Oligodendroglioma, Grade III 3 3.66% Diffuse low grade glioma (no
available histopathologic precision)
2 2.44%
Ganglioglioma, Grade I 2 2.44% Mean volumes (mm3)
MRI-1 Preoperative tumor 52.26 (40.23) MRI-2 Operative cavity 38.14
(23.67) Residual tumor 13.82
(15.44) MRI-3 Operative cavity 33.11
(23.36) Residual tumor 14.23 (15.92) Transient immediate postoperative deficits Aphasia 33 40.24% Sensorimotor deficit 11 13.41% Cognitive deficit 1 1.22% No deficit 40 48.78%
aHistopathology is based on the 2007 WHO Classification of Tumors of the Central
Nervous System (Louis et al., 2007). Patients were scanned successively before surgery (MRI-1), immediately after surgery, within 36 h following surgery (MRI-2), and three months after surgery (MRI-3).
3.3. Secondary results
Having confirmed the drop in interhemispheric connectivity be-tween homologous regions immediately after surgery by means of two different analyses, we then tried to relate this finding to various pro-cesses, including a transient neurological deficit at MRI-2, changes in perfusion and altered structural connectivity of the corpus callosum.
3.3.1. Clinical deficits
To verify whether the drop in functional connectivity between hemispheres could be related to a transient post-operative neurological deficit, we added deficit as an additional covariate to both CONN and VMHC analysis. Interestingly, no correlation between neurological deficit and interhemispheric connectivity results was found.
3.3.2. Perfusion-weighted imaging variations
It was subsequently hypothesized that the drop in functional homotopy could be related to perfusion variations, as the BOLD signal used in RS-fMRI is closely related to brain hemodynamics (Mark et al., 2015). We indeed observed a significant decrease in global rCBF (P = 0.021) from MRI-1 to MRI-2. From MRI-2 to MRI-3 the global rCBF did not reach significance, nor was there a significant difference between MRI-1 and MRI-3. However, when adding the variation in global rCBF as a covariate, no impact of global rCBF on functional connectivity could be observed.
3.3.3. Structural connectivity analysis
Apart from perfusion variations, changes in functional homotopy, could be also due to changes in structural connectivity. The corpus callosum is involved in interhemispheric structural connectivity be-tween homologous regions. We aimed at testing the hypothesis that a transient alteration of corpus callosum structural connectivity could
contribute to the decrease in functional homotopy observed at MRI-2. From MRI-1 to MRI-2first a decrease in FA for the splenium was ob-served (P < 0.05). From MRI-2 to MRI-3, the FA was also decreased for the body (P < 0.01) and genu (P < 0.01), leading to a significant decrease in FA for the whole corpus callosum (P < 0.01) and each of its subparts (genu P < 0.01; body P < 0.01; splenium P = 0.02) when comparing MRI-1 to MRI-3.
We then tried tofind a relation between longitudinal changes in FA and functional connectivity. Differences in mean FA values of the corpus callosum and its subparts were calculated from MRI 1to MRI 2, from MRI 2 to MRI 3 and from MRI 1 to MRI 3. These differences were used as covariates in the functional connectivity analysis with CONN toolbox and VMHC. Again no impact could be found between the FA of the corpus callosum and the functional connectivity.
4. Discussion
The principal aim of this study was to evaluate perioperative large-scale RS network reorganization in patients with DLGG in a long-itudinal manner. We were specifically interested in both intrahemi-spheric and interhemiintrahemi-spheric connectivities. Previous research by our group hinted at their relevance in relation to functional recovery (Boyer et al., 2016;Vassal et al., 2016). We found 1) a transient disruption of the functional interhemispheric connectivity immediately after surgery, 2) especially between homologous regions, 3) consistently over the supratentorial cortex as well as within subcortical grey matter, that was 4) unrelated to clinical deficits or other covariates. Three months after surgery, functional connectivity returned to pre-surgical levels.
The functional homotopy disruption in the immediate postoperative period was confirmed using two different methods. Functional homo-topy relates to“the high degree of synchrony in spontaneous activity be-tween geometrically corresponding interhemispheric regions” (Zuo et al.,
Table 2
Connectivity analysis with CONN toolbox comparing MRI-1 and MRI-2.
ROI MNI coordinates ROI MNI coordinates T P value
Angular_L (−44; −61; 36) – Angular_R (46;−60; 39) 4.57 < 0.01 Angular_R (46;−60; 39) – Angular_L (−44; −61; 36) 3.96 0.04 Calcarine_R (16;−73; 9) – Calcarine_L (−7; −79; 6) 4.02 0.03 Caudate_L (−11; 11; 9) – Caudate_R (15; 12; 9) 4.59 0.01 Caudate_R (15; 12; 9) – Caudate_L (−11; 11; 9) 5.03 < 0.01 Cingulum_Ant_L (−4; 35; 14) – Cingulum_Ant_R (8; 37;16) 4.19 0.02 Cingulum_Ant_R (8; 37;16) – Cingulum_Ant_L (−4; 35; 14) 4.04 0.03 Cingulum_Mid_L (−5; −15; 42) – Cingulum_Mid_R (8;−9; 40) 4.60 0.01 Cingulum_Mid_R (8;−9; 40) – Cingulum_Mid_L (−5; −15; 42) 4.60 0.01 Cingulum_Post_L (−5; −43; 25) – Cingulum_Post_R (7;−42; 22) 5.90 < 0.01 Cingulum_Post_R (7;−42; 22) – Cingulum_Post_L (−5; −43; 25) 5.69 < 0.01 Frontal_Inf_Tri_L (−46; 30; 14) – Frontal_Inf_Tri_R (50; 30; 14) 4.69 0.01 Frontal_Inf_Tri_R (50; 30; 14) – Frontal_Inf_Tri_L (−46; 30; 14) 3.84 < 0.05 Frontal_Mid_L (−33; 33; 35) – Frontal_Mid_R (38; 33; 34) 4.65 0.01 Frontal_Mid_R (38; 33; 34) – Frontal_Mid_L (−33; 33; 35) 4.62 0.01 Frontal_Mid_Orb_R (33; 53;−11) – Frontal_Sup_R (22; 31; 44) 3.98 0.03 Frontal_Sup_R (22; 31; 44) – Frontal_Mid_Orb_R (33; 53;−11) 4.00 0.03 Frontal_Sup_Medial_L (−5; 49; 31) – Frontal_Med_Orb_L (−5; 54; −7) 4.11 0.03 Insula_L (−35; 7; 3) – Insula_R (39; 6; 2) 4.33 0.01 Insula_R (39; 6; 2) – Insula_L (−35; 7; 3) 4.41 0.01 Occipital_Mid_R (37;−80; 19) – Occipital_Mid_L (−32; −81; 16) 5.76 < 0.01 Parietal_Inf_R (46;−46; 50) – Parietal_Inf_L (−43; 46; 47) 3.89 0.04 Postcentral_L (−42; −23; 49) – Postcentral_R (41;−25; 53) 8.17 < 0.01 Postcentral_R (41;−25; 53) – Postcentral_L (−42; −23; 49) 7.00 < 0.01 Precuneus_L (−7; −56; 48) – Precuneus_R (10;−56; 44) 5.87 < 0.01 Precuneus_R (10;−56; 44) – Precuneus_L (−7; −56; 48) 5.34 < 0.01 Putamen_L (−24; 4; 2) – Putamen_R (28; 5; 2) 6.01 < 0.01 Putamen_R (28; 5; 2) – Putamen_L (−24; 4; 2) 6.00 < 0.01 SupraMarginal_L (−56; − 34; 30) – SupraMarginal_R (58;−32; 34) 5.27 < 0.01 SupraMarginal_R (58;−32; 34) – SupraMarginal_L (−56; − 34; 30) 4.23 0.02 Thalamus_L (−11; −18; 8) – Thalamus_R (13;−18; 8) 5.30 < 0.01 Thalamus_R (13;−18; 8) – Thalamus_L (−11; −18; 8) 5.48 < 0.01 Patients were scanned successively before surgery (MRI-1) and immediately after surgery, within 36 h following surgery (MRI-2). All reported P values are found significant with an analysis-level FDR correction for the hypothesis of adecrease in functional connectivity from MRI-1 to MRI-2. Names of the ROIs refer to the AAL atlas. Abbreviations: L: left; R: right.
A. Coget et al. NeuroImage: Clinical 18 (2018) 656–662
2010). It can vary over regions and over lifespan (Stark et al., 2008;Zuo et al., 2010). Minor discrepancies in results between both methods were noticed that could partly be explained by differences in calculations.
Where the CONN analysis was based on mean average connectivity values for pre-defined ROIs, did VMHC focus on the connectivity be-tween individual voxels.
Fig. 1. Functional connectivity variations using CONN toolbox.
Patients were scanned successively before surgery (MRI-1), immediately after surgery, within 36 h following surgery (MRI-2), and three months after surgery (MRI-3). A ROI-to-ROI multivariate regression approach was performed on CONN (threshold 0.05, analysis-level FDR correction).
Comparison of MRI-1 and MRI-2 (Fig. A, axial section) (Fig. B, 3D superior view) show a functional homotopy decrease (yellow to red lines). Comparison of MRI-2 and MRI-3 (Fig. C, axial section) (Fig. D, 3D superior view) show a functional homotopy increase (blue lines).
Table 3
Connectivity analysis with CONN toolbox comparing MRI-2 and MRI-3.
ROI MNI coordinates ROI MNI coordinates T P value
Cingulum_Post_L (−5; −43; 25) – Cingulum_Post_R (7;−42; 22) −4.87 < 0.01 Cingulum_Post_R (7;−42; 22) – Cingulum_Post_L (−5; −43; 25) −4.91 < 0.01 Frontal_Sup_Medial_L (−5; 49; 31) – Frontal_Med_Orb_L (−5; 54; −7) −5.35 < 0.01 Parietal_Inf_L (−43; 46; 47) – Parietal_Inf_R (46;−46; 50) −4.93 < 0.01 Parietal_Inf_R (46;−46; 50) – Parietal_Inf_L (−43; 46; 47) −4.57 0.01 Postcentral_L (−42; −23; 49) – Postcentral_R (41;−25; 53) −5.84 < 0.01 Postcentral_R (41;−25; 53) – Postcentral_L (−42; −23; 49) −4.97 < 0.01 Precuneus_L (−7; −56; 48) – Precuneus_R (10;−56; 44) −6.57 < 0.01 Precuneus_R (10;−56; 44) – Precuneus_L (−7; −56; 48) −6.52 < 0.01 Putamen_L (−24; 4; 2) – Putamen_R (28; 5; 2) −4.18 0.04 Putamen_R (28; 5; 2) – Putamen_L (−24; 4; 2) −4.44 0.02 SupraMarginal_L (−56; − 34; 30) – SupraMarginal_R (58;−32; 34) −5.36 < 0.01 SupraMarginal_R (58;−32; 34) – SupraMarginal_L (−56; − 34; 30) −4.30 0.03 Patients were scanned successively immediately after surgery, within 36 h following surgery (MRI-2), and three months after surgery (MRI-3). All reported P values are found significant with an analysis-level FDR correction for the hypothesis of anincrease in functional connectivity from MRI-2 to MRI-3. Names of the ROIs refer to the AAL atlas. Abbreviations: L: left; R: right.
Considering the frontal lobe, we also observed intrahemispheric changes in functional connectivity. Ourfirst hypothesis was that might be related to local network reorganizations following the resection of frontal DLGG. However, we were unable to confirm this hypothesis, as we did notfind any intrahemispheric changes when only focusing on the frontal DLGG subgroup. This might simply be related to the relative smaller sample size (30 participants) of the subgroup, but alternatively, this might also indicate that local frontal intrahemispheric changes in connectivity are part of global functional network variations in-dependently of tumor location.
RS-fMRI is based on the analysis of BOLD variations, and is there-fore strongly influenced by regional perfusion parameters, in particular the rCBF (Mark et al., 2015). Looking at the changes in rCBF over time, we found the same pattern as in RS functional connectivity: a strong decrease in the immediate postoperative period, with a complete res-titution at three months.Marshall et al. (2015)observed, using VMHC, that hypercapnia induces a global decrease of functional homotopy which could be linked to CBF changes. Therefore, one can argue that the functional homotopic disconnectivity results from the underlying change in rCBF. However, we could not confirm a direct relation be-tween homotopy and brain hemodynamics. In the following we will therefore explore whether the functional homotopic disconnectivity and the perfusion changes could be related to a third common factor.
First, MRI susceptibility artifacts had to be excluded. If this would have been a factor, we should have observed enhanced effects for the 3.0 T magnet. However, results were comparable between magnets and adding magnet as a covariate to the connectivity analysis did not alter results.
Second, the anesthetic procedure could have influenced the results. Animal studies have shown that anesthetic agents are able to break-down interhemispheric connectivity (Hutchison et al., 2014;Jonckers et al., 2014). We used intravenous propofol, a widely used agent that reduces cerebral blood flow and intracranial pressure (Sebel and Lowdon, 1989). In human subjects, it has been suggested to affect thalamocortical and brainstem connectivity (Gili et al., 2013;
Guldenmund et al., 2013;Song and Yu, 2015). Propofol has an elim-ination half-life ranging from 13.1 to 44.7 h (Morgan et al., 1990). The scan in the immediate postoperative period was acquired within this time-delay. However, neither dose of propofol, nor time-delay between propofol withdrawal and the MRI scan influenced results. Also, one might wonder why propofol would only influence homotopic functional connectivity. Thus, although this study cannot confirm the impact of propofol, more in depth research is required to clarify its relation to
observed changes in functional connectivity immediately after surgery. Third, interhemispheric connectivity changes have been frequently observed in diseases involving modifications of the corpus callosum (Lowe et al., 2002;Quigley et al., 2003). Large portions of corpus cal-losum fibers directly connect homotopic regions (Innocenti, 1986;
Jarbo et al., 2012). Stability of functional homotopy across conditions and time might be due to these direct anatomical projections (Shen et al., 2015) confirmed by diffusion tensor imaging, electrophysiology and cytologic studies (Caminiti et al., 2013;Caminiti et al., 2009). In-terestingly, wefirst observed a decrease in fibre integrity within the splenium of the corpus callosum in the immediate post-operative period. After 3 months, the homotopic functional connectivity returned to preoperative levels, whereas the global fibre integrity elicited a progressive decrease in the corpus callosum. Thus it can be concluded, that tumor resection has a long-term impact on fibre connectivity within the corpus callosum. However, it cannot explain the widespread homotopic functional disconnection in the postoperative period as the splenium is only impaired at this time and as it only refers to parietal, temporal and visual white matter pathways (Hofer and Frahm, 2006). One could hypothesize the existence of a subcortical relay, whose alteration could mediate this decrease in functional homotopy, as suggested by lesional studies (Salvador et al., 2005;Uddin et al., 2008). Recent anatomical works observed ventro-striatal heterotopic fibers support this latter hypothesis (De Benedictis et al., 2016).
A hypothesis that might merit further exploration is whether the changes in functional homotopic connectivity are related to plasticity processes that are initiated by the decreasedfibre integrity in the corpus callosum after surgery. The reorganization of homotopic connectivity might be completed within 3 months after surgery, leading to restored homotopic connectivity.
Finally, we did notfind a relation between immediate postoperative deficits and functional connectivity disruption. However only broad clinical deficits were collected. Further works might be needed, to correlate perioperative functional connectivity and subtle neurocogni-tive impairments.
5. Conclusion
In the immediate postoperative period, widespread supratentorial functional homotopic disconnectivity was found with a simultaneous, but seemingly unrelated, decrease in brain hemodynamics. Three months after surgery, both connectivity and brain hemodynamics were completely restored to pre-surgical levels. In contrast, a progressive
Fig. 2. Functional connectivity analysis using VMHC. Analysis using VMHC comparing MRI-1, MRI-2 and MRI-3 (P < 0.05; FWE-corrected).
The upper rowfigures the comparison between MRI-1 and MRI-2 (Fig. A: right lateral view; Fig. B: left lateral view; Fig. C: coronal section). A significant functional homotopic connectivity decrease is seen in supratentorial cortical re-gions and thalami.
The lower rowfigures the comparison between MRI-2 and MRI-3 (Fig. D: right lateral view; Fig. E: left lateral view; Fig. F: coronal section). A significant functional homotopic connectivity increase is seen in frontal and parietal lobes and thalami.
A. Coget et al. NeuroImage: Clinical 18 (2018) 656–662
decrease infibre integrity of the corpus callosum was observed, starting in the splenium and extending to the complete corpus callosum at three months. This might hint towards extensive long-term and wide-range network plasticity, that allows for normal connectivity patterns and limited postoperative clinical deficits, despite important anatomical changes. However, more research is needed to understand these results and their implications concerning the usefulness and postprocessing of RS data acquired in the immediate post-operative condition.
Conflict of interest
Authors have no conflict of interest to declare. Acknowledgments
This research was supported by a grant provided by the Société Française de Radiologie - French Society of Radiology - (SFR) together with the Collège des Enseignants de Radiologie de France - French Academic College of Radiology (CERF) and by NUMEV (AN-10-LABX-20).
We would like to thank Siemens Healthineers (Siemens Healthineers, Erlangen, Germany) for the quality of our scientific col-laboration.
Appendix A. Supplementary data
Supplementary data to this article can be found online athttps:// doi.org/10.1016/j.nicl.2018.02.023.
References
Andersson, J.L.R., Sotiropoulos, S.N., 2016. An integrated approach to correction for off-resonance effects and subject movement in diffusion MR imaging. NeuroImage 125, 1063–1078.
Barkhof, F., Haller, S., Rombouts, S.A.R.B., 2014. Resting-state functional MR imaging: a new window to the brain. Radiology 272, 29–49.
Bluhm, R.L., Miller, J., Lanius, R.A., Osuch, E.A., Boksman, K., Neufeld, R.W.J., Théberge, J., Schaefer, B., Williamson, P., 2007. Spontaneous low-frequencyfluctuations in the BOLD signal in schizophrenic patients: anomalies in the default network. Schizophr. Bull. 33, 1004–1012.
Boyer, A., Deverdun, J., Duffau, H., Le Bars, E., Molino, F., Menjot de Champfleur, N., Bonnetblanc, F., 2016. Longitudinal changes in cerebellar and thalamic spontaneous neuronal activity after wide-awake surgery of brain tumors: a resting-state fMRI study. Cerebellum (London, England) 15, 451–465.
Briganti, C., Sestieri, C., Mattei, P.A., Esposito, R., Galzio, R.J., Tartaro, A., Romani, G.L., Caulo, M., 2012. Reorganization of functional connectivity of the language network in patients with brain gliomas. Am. J. Neuroradiol. 33, 1983–1990.
Caminiti, R., Ghaziri, H., Galuske, R., Hof, P.R., Innocenti, G.M., 2009. Evolution am-plified processing with temporally dispersed slow neuronal connectivity in primates. Proc. Natl. Acad. Sci. U. S. A. 106, 19551–19556.
Caminiti, R., Carducci, F., Piervincenzi, C., Battaglia-Mayer, A., Confalone, G., Visco-Comandini, F., Pantano, P., Innocenti, G.M., 2013. Diameter, length, speed, and conduction delay of callosal axons in macaque monkeys and humans: comparing data from histology and magnetic resonance imaging diffusion tractography. J. Neurosci. Off. J. Soc. Neurosci. 33, 14501–14511.
Damoiseaux, J.S., Rombouts, S.A.R.B., Barkhof, F., Scheltens, P., Stam, C.J., Smith, S.M., Beckmann, C.F., 2006. Consistent resting-state networks across healthy subjects. Proc. Natl. Acad. Sci. U. S. A. 103, 13848–13853.
De Benedictis, A., Petit, L., Descoteaux, M., Marras, C.E., Barbareschi, M., Corsini, F., Dallabona, M., Chioffi, F., Sarubbo, S., 2016. New insights in the homotopic and heterotopic connectivity of the frontal portion of the human corpus callosum re-vealed by microdissection and diffusion tractography. Hum. Brain Mapp. 37, 4718–4735.
Duffau, H., 2013. A new philosophy in surgery for diffuse low-grade glioma (DLGG): oncological and functional outcomes. Neurochirurgie 59, 2–8.
Duffau, H., 2014. Diffuse low-grade gliomas and neuroplasticity. Diagn. Interv. Imaging 95, 945–955.
Gili, T., Saxena, N., Diukova, A., Murphy, K., Hall, J.E., Wise, R.G., 2013. The thalamus and brainstem act as key hubs in alterations of human brain network connectivity induced by mild propofol sedation. J. Neurosci. Off. J. Soc. Neurosci. 33, 4024–4031.
Greicius, M.D., Srivastava, G., Reiss, A.L., Menon, V., 2004. Default-mode network ac-tivity distinguishes Alzheimer's disease from healthy aging: evidence from functional
MRI. Proc. Natl. Acad. Sci. U. S. A. 101, 4637–4642.
Guldenmund, P., Demertzi, A., Boveroux, P., Boly, M., Vanhaudenhuyse, A., Bruno, M.-A., Gosseries, O., Noirhomme, Q., Brichant, J.-F., Bonhomme, V., Laureys, S., Soddu, A., 2013. Thalamus, Brainstem and Salience Network Connectivity Changes During Propofol-Induced Sedation and Unconsciousness. Brain Connectivity 3, 273–285.
Hofer, S., Frahm, J., 2006. Topography of the human corpus callosum
re-visited—comprehensive fiber tractography using diffusion tensor magnetic resonance imaging. NeuroImage 32, 989–994.
Hutchison, R.M., Hutchison, M., Manning, K.Y., Menon, R.S., Everling, S., 2014. Isoflurane induces dose-dependent alterations in the cortical connectivity profiles and dynamic properties of the brain's functional architecture. Hum. Brain Mapp. 35, 5754–5775.
Innocenti, G.M., 1986. General organization of callosal connections in the cerebral cortex. Cereb. Cortex 291–353.
Jarbo, K., Verstynen, T., Schneider, W., 2012. In vivo quantification of global connectivity in the human corpus callosum. NeuroImage 59, 1988–1996.
Jenkinson, M., Beckmann, C.F., Behrens, T.E.J., Woolrich, M.W., Smith, S.M., 2012. FSL. NeuroImage 62, 782–790.
Jonckers, E., Delgado y Palacios, R., Shah, D., Guglielmetti, C., Verhoye, M., Van der Linden, A., 2014. Different anesthesia regimes modulate the functional connectivity outcome in mice. Magn. Reson. Med. 72, 1103–1112.
Louis, D.N., Ohgaki, H., Wiestler, O.D., Cavenee, W.K., Burger, P.C., Jouvet, A., Scheithauer, B.W., Kleihues, P., 2007. The 2007 WHO classification of tumours of the central nervous system. Acta Neuropathol. 114, 97–109.
Lowe, M.J., Phillips, M.D., Lurito, J.T., Mattson, D., Dzemidzic, M., Mathews, V.P., 2002. Multiple sclerosis: low-frequency temporal blood oxygen level-dependent fluctua-tions indicate reduced functional connectivity initial results. Radiology 224, 184–192.
Mark, C.I., Mazerolle, E.L., Chen, J.J., 2015. Metabolic and vascular origins of the BOLD effect: implications for imaging pathology and resting-state brain function. J. Magn. Reson. Imaging JMRI 42, 231–246.
Marshall, O., Uh, J., Lurie, D., Lu, H., Milham, M.P., Ge, Y., 2015. The influence of mild carbon dioxide on brain functional homotopy using resting-state fMRI. Hum. Brain Mapp. 36, 3912–3921.
Morgan, D.J., Campbell, G.A., Crankshaw, D.P., 1990. Pharmacokinetics of propofol when given by intravenous infusion. Br. J. Clin. Pharmacol. 30, 144–148.
Otten, M.L., Mikell, C.B., Youngerman, B.E., Liston, C., Sisti, M.B., Bruce, J.N., Small, S.A., McKhann, G.M., 2012. Motor deficits correlate with resting state motor network connectivity in patients with brain tumours. Brain J. Neurol. 135, 1017–1026.
Quigley, M., Cordes, D., Turski, P., Moritz, C., Haughton, V., Seth, R., Meyerand, M.E., 2003. Role of the corpus callosum in functional connectivity. AJNR Am. J. Neuroradiol. 24, 208–212.
Ripolles, P., Marco-Pallarés, J., de Diego-Balaguer, R., Miro, J., Falip, M., Juncadella, M., Rubio, F., Rodriguez-Fornells, A., 2012. Analysis of automated methods for spatial normalization of lesioned brains. NeuroImage 60, 1296–1306.
Salvador, R., Suckling, J., Coleman, M.R., Pickard, J.D., Menon, D., Bullmore, E., 2005. Neurophysiological architecture of functional magnetic resonance images of human brain. Cereb. Cortex 15, 1332–1342 (New York, N.Y.: 1991).
Sebel, P.S., Lowdon, J.D., 1989. Propofol: a new intravenous anesthetic. J. Am. Soc. Anesthesiologists 71, 260–277.
Shen, K., Mišić, B., Cipollini, B.N., Bezgin, G., Buschkuehl, M., Hutchison, R.M., Jaeggi, S.M., Kross, E., Peltier, S.J., Everling, S., Jonides, J., McIntosh, A.R., Berman, M.G., 2015. Stable long-range interhemispheric coordination is supported by direct ana-tomical projections. Proc. Natl. Acad. Sci. U. S. A. 112, 6473–6478.
Smith, S.M., 2002. Fast robust automated brain extraction. Hum. Brain Mapp. 17, 143–155.
Song, X.-x., Yu, B.-w., 2015. Anesthetic effects of propofol in the healthy human brain: functional imaging evidence. J. Anesth. 29, 279–288.
Song, X.-W., Dong, Z.-Y., Long, X.-Y., Li, S.-F., Zuo, X.-N., Zhu, C.-Z., He, Y., Yan, C.-G., Zang, Y.-F., 2011. REST: a toolkit for resting-state functional magnetic resonance imaging data processing. PLoS ONE 6, e25031.
Stark, D.E., Margulies, D.S., Shehzad, Z.E., Reiss, P., Kelly, A.M.C., Uddin, L.Q., Gee, D.G., Roy, A.K., Banich, M.T., Castellanos, F.X., Milham, M.P., 2008. Regional variation in interhemispheric coordination of intrinsic hemodynamicfluctuations. J. Neurosci. Off. J. Soc. Neurosci. 28, 13754–13764.
Uddin, L.Q., Mooshagian, E., Zaidel, E., Scheres, A., Margulies, D.S., Kelly, A.M.C., Shehzad, Z., Adelstein, J.S., Castellanos, F.X., Biswal, B.B., Milham, M.P., 2008. Residual functional connectivity in the split-brain revealed with resting-state func-tional MRI. Neuroreport 19, 703–709.
Vassal, M., Charroud, C., Deverdun, J., Le Bars, E., Molino, F., Bonnetblanc, F., Boyer, A., Dutta, A., Herbet, G., Moritz-Gasser, S., Bonafé, A., Duffau, H., de Champfleur, N.M., 2016. Recovery of functional connectivity of the sensorimotor network after surgery for diffuse low-grade gliomas involving the supplementary motor area. J. Neurosurg. 1–10.
Whitfield-Gabrieli, S., Nieto-Castanon, A., 2012. Conn: a functional connectivity toolbox for correlated and anticorrelated brain networks. Brain Connectivity 2, 125–141.
Zuo, X.-N., Kelly, C., Di Martino, A., Mennes, M., Margulies, D.S., Bangaru, S., Grzadzinski, R., Evans, A.C., Zang, Y.-F., Castellanos, F.X., Milham, M.P., 2010. Growing together and growing apart: regional and sex differences in the lifespan developmental trajectories of functional homotopy. J. Neurosci. Off. J. Soc. Neurosci. 30, 15034–15043.