HAL Id: inserm-00688142
https://www.hal.inserm.fr/inserm-00688142
Submitted on 16 Apr 2012
HAL is a multi-disciplinary open access archive for the deposit and dissemination of sci-entific research documents, whether they are pub-lished or not. The documents may come from teaching and research institutions in France or abroad, or from public or private research centers.
L’archive ouverte pluridisciplinaire HAL, est destinée au dépôt et à la diffusion de documents scientifiques de niveau recherche, publiés ou non, émanant des établissements d’enseignement et de recherche français ou étrangers, des laboratoires publics ou privés.
Network- and attribute-based classifiers can prioritize
genes and pathways for autism spectrum disorders and
intellectual disability.
Yan Kou, Catalina Betancur, Huilei Xu, Joseph Buxbaum, Avi Ma’Ayan
To cite this version:
Yan Kou, Catalina Betancur, Huilei Xu, Joseph Buxbaum, Avi Ma’Ayan. Network- and attribute-based classifiers can prioritize genes and pathways for autism spectrum disorders and intellectual disability.. American Journal of Medical Genetics Part C: Seminars in Medical Genetics, Wiley, 2012, 160C (2), pp.130-42. �10.1002/ajmg.c.31330�. �inserm-00688142�
Network‐ and Attribute‐Based Classifiers can Prioritize Genes and Pathways for Autism Spectrum Disorders and Intellectual Disability Yan Kou*, Catalina Betancur*, Huilei Xu*, Joseph D Buxbaum, and Avi Ma’ayan *YK, CB, and HX contributed equally to this study. Author profiles: Yan Kou, M.Sc., is a graduate student at Mount Sinai School of Medicine, New York, working under the supervision of Drs. Ma’ayan and Buxbaum. She is interested in developing and applying systems biological methods to complex human disorders. Yan Kou is a Seaver Graduate Fellow.
Catalina Betancur, M.D., Ph.D., is director of research at the INSERM U952, CNRS UMR 7224, Université Pierre et Marie Curie, in Paris, France. Her work is focused on the elucidation of the genetic bases of autism spectrum disorders.
Huilei Xu, B.Sc., is a graduate student at Mount Sinai School of Medicine, New York, working under the supervision of Drs. Ma’ayan and Ihor Lemischka. Huilei Xu is interested in developing and applying data mining methods in computational systems biology with the focus on understanding embryonic stem cell pluripotency and early differentiation.
Joseph D Buxbaum, M.Sc., Ph.D., is a Professor in the Departments of Psychiatry, Neuroscience, and Genetics and Genomic Sciences, at the Mount Sinai School of Medicine in New York. His interests are in understanding the causes of, and developing targeted treatment for, neuropsychiatric disorders. Dr. Buxbaum is the Director of the Seaver Autism Center for Research and Treatment as well as Chief for the Center of Excellence in Neurodevelopmental Disorders of the Friedman Brain Institute, both at Mount Sinai.
Avi Ma’ayan, M.Sc., Ph.D., is an Assistant professor in the Department of Pharmacology and Systems Therapeutics. His interests are in applying graph theory, machine learning and dimensionality reduction methods for integrating omics datasets collected from mammalian sources to better understand biological regulation on a global scale. Dr. Ma’ayan is the Director of the Bioinformatics and Network Analysis Core of the Systems Biology Center New York.
Running title: Prioritizing genes in autism and related disorders
Correspondence to: Joseph D Buxbaum, Department of Psychiatry, Mount Sinai School of Medicine, One Gustave L Levy Place, Box 1668, New York, NY 10029, E‐mail: [email protected], and Avi Ma’ayan, Department of Pharmacology and Systems Therapeutics, Mount Sinai School of Medicine, One Gustave L Levy Place, New York, NY 10029, E‐mail: [email protected]
Abstract
Autism spectrum disorders (ASD) are a group of related neurodevelopmental disorders with significant combined prevalence (~1%) and high heritability. Dozens of individually rare genes and loci associated with high‐risk for ASD have been identified, which overlap extensively with genes for intellectual disability (ID). However, studies indicate that there may be hundreds of genes that remain to be identified. The advent of inexpensive massively parallel nucleotide sequencing can reveal the genetic underpinnings of heritable complex diseases, including ASD and ID. However, whole exome sequencing (WES) and whole genome sequencing (WGS) provides an embarrassment of riches, where many candidate variants emerge. It has been argued that genetic variation for ASD and ID will cluster in genes involved in distinct pathways and protein complexes. For this reason, computational methods that prioritize candidate genes based on additional functional information such as protein‐protein interactions or association with specific canonical or empirical pathways, or other attributes, can be useful. In this study we applied several supervised learning approaches to prioritize ASD or ID disease gene candidates based on curated lists of known ASD and ID disease genes. We implemented two network‐based classifiers and one attribute‐based classifier to show that we can rank and classify known, and predict new, genes for these neurodevelopmental disorders. We also show that ID and ASD share common pathways that perturb an overlapping synaptic regulatory subnetwork. We also show that features relating to neuronal phenotypes in mouse knockouts can help in classifying neurodevelopmental genes. Our methods can be applied broadly to other diseases helping in prioritizing newly identified genetic variation that emerge from disease gene discovery based on WES and WGS.
Keywords
High‐throughput sequencing, massively parallel sequencing, gene discovery, networks, pathways, neurodevelopmental disorders, classifiers, support vector machine Introduction ASD and ID are complex, multifactorial neurodevelopmental disorders with high heritability, which share overlapping risk factors (Betancur 2011; El‐Fishawy and State 2009; Topper et al. 2011). Great progress has been made in the past years in identifying rare variants of major effect in both ASD and ID (Betancur 2011; Topper et al. 2011). However, the genetic underpinning of these disorders remains mostly unknown. For example, a specific genetic etiology can currently be identified in ~20% of patients with ASD. Similarly, although dozens of high‐risk ASD genes and loci have been identified (Betancur 2011), estimates from ongoing studies estimate that 60‐80% of ASD and ID genes and loci remain to be discovered (see Sanders et al. 2011 and Topper et al. 2011). The recent advances in massively parallel DNA sequencing bring the promise that genetic variation identified in individuals affected with a neurodevelopmental disorder would add to our understanding of the etiology of these disorders. However, as sequencing data is accumulating, vast amounts of genetic variations are being discovered. This presents the challenge of deciding which variation lead to the phenotype and which are coincidental. To address this challenge, it is useful to have computational approaches that place gene products harboring known variation within networks and then placing newly identified variation in the same context. For example, Gilman et al. (2011) developed a weighted functional background network, which when seeded with genes found within CNVs associated with high risk for ASD yielded a subnetwork enriched with neuronal motility, synaptic development and axonal guidance gene products. Their resultant subnetwork was also enriched in genes previously associated with ID phenotypes.
Similarly, Voineagu et al. (2011) developed a gene co‐expression subnetwork made from ASD and normal brain samples to find a differentially expressed subnetwork made of genes enriched in neuronal and immune functions as well as glial markers. In another study, Ziats and Rennert tracked the expression levels of ASD associated genes during development using published microarrays. They showed that co‐ expressed subnetworks seeded with ASD genes form modules that are enriched in genes known to play a role in immunity (Ziats and Rennert 2011). The ability of such approaches to discover new mechanisms in ASD suggests that functional molecular interactomes may be useful for linking the complex human phenotypes of ASD and ID to variation in genes (Gilman et al. 2011).
Many computational approaches have been developed to generate background networks for the purpose of constructing functional disease neighborhoods that connect the seed disease genes (Berger et al. 2007; Chen et al. 2009; Kann 2009; Navlakha and Kingsford 2010; Oti et al. 2006; Zhang et al. 2011). For instance, by calculating the shortest path between seed genes using a protein interaction network, it was shown that a much shorter mean path length exists between eight proteins involved in genetic syndromes strongly associated with ASD compared with the mean shortest path between random proteins (Sakai et al. 2011). This observation suggests a close connectivity among some known ASD‐ related proteins. An alternative method, the mean‐first‐passage‐time (MFPT) uses diffusion‐based random walks on networks instead of shortest paths. MFPT is the average steps a random‐walker takes to reach a specific node from a given node in the background network. Comparing different methods for classifying and recovering disease genes with background protein interaction networks, the MFPT approach appears to outperform most other methods (Navlakha and Kingsford 2010). Berger et al. (Berger et al. 2010) implemented an MFPT‐based ranking system to identify a distinct disease gene neighborhood by exploring the relationship between known long‐QT syndrome (LQTS) genes using a human protein interactome. Such network‐based classifiers can be used to rank disease genes and candidate disease genes based on their proximity to the disease subnetwork locus. An alternative and related approach is to classify and rank disease genes based on known disease genes attributes. For example, Support Vector Machine (SVM) (Byvatov and Schneider 2003) is a popular supervised learning method that has been applied to classify genes based on their shared functional attributes (Xu et al. 2010). In another example, Li et al. (Li et al. 2009) developed an SVM classifier trained with features that include protein interactions, protein domains and enriched Gene Ontology (GO) terms of known cancer genes to prioritize putative cancer genes; more recently, a set of DNA repair genes were predicted by an SVM classifier trained with gene expression data (Jiang and Ching 2011). Similarly, we developed an SVM classifier for prioritizing pluripotency stem cell regulators from RNAi screens using microarray and ChIP‐ seq data (Xu et al. 2010). The SVM strategy could be applied to classify ASD and ID genes based on attributes extracted from heterogeneous data sources. Here we developed three supervised learning methods to classify and prioritize ASD and ID disease genes. Two of the classifiers are network‐based and one is attribute‐based. We find that such methods are show promise in predicting and ranking ASD and ID genes and there is significant overlap between these two disorders as well as the top genes used for the classification. Furthermore, we identified subnetworks that connect the most informative genes to potentially point to the disease molecular loci. The use of such approaches in ongoing WES and WGS sequencing projects will help with gene and pathway identification in neurodevelopmental disorders and can be applied to other complex disorders as well.
Approach
ASD and ID gene lists
We made use of manually curated lists of genes implicated in ASD. We focused on genes where there was prior evidence of an etiological role in ASD (i.e., genes of major effect for ASD). We began with a
carefully curated list of 103 such genes implicated in ASD, with or without intellectual disability (ID), from a recent review by one of us (CB) (Betancur 2011). In that study, an extensive literature search was conducted looking for articles describing genetic disorders in patients with autism, ASD, pervasive developmental disorder, Asperger syndrome, or autistic/autistic‐like traits/features/behavior, using PubMed and Google Scholar, as well as follow‐up of references cited in the papers thus identified. This list is meant to be as exhaustive as possible, and has therefore been routinely updated by the author using the same criteria such that 11 additional genes were added since the published report (BBS10, DPYD, FOLR1, GNS, GRIN2B, HEPACAM, HGSNAT, KCNJ11, NAGLU, SCN2A and STXBP1). The final list of 114 genes implicated in ASD (ASD114) is shown in Table 1. Since most high‐risk ASD genes were identified by unbiased genetic approaches (e.g., characterization of translocation breakpoints, recurrent copy number variants, X‐linked genes first identified by linkage, etc), ASD114 represents a largely unbiased list of such genes. A similar list was developed by the same author to include a very diverse, but not exhaustive, group of genes implicated in ID (n=223), which provided a means to assess the behavior of the classifiers against a separate list of neurodevelopmental genes. This gene list was developed in an analogous manner to the ASD gene list, and included genes implicated in ID that were not already in the ASD gene list (note that all genes on the ASD list are also considered genes for ID and many genes first identified in ID have since been shown to contribute to ASD; see Figure 1 in (Betancur 2011) for many examples on the X chromosome). The ID list is shown in Table 2. All gene lists were prepared and frozen before the start of the analyses described here.
Mammalian protein‐protein interaction network
We collected protein‐protein interactions (PPI) data from the following databases and papers: BioGrid (Stark et al. 2006), HPRD (Peri et al. 2004), InnateDB (Lynn et al. 2008), IntAct (Hermjakob et al. 2004), KEGG (Kanehisa et al. 2008), KEA (Lachmann and Ma'ayan 2009), MINT (Chatr‐aryamontri et al. 2007), MIPS (Mewes et al. 2004), DIP (Xenarios et al. 2000), BIND (Bader et al. 2003), BioCarta, PDZBase (Beuming et al. 2005), PPID (Yu et al. 2011; Stelzl et al. 2005; Ewing et al. 2007; Rual et al. 2005; Ma'ayan et al. 2005). Gene/protein IDs were converted to Entrez gene symbols. To increase the confidence of the protein interaction dataset we filtered the interaction table by removing interactions from PubMed identifiers (PMIDs) that have more than 10 interactions. The final PPI network is fully connected and consists of 14,191 nodes and 64,741 non‐redundant, high‐confident interactions. From the two gene lists, 82 genes from the ASD list and 158 from the ID gene list were found in the final PPI network. The filtered network can be found in Supplemental Table 1.
Control and comparison gene lists
Six types of control gene lists were generated for statistical tests: completely random, degree‐matched, brain expressed, GO biological process matched, GO molecular function matched, and GO cellular component matched. All of the control gene lists contained the same number of genes as the seed lists, which is 82 for ASD and 158 for ID. Random lists are made of randomly selected genes picked from the background network. To construct the degree‐matched control lists, the connectivity degree of all genes in the network were distributed into bins. Genes were then picked from the same bins as the seed genes. Since the genes in the ASD and ID lists are likely biased toward brain expressed, we also took advantage of a dataset of brain‐expressed genes (Kang et al. 2011) and randomly selected genes from this dataset. To obtain a list of brain expressed genes, brain regions were dissected from 57 clinically unremarkable postmortem brains of donors ranging from 6 post conceptual weeks to 82 years, which were divided into 15 periods based on age, and the expression levels of 17,565 protein‐coding genes within each sample were assayed using the Affymetrix GeneChip Human Exon 1.0 ST Array platform. A list of “brain‐ expressed” genes (graciously provided by Drs. Stephan J Sanders and Kyle Meyer) included genes having
a log2‐transformed signal intensity ≥6 in at least one sample and a mean detection above background (DABG) P<0.01 in at least one brain region of at least one period. The GO‐matched control lists were created using GO Slim. Using the Jaccard similarity score to assess overlap of GO terms between pairs of genes; we randomly picked genes having at least a 0.4 Jaccard similarity score when compared to each of the original seed nodes.
Shortest path algorithm for defining distance to seed gene list
The distance (Di) from a given node to the seed gene list, i.e., ASD or ID gene list, is defined as the
average shortest path along the PPI network from the node to all genes in the seed list. The pair‐wise shortest path length was obtained using Johnson’s algorithm in MATLAB. Dijkstra’s algorithm was implemented to obtain the specific nodes along the shortest paths. All genes in the PPI network were ranked according to their Di to the seed gene list. We conducted leave‐one‐out cross validation (LOOCV)
for the seed gene lists by leaving one seed gene out and computing the Di from this gene to the rest of the seed genes. Receiver operating characteristic (ROC) curves were derived by gradually increasing the Di cutoff. True positive rate (TPR) was defined as the proportion of genes from the input list with Di
shorter than an arbitrary cutoff; whereas false positive rate (FPR) was the proportion of genes with Di shorter than the cutoff but not in the input list. 50 lists were generated for each control list type for comparison, and the means FPR and TPR for the 50 control lists were used to plot the ROC curves.
Mean‐first‐passage‐time to identify genes in a PPI neighborhood
Mean‐first‐passage‐time (MFPT) is the average steps a random walker takes to reach a specific node from a given seed node and provides an alternative way to quantify the distance between pairs of genes. To explore the neighborhood of a list of seed nodes, we defined a module distance score Sj as the
difference of MFPT steps starting from non‐seed nodes in the background network, compared with starting from seed nodes, normalized by the average MFPT steps a random walker takes to reach the same node from a random start as follows (Berger et al. 2010):
Where Nn is the set of seed nodes and Ns is the set of nodes reachable by a random walker starting from
the seed nodes, and Tij is the matrix containing pair‐wise MFPT computed for the background network. Therefore the score Sj above zero indicates that on average the target node is located closer to the seed genes than other randomly selected genes in the background network. All nodes in the PPI network were ranked according to their Sj score obtained using ASD or ID genes as seed nodes. Support Vector Machine (SVM) classifiers for predicting and ranking genes We utilized 11 gene‐set libraries to generate features/attributes for all genes or gene products from the network. The gene‐set libraries were previously created by us for the program Lists2Networks (Lachmann and Ma'ayan 2010) or downloaded from open online sources. These gene‐set libraries include: GO biological processes, GO cellular components, and GO molecular functions (libraries 1‐3); Transcription factor binding sites from TRANSFAC (Matys et al. 2003) or ChEA (Lachmann et al. 2010) (libraries 4‐5); Metabolites associated with gene‐lists (library 6); Knockout mouse phenotypes from the MGI‐MP browser (Gkoutos et al. 2004) (7); microRNA targets from TargetScan (8); Structural domains
(9); Hub proteins (10); and, gene signatures from GeneSigDB (Culhane et al. 2010) (11). In total we collected 8986 features represented as binary vectors each corresponding to a row entry in the gene‐set library. To set up the SVM we created negative and positive gene list sets of the same size. The negative sets are randomly generated based on the various criteria described above: randomly chosen, degree matched, GO term matched, and brain expressed. Positive examples are always ASD or ID genes. For each type of control gene list, 10 lists where created for training and testing and 10 classifiers were generated.
For each classifier, features were ranked, and the top 200 features were selected based on mutual information computed between the feature and the class calculated as follows:
(2)
where f is the feature and c the class. 200 features were selected after evaluating the performance of using 10, 50, 100, 150, or 200 features. The SVM classifiers map the data from the input space to a high‐ dimensional feature space in which classification can be performed by locating data points with respect to a hyperplane that separates, in our case, binary classes. The projection from the input space to the high‐dimensional feature space is achieved by a kernel function, which is used to transform the data for optimization of the classification. In this study, a standard linear kernel was used since it performed best after trying several other types of kernel functions. Each classifier was subjected to 10‐fold cross‐ validation: for each round among the total 10 rounds, 9 of the selected examples of a list were used for training the SVM classifier and 1 of the lists was left out for testing the performance of the learned SVM classifier. Five different scores were used to evaluate the classifiers’ performance. (1) Matthew’s correlation coefficient (MCC). In this equation, TP is the number of true positives; TN is the number of true negatives; FP is the number of false positives; FN is the number of false negatives. (2) Accuracy: (3) Sensitivity: (4) Specificity: Specificity ¼ TN TN þ FP (6)
(5) The area under the ROC curve (AUC) The AUC scores were computed using MATLAB’s build‐in function ‘perfcurve’ from the Statistics Toolbox and the results are provided in Tables 3 and 4. Results We made use of two non‐overlapping lists of 114 known ASD and 223 ID genes reflecting rare, high‐risk genes (Tables 1 and 2). These two gene lists are collected from sparse sources with various methods and the genes within those two lists, except for being enriched in neuronal functions and being brain expressed, do not have widespread functional relationships that are immediately apparent. Since the inclusion of the genes in these lists is not exhaustive, and many more genes are likely to be bona‐fide ASD or ID disease genes, the questions that we aim to address in our analysis here are as follows: For any gene that is not identified as an ASD or ID disease gene, can we predict whether the gene is likely to be an ASD or ID disease gene, i.e., can we rank genes for likelihood to be ASD or ID gene based on the known ASD/ID genes; and, can we prioritize and group the already known ASD and ID genes such that we can find functional relationships that connect known ID and ASD disease genes?
To address these questions we utilized prior knowledge about known mammalian PPI as well as functional annotations of human genes and their protein products. We addressed these questions by first developing two related PPI network‐based classifiers. These classifiers assume that the known ASD and ID genes form loci within the human interactome that reflect the dis‐regulation of molecular protein complexes in the human brain that lead to the associated phenotypes. If this is the case, and we have enough accurate information about binary protein interactions, we should be able to identify such loci and define the distance from such loci as a probability for genes to be found to contain variation that lead to the ASD or ID phenotype. To measure such distance we implemented two complimentary approaches, the shortest path and MFPT classifiers. These two methods define an average distance between the seed disease genes and the rest of the genes within the PPI network. Note that of these two classifiers, the MFPT approach was reported previously to perform better because it reduces the influence of hub nodes and can reach nodes that are not necessarily falling on shortest paths (Navlakha and Kingsford 2010).
To evaluate the ability of such network based classifiers to predict and rank ASD and ID disease genes we implemented a leave‐one‐out‐cross‐validation (LOOCV) analysis drawing neighborhood plots (Figs. 1‐2) and plotting ROC curves (Fig. 3) to evaluate the performance of the two network‐based classifiers. In this analysis we created several control lists and comparison lists to examine whether the classifiers outperform the misclassification of lists of genes with similar GO terms or lists of genes that are brain expressed. A first finding from our analysis is that the ASD and ID genes are closer to each other in PPI space than by chance (Table 5) and ID genes are significantly found in the ASD gene neighborhood (Figs. 1‐3). Moreover, the classifiers correctly classify ID genes using ASD‐gene derived classifiers and ASD genes using ID‐gene derived classifiers more specifically than misclassifying control‐lists. In the case of brain‐expressed genes, the MFPT ASD classifier can correctly classify ID genes with 75% accuracy and misclassify brain expressed genes on average only 63% of the time as potential ID genes (Fig. 3). The shortest‐path‐based ASD classifier performs slightly worst in classifying ID genes (70%). On the other hand the ID classifiers, MFPT or shortest‐path‐based, do not discriminate well between ASD genes and other genes, suggesting that the ID genes are more spread out randomly within the human interactome and are not good enough together to classify ASD genes.
Next we developed an SVM classifier by collecting and combining gene‐set libraries and setting each row from these libraries as a potential feature vector for classification. After sampling for various sizes of feature sets (Fig. 4C), we chose the top 200 features using mutual information (see Approach) to create SVM classifiers for ASD and ID genes. In our datasets, our SVM classifiers are capable of discriminating between ASD or ID genes and other genes with ~80%‐98% accuracy (Fig. 4 and Tables 3 and 4), performing better than the network‐based classifiers. Complete statistics of the performance of the SVM classifier are provided in Table 4. It is interesting to see that the ASD classifiers perform better than the ID classifiers, consistent with the network‐based classifiers, further suggesting that the ID gene list contains a broader and less discriminative list of genes/gene‐products. Looking at the top features that contribute most toward correct classification, we repeatedly observe that neuronal‐related knockout mouse phenotypes associated with a given gene contributed important information for correct classification (Supporting Table 2). For example, 7 of the top 10 features contributing to the ability of the SVM to distinguish between brain‐expressed genes and ASD genes relied on knockout mouse phenotypes. Interestingly, the knockout mouse phenotypes included those associated with morphological abnormalities as well as abnormalities in nervous system function and behavior, all of which are associated with ASD and ID.
As a final analysis, we attempted to integrate the results from all three classifiers by overlapping the top ranked genes and identifying the functional connections between them. For this we took the genes within a certain cutoff from the network‐based classifiers and the genes retrieved as positive by all SVM classifiers and examined their overlap (Fig. 5A‐B). We then connected the genes that overlap among all three ASD or ID classifiers using protein‐protein interactions and shared functional annotations by drawing edges if the two genes/gene products directly interact or if pairs of genes share significant number of overlapping annotations as defined by the gene set libraries we used for the SVM classifier. This resulted in four distinct clusters (Fig. 5E), consistent with the accumulating evidence that core pathways, common to ASD and ID, are perturbed in a recurrent manner in these related disorders.
Conclusions
In this study we developed two PPI based classifiers and one attribute based SVM classifier to discriminate between ASD or ID disease genes and other genes. All three classifiers perform better that random classifiers, however, the PPI based classifiers perform only slightly better that would be expected for classifying sets of genes with similar functional categories. In contrast, the SVM classifier performs well, likely because it relies on more data points. However, all classifiers report a relatively high degree of false positives. Nevertheless, all three classifiers point to a highly overlapping core of ASD and ID disease genes loci that organize into four clusters.
The use of these classifiers in ongoing gene and pathway discovery in neurodevelopmental disorders will facilitate discovery and the identification of high‐value therapeutic targets. In addition, the hub genes and networks identified (e.g., Fig. 5C‐E) can be experimentally perturbed in mouse models to observe their effects on phenotype and to be used for understanding of pathophysiology.
In this study gene expression data was not considered. However, such information can potentially be integrated within the classifiers. Gene expression can be added as attributes for the SVM classifier, or the differentially expressed genes between ASD or ID post‐mortem brains, as compared to normal controls, can add confidence to genes within the disease protein interaction neighborhoods. In addition, we can apply the methods presented here to better define the distances and shared mechanisms between other complex diseases with genetic underpinning.
While the complex enigma of pathways and networks in neurodevelopmental disorders is not resolved by these analyses, organizing the accumulated knowledge about ASD and ID genes within a supervised framework is likely to contribute towards a better understanding of the genetic and biological underpinning of this family of complex disorders.
Acknowledgements
This work was supported by the Seaver Foundation and by NIH grants P50GM071558‐03, R01DK088541‐ 01A1, RC2LM010994‐01 to AM. YK is a Seaver Graduate Fellow. We would like to thank Ruth Dannenfelser and Seth Berger for technical help and useful discussions. References Bader GD, Betel D, Hogue CWV. 2003. BIND: The Biomolecular Interaction Network Database. Nucl Acids Res 31:248‐250. Berger S, Posner J, Ma'ayan A. 2007. Genes2Networks: connecting lists of gene symbols using mammalian protein interactions databases. BMC Bioinformatics 8:372. Berger SI, Ma'ayan A, Iyengar R. 2010. Systems pharmacology of arrhythmias. Sci Signal 3:ra30. Betancur C. 2011. Etiological heterogeneity in autism spectrum disorders: More than 100 genetic and genomic disorders and still counting. Brain Res 1380:42‐77.
Beuming T, Skrabanek L, Niv MY, Mukherjee P, Weinstein H. 2005. PDZBase: a protein‐protein interaction database for PDZ‐ domains. Bioinformatics 21:827‐828.
Byvatov E, Schneider G. 2003. Support vector machine applications in bioinformatics. Appl Bioinformatics 2:67‐77.
Chatr‐aryamontri A, Ceol A, Palazzi LM, Nardelli G, Schneider MV, Castagnoli L, Cesareni G. 2007. MINT: The Molecular INTeraction database. Nucleic Acids Res 35:D572‐574.
Chen J, Aronow B, Jegga A. 2009. Disease candidate gene identification and prioritization using protein interaction networks. BMC Bioinformatics 10:73.
Culhane AC, Schwarzl T, Sultana R, Picard KC, Picard SC, Lu TH, Franklin KR, French SJ, Papenhausen G, Correll M, Quackenbush J. 2010. GeneSigDB a curated database of gene expression signatures. Nucleic Acids Res 38:D716‐D725.
El‐Fishawy P, State MW. 2009. The Genetics of Autism: Key Issues, Recent Findings, and Clinical Implications. Psychiatr Clin North Am 33:83‐105.
Ewing RM, Chu P, Elisma F, Li H, Taylor P, Climie S, McBroom‐Cerajewski L, Robinson MD, O'Connor L, Li M, Taylor R, Dharsee M, Ho Y, Heilbut A, Moore L, Zhang S, Ornatsky O, Bukhman YV, Ethier M, Sheng Y, Vasilescu J, Abu‐Farha M, Lambert JP, Duewel HS, Stewart II, Kuehl B, Hogue K, Colwill K, Gladwish K, Muskat B, Kinach R, Adams SL, Moran MF, Morin GB, Topaloglou T, Figeys D. 2007. Large‐scale mapping of human protein‐protein interactions by mass spectrometry. Mol Syst Biol 3:89. Gilman SR, Iossifov I, Levy D, Ronemus M, Wigler M, Vitkup D. 2011. Rare de novo variants associated with autism implicate a large functional network of genes involved in formation and function of synapses. Neuron 70:898‐907. Gkoutos G, Green E, Mallon A‐M, Hancock J, Davidson D. 2004. Using ontologies to describe mouse phenotypes. Genome Biol 6:R8. Hermjakob H, Montecchi‐Palazzi L, Lewington C, Mudali S, Kerrien S, Orchard S, Vingron M, Roechert B, Roepstorff P, Valencia A, Margalit H, Armstrong J, Bairoch A, Cesareni G, Sherman D, Apweiler Rl. 2004. IntAct: an open source molecular interaction database. Nucleic Acids Res 32:D452‐455. Jiang H, Ching WK. 2011. Classifying DNA repair genes by kernel‐based support vector machines. Bioinformation 7:257‐63. Kanehisa M, Araki M, Goto S, Hattori M, Hirakawa M, Itoh M, Katayama T, Kawashima S, Okuda S, Tokimatsu T, Yamanishi Yl. 2008. KEGG for linking genomes to life and the environment. Nucleic Acids Res 36:D480‐D484. Kang HJ, Kawasawa YI, Cheng F, Zhu Y, Xu X, Li M, Sousa AMM, Pletikos M, Meyer KA, Sedmak G, Guennel T, Shin Y, Johnson MB, Krsnik Z, Mayer S, Fertuzinhos S, Umlauf S, Lisgo SN, Vortmeyer A, Weinberger DR, Mane S, Hyde TM, Huttner A, Reimers M, Kleinman JE, Sestan N. 2011. Spatio‐temporal transcriptome of the human brain. Nature 478:483‐489.
Kann MG. 2009. Advances in translational bioinformatics: computational approaches for the hunting of disease genes. Brief Bioinformatics 11:96‐110.
Lachmann A, Ma'ayan A. 2009. KEA: Kinase enrichment analysis. Bioinformatics 25:684‐686.
Lachmann A, Ma'ayan A. 2010. Lists2Networks: Integrated analysis of gene/protein lists. BMC Bioinformatics 11:87.
Lachmann A, Xu H, Krishnan J, Berger SI, Mazloom AR, Ma'ayan A. 2010. ChEA: transcription factor regulation inferred from integrating genome‐wide ChIP‐X experiments. Bioinformatics 26:2438‐2444.
Li L, Zhang K, Lee J, Cordes S, Davis DP, Tang Z. 2009. Discovering cancer genes by integrating network and functional properties. BMC Med Genomics 2:61.
Lynn DJ, Winsor GL, Chan C, Richard N, Laird MR, Barsky A, Gardy JL, Roche FM, Chan THW, Shah N, Lo R, Naseer M, Que J, Yau M, Acab M, Tulpan D, Whiteside MD, Chikatamarla A, Mah B, Munzner T, Hokamp K, Hancock RE, Brinkman FS. 2008. InnateDB: facilitating systems‐level analyses of the mammalian innate immune response. Mol Syst Biol 4:218.
Ma'ayan A, Jenkins SL, Neves S, Hasseldine A, Grace E, Dubin‐Thaler B, Eungdamrong NJ, Weng G, Ram PT, Rice JJ, Kershenbaum A, Stolovitzky GA, Blitzer RD, Iyengar R. 2005. Formation of regulatory patterns during signal propagation in a mammalian cellular network. Science 309:1078‐1083.
Matys V, Fricke E, Geffers R, Gling E, Haubrock M, Hehl R, Hornischer K, Karas D, Kel AE, Kel‐Margoulis OV, Kloos DU, Land S, Lewicki‐Potapov B, Michael H, Münch R, Reuter I, Rotert S, Saxel H, Scheer M, Thiele S, Wingender E. 2003. TRANSFAC: transcriptional regulation, from patterns to profiles. Nucleic Acids Res 31:374‐378.
Mewes H, Amid C, Arnold R, Frishman D, Guldener U, Mannhaupt G, Munsterkotter M, Pagel P, Strack N, Stumpflen V, Warfsmann J, Ruepp A. 2004. MIPS: analysis and annotation of proteins from whole genomes. Nucleic Acids Res 32:D41‐ D44.
Navlakha S, Kingsford C. 2010. The power of protein interaction networks for associating genes with diseases. Bioinformatics 26:1057‐1063.
Oti M, Snel B, Huynen MA, Brunner HG. 2006. Predicting disease genes using protein‐protein interactions. J Med Genet 43:691‐ 698.
Peri S, Navarro JD, Kristiansen TZ, Amanchy R, Surendranath V, Muthusamy B, Gandhi TKB, Chandrika KN, Deshpande N, Suresh S, Rashmi BP, Shanker K, Padma N, Niranjan V, Harsha HC, Talreja N, Vrushabendra BM, Ramya MA, Yatish AJ, Joy M, Shivashankar HN, Kavitha MP, Menezes M, Choudhury DR, Ghosh N, Saravana R, Chandran S, Mohan S, Jonna‐ lagadda CK, Prasad CK, Kumar‐Sinha C, Deshpande KS, Pandey A. 2004. Human protein reference database as a discovery resource for proteomics. Nucl Acids Res 32:D497‐501.
Rual J‐F, Venkatesan K, Hao T, Hirozane‐Kishikawa T, Dricot A, Li N, Berriz GF, Gibbons FD, Dreze M, Ayivi‐Guedehoussou N, Klitgord N, Simon C, Boxem M, Milstein S, Rosenberg J, Goldberg DS, Zhang LV, Wong SL, Franklin G, Li S, Albala JS, Lim J, Fraughton C, Llamosas E, Cevik S, Bex C, Lamesch P, Sikorski RS, Vandenhaute J, Zoghbi HY, Smolyar A, Bosak S, Sequerra R, Doucette‐Stamm L, Cusick ME, Hill DE, Roth FP, Vidal M. 2005. Towards a proteome‐scale map of the human protein‐protein interaction network. Nature 437:1173‐1178.
Sakai Y, Shaw CA, Dawson BC, Dugas DV, Al‐Mohtaseb Z, Hill DE, Zoghbi HY. 2011. Protein interactome reveals converging molecular pathways among autism disorders. Sci Transl Med 3:86ra49.
Sanders SJ, Ercan‐Sencicek AG, Hus V, Luo R, Murtha MT, Moreno‐De‐Luca D, Chu SH, Moreau MP, Gupta AR, Thomson SA, Mason CE, Bilguvar K, Celestino‐Soper PB, Choi M, Crawford EL, Davis L, Wright NR, Dhodapkar RM, DiCola M, DiLullo NM, Fernandez TV, Fielding‐Singh V, Fishman DO, Frahm S, Garagaloyan R, Goh GS, Kammela S, Klei L, Lowe JK, Lund SC, McGrew AD, Meyer KA, Moffat WJ, Murdoch JD, O’Roak BJ, Ober GT, Pottenger RS, Raubeson MJ, Song Y, Wang Q, Yaspan BL, Yu TW, Yurkiewicz IR, Beaudet AL, Cantor RM, Curland M, Grice DE, Günel M, Lifton RP, Mane SM, Martin DM, Shaw CA, Sheldon M, Tischfield JA, Walsh CA, Morrow EM, Ledbetter DH, Fombonne E, Lord C, Martin CL, Brooks AI, Sutcliffe JS, Cook EH Jr, Geschwind D, Roeder K, Devlin B, State MW. 2011. Multiple recurrent de novo CNVs, Including duplications of the 7q11.23 Williams syndrome region, are strongly associated with autism. Neuron 70:863‐885. Stark C, Breitkreutz B‐J, Reguly T, Boucher L, Breitkreutz A, Tyers M. 2006. BioGRID: a general repository for interaction datasets. Nucl Acids Res 34:D535‐539. Stelzl U, Worm U, Lalowski M, Haenig C, Brembeck FH, Goehler H, Stroedicke M, Zenkner M, Schoenherr A, Koeppen S Timm J, Mintzlaff S, Abraham C, Bock N, Kietzmann S, Goedde A, Toksöz E, Droege A, Krobitsch S, Korn B, Birchmeier W, Lehrach H, Wanker EE. 2005. A human protein‐protein interaction network: A resource for annotating the proteome. Cell 122:957‐968. Topper S, Ober C, Das S. 2011. Exome sequencing and the genetics of intellectual disability. Clin Genet 80:117‐126. Voineagu I, Wang X, Johnston P, Lowe JK, Tian Y, Horvath S, Mill J, Cantor RM, Blencowe BJ, Geschwind DH. 2011. Transcriptomic analysis of autistic brain reveals convergent molecular pathology. Nature 474:380‐4.
Xenarios I, Rice DW, Salwinski L, Baron MK, Marcotte EM, Eisenberg D. 2000. DIP: the Database of Interacting Proteins. Nucl Acids Res 28:289‐291.
Xu H, Lemischka IR, Ma'ayan A. 2010. SVM classifier to predict genes important for self‐renewal and pluripotency of mouse embryonic stem cells. BMC Syst Biol 4:173.
Yu H, Tardivo L, Tam S, Weiner E, Gebreab F, Fan C, Svrzikapa N, Hirozane‐Kishikawa T, Rietman E, Yang X, Sahalie J, Salehi‐ Ashtiani K, Hao T, Cusick ME, Hill DE, Roth FP, Braun P, Vidal M. 2011. Next‐generation sequencing to generate interactome datasets. Nat Meth 8:478‐480.
Zhang W, Sun F, Jiang R. 2011. Integrating multiple protein‐protein interaction networks to prioritize disease genes: a Bayesian regression approach. BMC Bioinformatics 12:S11.
Ziats MN, Rennert OM. 2011. Expression profiling of autism candidate genes during human brain development implicates central immune signaling pathways. PLoS One 6:e24691.
Table 1. Seed list of 114 ASD genes
ACSL4, ADSL, AFF2, AGTR2, AHI1, ALDH5A1, ALDH7A1, AP1S2, ARHGEF6, ARX, ATRX, BBS10, BRAF, BTD, CACNA1C, CACNA1F, CASK, CDKL5, CEP290, CHD7, CNTNAP2, CREBBP, DCX, DHCR7, DMD, DMPK, DPYD, EHMT1, FGD1, FGFR2, FMR1, FOLR1, FOXG1, FOXP1, FTSJ1, GAMT, GATM, GNS, GRIA3, GRIN2B, GUCY2D, HEPACAM, HGSNAT, HOXA1, HRAS, IGF2, IL1RAPL1, IQSEC2, JARID1C, KCNJ11, KIAA2022, KRAS, L1CAM, L2HGDH, LAMP2, MAP2K1, MBD5, MECP2, MED12, MEF2C, MID1, MKKS, NAGLU, NDP, NF1, NFIX, NHS, NIPBL, NLGN3, NLGN4X, NPHP1, NRXN1, NSD1, OCRL, OPHN1, OTC, PAFAH1B1, PAH, PCDH19, PHF6, PHF8, POMGNT1, POMT1, PQBP1, PRSS12, PTCHD1, PTEN, PTPN11, RAB39B, RAI1, RNF135, RPE65, RPGRIP1L, SATB2, SCN1A, SCN2A, SGSH, SHANK2, SHANK3, SLC6A8, SLC9A6, SMC1A, STXBP1, SYN1, SYNGAP1, TBX1, TSC1, TSC2, UBE3A, UPF3B, VPS13B, YWHAE, ZNF674, ZNF81 Table 2. Seed list of 223 ID genes
ABCD1, AGA, AIPL1, ALG12, ALG3, ALG6, ALG8, ALG9, ANKH, ANKRD11, AP4B1, AP4E1, AP4M1, AP4S1, ARFGEF2, ARG1, ARHGEF9, ARL13B, ARL6, ASPM, ASXL1, ATP6AP2, ATP6V0A2, ATP7A, ATR, AVPR2, BBS1, BBS12, BBS2, BBS4, BBS5, BBS7, BBS9, BCKDHA, BCKDHB, BCOR, BRWD3, C7ORF11, CA8, CBL, CBS, CC2D1A, CC2D2A, CDH15, CDK5RAP2, CENPJ, CEP152, CHKB, COG1, COG8, COL4A1, CRB1, CRBN, CRX, CTSA, CUL4B, CYB5R3, DAG1, DBT, DIP2B, DKC1, DLD, DLG3, DNMT3B, DPM1, EP300, ERCC1, ERCC2, ERCC3, ERCC5, ERCC6, ERCC8, ERLIN2, FANCB, FH, FKRP, FKTN, FLNA, FUCA1, GAD1, GALC, GALE, GCH1, GDI1, GFAP, GK, GLB1, GNPTAB, GNPTG, GPC3, GPR56, GPSN2, GRIK2, GRIN2A, GTF2H5, GUSB, HCCS, HDAC4, HPRT1, HSD17B10, HUWE1, IDS, IDUA, IER3IP1, IGBP1, IGF1, IKBKG, IMPDH1, INPP5E, KCNJ10, KCNK9, KIAA0226, KIAA1033, KIAA1279, KIF7, KIRREL3, KLF8, LAMA2, LARGE, LCA5, LRAT, MAGT1, MAN1B1, MAOA, MAP2K2, MCOLN1, MCPH1, MED17, MED23, MGAT2, MKS1, MLL2, MOCS1, MOCS2, MPDU1, MYCN, NDUFA1, NEU1, NRAS, NSDHL, OFD1, PAK3, PAX6, PCNT, PDHA1, PEX7, PGK1, PLP1, PMM2, PNKP, POMT2, PORCN, PRPS1, PVRL1, QDPR, RAB18, RAB3GAP1, RAB3GAP2, RAF1, RD3, RDH12, RECQL4, RELN, RPGRIP1, RPS6KA3, SETBP1, SHOC2, SHROOM4, SIL1, SLC12A6, SLC16A2, SLC17A5, SLC1A1, SLC25A15, SLC25A22, SLC2A1, SLC35C1, SLC46A1, SLC4A4, SMC3, SMS, SNAP29, SOBP, SOS1, SOX3, SPATA7, SPRED1, SPTAN1, SRD5A3, SRPX2, ST3GAL3, STIL, SUMF1, SUOX, SYP, SYT14, TBC1D24, TBCE, TCF4, TGFBR1, TGFBR2, TIMM8A, TMEM216, TMEM67, TRAPPC9, TRIM32, TSEN2, TSEN54, TSPAN7, TTC8, TUBA1A, TUBB2B, TUSC3, UBE2A, VLDLR, VRK1, WDR62, WDR81, ZC3H14, ZDHHC9, ZEB2, ZNF41, ZNF711
Table 3. ASD or ID genes retrieved with attributes‐based SVM classifiers
ASD genes retrieved from ID genes classifier ID genes retrieved from ASD genes classifier
AGTR2, ALDH5A1, ALDH7A1, AP1S2, ARHGEF6, ATRX, BRAF, CACNA1C, CACNA1F, CASK, CEP290, CHD7, CNTNAP2, CREBBP, DCX, DMD, DMPK, EHMT1, FGD1, FGFR2, FMR1, FOXG1, FOXP1, GNS, GRIN2B, HOXA1, HRAS, IGF2, IL1RAPL1, KCNJ11, L1CAM, LAMP2, MAP2K1, MBD5, MECP2, MEF2C, MID1, MKKS, NDP, NFIX, NIPBL, NLGN3, NLGN4X, NPHP1, NRXN1, NSD1, OCRL, PAFAH1B1, PAH, PQBP1, PTEN, PTPN11, RAI1, RNF135, SATB2, SCN1A, SHANK2, SLC9A6, SMC1A, STXBP1, SYN1, SYNGAP1, TBX1, TSC1, TSC2, UBE3A, UPF3B, YWHAE
ABCD1, AGA, AIPL1, ALG8, ALG9, ANKRD11, AP4B1, AP4E1, ARFGEF2, ARG1, ARHGEF9, ARL6, ASPM, ASXL1, ATP6AP2, ATP6V0A2, ATP7A, ATR, AVPR2, BBS1, BBS2, BBS4, BBS7, BCKDHA, BCOR, CA8, CBL, CBS, CC2D1A, CDH15, CDK5RAP2, CENPJ, COG1, COG8, COL4A1, CRB1, CRBN, CRX, CTSA, CUL4B, CYB5R3, DAG1, DBT, DKC1, DLD, DLG3, DNMT3B, DPM1, EP300, ERCC1, ERCC2, ERCC3, ERCC5, ERCC6, ERCC8, FANCB, FLNA, GAD1, GCH1, GDI1, GFAP, GLB1, GPC3, GRIK2, GRIN2A, GTF2H5, HCCS, HDAC4, HPRT1, HUWE1, IDUA, IGBP1, IGF1, IKBKG, IMPDH1, KCNJ10, KIAA0226, KIAA1033, KIRREL3, KLF8, LAMA2, MAOA, MCOLN1, MCPH1, MED17, MKS1, MLL2, MYCN, NEU1, NRAS, OFD1, PAK3, PAX6, PDHA1, PEX7, PGK1, PLP1, PNKP, PORCN, PRPS1, PVRL1, QDPR, RAB3GAP1, RAF1, RECQL4, RELN, RPGRIP1, RPS6KA3, SETBP1, SHOC2, SIL1, SLC12A6, SLC1A1, SLC2A1, SLC4A4, SMC3, SMS, SNAP29, SOS1, SPRED1, SPTAN1, ST3GAL3, STIL, SUMF1, SYP, TBCE, TCF4, TGFBR1, TGFBR2, TIMM8A, TRAPPC9, TRIM32, TTC8, TUBA1A, TUBB2B, TUSC3, UBE2A, VLDLR, VRK1, WDR62, ZEB2, ZNF41
Genes listed in the table are the intersection of genes retrievable by all six SVMclassifiers trainedwith different types of control gene lists.
Table 4. SVM classification results
ASD classifier MCC Accu. Sens. Spec. AUC mean AUC SD Ret. Ret. %
Ret. Rand. Ret. % Rand. P‐value BrExp 0.69 0.84 0.79 0.89 0.94 0.05 68 0.43 48.2 0.31 1.29E‐28 Degree 0.80 0.90 0.84 0.95 0.97 0.04 64 0.41 34.5 0.22 3.04E‐40 GO BP 0.72 0.85 0.76 0.95 0.95 0.07 64 0.41 42.3 0.27 1.02E‐32 GO CC 0.67 0.84 0.78 0.89 0.96 0.05 64 0.41 37.6 0.24 5.72E‐36 GO MF 0.79 0.89 0.82 0.96 0.97 0.04 78 0.49 50.1 0.32 3.22E‐42 Random 0.84 0.92 0.89 0.95 0.97 0.04 68 0.43 34.2 0.22 2.74E‐39 ID classifier BrExp 0.52 0.76 0.75 0.78 0.86 0.07 49 0.60 35.7 0.44 1.64E‐28 Degree 0.48 0.74 0.70 0.77 0.84 0.05 58 0.71 28.9 0.35 5.71E‐40 GO BP 0.57 0.78 0.75 0.82 0.85 0.08 9 0.11 3.58 0.04 9.38E‐24 GO CC 0.49 0.75 0.72 0.77 0.84 0.06 62 0.76 29.0 0.35 7.01E‐43 GO MF 0.61 0.80 0.74 0.87 0.90 0.07 36 0.44 19.2 0.23 9.92E‐33 Random 0.53 0.77 0.71 0.82 0.87 0.07 52 0.63 22.7 0.28 2.87E‐42 Matthew’s correlation coefficient (MCC), Accuracy, Sensitivity, Specificity, and area under the curve (AUC) computed for all SVM classifiers. BrExp, brain expressed; GO BP, gene ontology biological process matched; GO CC, gene ontology cellular component matched; GO MF, gene ontology molecular function matched; Ret., retrieved; rand., random; SD, standard deviation. Table 5. Shortest path averages and standard deviations between all genes/proteins in the PPI network, or between ID, ASD, ASD+ID genes
All pairs ID genes ASD genes ASD+ID genes
Average 4.4817 4.0323 3.5265 3.8867
Standard deviation 0.031 0.0491 0.0651 0.041
Supplemental Tables
Supplemental Table 1. PPI network. Filtered PPI background network used to build the network based classifiers.
Supplemental Table 2. Top features for the ASD SVM classifiers. Features vector from gene‐set libararies that distinguish ASD and ID genes for the different ASD SVM classifiers.
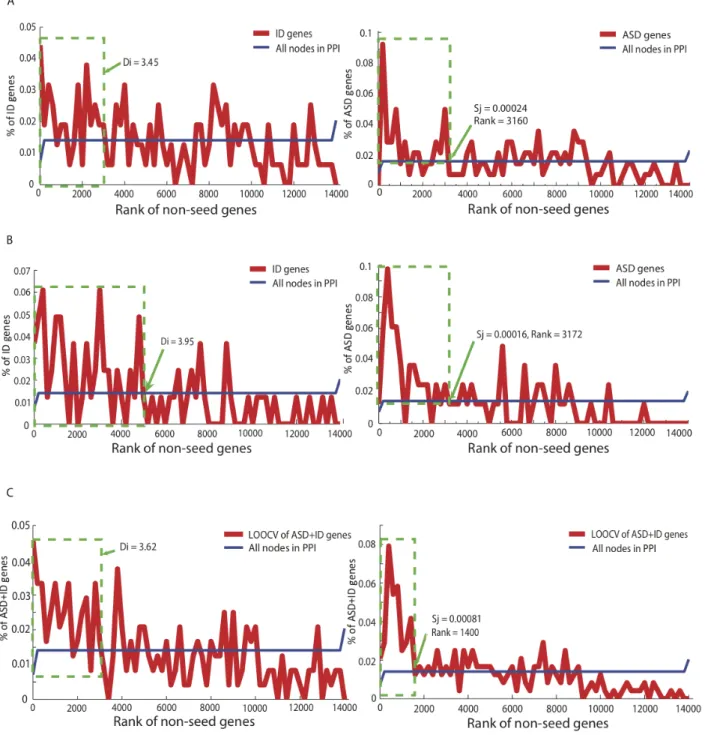
Figure 1. Identification of (A) ID genes in the ASD genes neighborhood, (B) ASD genes in the ID genes neighborhood or, (C)
LOOCV of the ASD+ID genes neighborhood. Shortest path distance Di (left) and MFPT score Sj (right) were computed for each
node in the PPI network. The number of ID or ASD genes identified in each neighborhood within the specified cutoff range is shown on the left and the leave‐one‐out cross validation (LOOCV) of the seed gene lists is shown on the right.
Figure 2. Non‐cumulative percentages of identified non‐seed gene hits per shortest path distance and MFPT score ranking in
(A) ASD, (B) ID, or (C) ASD+ID neighborhoods. The green frames show Di and Sj scores chosen arbitrarily as disease
Figure 3. ROC curves and AUC analysis for the identification of (A) ASD genes, or (B) ID genes in ID or ASD gene
neighborhoods. The Di of each gene to the seed list was calculated and the ROC curve was plotted by increasing the cutoff
distance by steps of 0.05, starting from the minimum distance of all genes in the network. True positive rate (TPR) was defined as the proportion of genes from the inquiring list with Di shorter than the cutoff distance over the total number of genes in the list and false positive rate (FPR) the proportion of genes with Di shorter than the cutoff distance but not in the inquiring list over total number of genes not in the list. 50 lists were generated for each control type for comparison, as shown in different colors. The mean FPR and TPR for the 50 control lists were used to plot the ROC curve. In the AUC section, t‐test statistics was performed with the null hypothesis that the AUC of ASD/ID genes identification can be achieved with random gene lists of each type. P value <0.0001 is indicated as double stars (**), and <0.01 as single star (*). The ROC curve of Sj was plotted in the same way by increasing the cutoff rank by one gene. BrExp, brain expressed; GO_BP, gene ontology biological process matched; GO_MF, gene ontology molecular function matched; GO_CC, gene ontology cellular component matched.
Figure 4. ROC curves and AUC analysis of the SVM classifiers of (A) ASD or (B) ID genes. The classifiers are trained and tested
by 10‐fold cross‐validation using seed genes and different types of control gene lists with the same size. An average ROC curve for the 10 folds for each classifier is plotted. Inset plots show the average AUC with standard deviation for each classifier.
Figure 5. Genes identified using the three classifiers and their connections using functional associated networks. The shortest path
distance of 3.95 and 3.65 (shown in Fig. 2) were applied as cutoff for the identification of (A) ASD genes or (B) ID genes, respectively. The number of SVM retrieved genes is the intersection of genes retrievable by all six classifiers trained by different types of control gene lists. The 39 ASD genes and 59 ID genes identified in all three classifiers, as well as the 39+59 genes are connected using functional associated networks with the software Genes2FANs (http://actin.pharm.mssm.edu/genes2FANs) and direct interactions are shown in (C) for the 39 ASD genes, (D) 59 ID genes and (E) 39+59 combined genes.