HAL Id: hal-02886343
https://hal.archives-ouvertes.fr/hal-02886343
Submitted on 16 Sep 2020HAL is a multi-disciplinary open access archive for the deposit and dissemination of sci-entific research documents, whether they are pub-lished or not. The documents may come from teaching and research institutions in France or abroad, or from public or private research centers.
L’archive ouverte pluridisciplinaire HAL, est destinée au dépôt et à la diffusion de documents scientifiques de niveau recherche, publiés ou non, émanant des établissements d’enseignement et de recherche français ou étrangers, des laboratoires publics ou privés.
Trevor Murray, Zoltan Kocsi, Hansjürgen Dahmen, Ajay Narendra, Florent Le
Moël, Antoine Wystrach, Jochen Zeil
To cite this version:
Trevor Murray, Zoltan Kocsi, Hansjürgen Dahmen, Ajay Narendra, Florent Le Moël, et al.. The role of attractive and repellent scene memories in ant homing (Myrmecia croslandi). Journal of Experimental Biology, Cambridge University Press, 2020, 223 (3), pp.jeb210021. �10.1242/jeb.210021�. �hal-02886343�
The role of attractive and repellent scene memories
1
in ant homing (Myrmecia croslandi)
2 3
Trevor Murray1, Zoltan Kocsi1, Hansjürgen Dahmen2, Ajay Narendra3, Florent Le Möel4,
4
Antoine Wystrach4Ɨ, Jochen Zeil1Ɨ
5 6
1Research School of Biology, Australian National University, Canberra, Australia;
7
2 Cognitive Neuroscience, University of Tübingen, Tübingen, Germany
8
3Department of Biological Sciences, Macquarie University, Sydney, NSW 2109, Australia
9
4Research Center on Animal Cognition, University Paul Sabatier/CNRS, Toulouse, France
10
Ɨ Co-last authors
11 12 13
Corresponding author: Trevor Murray, trevor.murray@anu.edu.au
14
Running title: Views and navigational information
15
Key words: Visual navigation, ants, attractive and repellent memories, homing, route
16
following, Myrmecia croslandi
17 18
Abstract
19
Solitary foraging ants rely on vision when travelling along routes and when pinpointing their
20
nest. We tethered foragers of Myrmecia croslandi on a trackball and recorded their intended
21
movements when the trackball was located on their normal foraging corridor (on-route),
22
above their nest and at a location several meters away where they have never been before
23
(off-route). We find that at on- and off-route locations, most ants walk in the nest or foraging
24
direction and continue to do so for tens of metres in a straight line. In contrast, above the
25
nest, ants walk in random directions and change walking direction frequently. In addition, the
26
walking direction of ants above the nest oscillates at a fine scale, reflecting search movements
27
that are absent from the paths of ants at the other locations. An agent-based simulation
28
shows that the behaviour of ants at all three locations can be explained by the integration of
29
attractive and repellent views directed towards or away from the nest, respectively. Ants are
30
likely to acquire such views via systematic scanning movements during their learning walks.
31
The model predicts that ants placed in a completely unfamiliar environment should behave
32
as if at the nest, which our subsequent experiments confirmed. We conclude first, that the
33
ants’ behaviour at release sites is exclusively driven by what they currently see and not by
34
information on expected outcomes of their behaviour. Second, that navigating ants might
35
continuously integrate attractive and repellent visual memories. We discuss the benefits of
36 such a procedure. 37 250 words 38 39
Introduction
40
Navigation on a local, in contrast to a global, scale involves travelling along routes and
41
pinpointing places (e.g. Zeil 2012). Much evidence has accumulated to show that ants form
42
visual memories of how the scene looks along routes (e.g. Wehner et al., 1996; Wystrach et
43
al., 2011; Mangan and Webb, 2012) and that alignment matching (Zeil et al., 2003; Collett et
44
al., 2013) between memorized and currently experienced views provides robust information
45
on heading direction (Graham and Cheng, 2009; Baddeley et al., 2011, 2012; Narendra et al.,
46
2013; Zeil et al., 2014). Heading direction can be recovered, even from locations at some
47
distance from familiar locations, by detecting the minimum of the rotational image difference
48
function resulting from a comparison between current and memorised views (rotIDF, Zeil et
49
al., 2003, Stürzl and Zeil, 2007, Philippides et al., 2011; Narendra et al., 2013; Stürzl et al.,
50
2015). This minimum provides a measure of familiarity in addition to a heading direction
51
(Baddeley et al., 2011, 2012; Graham et al., 2010).
52
Before becoming foragers, ants perform a series of learning walks around the nest during
53
which they alternate between turning to look in the nest direction (Müller and Wehner, 2010;
54
Fleischmann et al., 2016, 2017, 2018a,b) and in directions away from the nest from different
55
compass directions (Jayatilaka et al., 2018; reviewed in Zeil and Fleischmann, 2019). It is
56
attractive to assume that the ants store snapshots during these turns whenever they are
57
aligned parallel to the home vector, that is, when they are facing toward or away from the
58
nest direction (Wehner and Müller, 2010; Graham et al., 2010; Jayatilaka et al., 2018), as this
59
is theoretically sufficient for returning ants to align with and walk into the direction of the
60
most familiar of nest-directed snapshots in order to pinpoint the nest (Graham et al., 2010;
61
Baddeley et al., 2012; Wystrach et al,. 2013).
62
Such visual ‘alignment matching’ (Collett et al., 2013) explains well how ants recover the
63
correct direction when on their familiar route (Wystrach et al., 2011b; Wystrach et al., 2012;
64
Baddeley et al., 2012; Kodzhabashev and Mangan, 2015). Moreover, nest-directed views
65
acquired during learning walks (reviewed in Collett and Zeil, 2018; Zeil and Fleischmann, 2019)
66
can also provide guidance from locations that are unfamiliar to ants and that can be 10-15m
67
away from the nest in open forest habitats (Narendra et al., 2013; Stürzl et al., 2015), although
the initial movements of released ants may not be directed toward the nest (Zeil et al., 2014),
69
but toward a familiar route (Collett et al., 2007; Wystrach et al., 2012).
70
Overall, this line of work has led to the suggestion that visually navigating insects would only
71
need ‘procedural knowledge’ about knowing where to go rather than requiring a more
72
sophisticated representation of their spatial environment that would allow them ‘to know
73
where they are’ (Collett et al., 2002; Wehner et al., 2006; Cheung et al., 2014; Graham and
74
Philippides, 2017).
75
To test this directly, we positioned ants that we had tethered over a trackball at different
76
locations in their natural foraging environment, including above their nest, and recorded their
77
intended direction and distance of movement. Ants mounted on the ball were well oriented
78
towards the nest at both on and off route locations, but displayed a search pattern when
79
above the nest, as if they knew they were at the nest, implying a sort of positional rather than
80
just procedural knowledge. Using a simple agent-based-simulation we show, however, that
81
these results can be more parsimoniously explained by alignment matching involving
82
continuous integration of attractive and repellent visual memories, acquired when facing
83
respectively towards and away from the nest during learning walks.
84 85
Materials and Methods
86
Ants and experimental site
87
We worked with foragers of the Australian Jack Jumper ant Myrmecia croslandi from a nest
88
in the Australian National University’s campus field station (-35° 16’ 49.87’’S and 149° 06’
89
43.74’’E). The ants are day-active, visually navigating solitary foragers that hunt for insects on
90
the ground at up to 4 m distance from the nest and on trees, about 12 m away from the nest
91
where they also feed on sugar secretions of plant-sucking insects (see centre panel top row,
92
Fig. 2). For details of the foraging ecology and the navigational abilities of these ants see
93
Jayatilaka et al. (2011, 2014), Narendra et al. (2013) and Zeil et al. (2014). During February to
94
March 2017 and December 2017 to March 2018, between 9:00 and 15:00, we caught foraging
95
ants either at their foraging trees about 12 m from the nest in a ‘full vector’ state (FV, n=10)
96
or at the nest in ‘zero vector’ state (ZV, n=18), offered them sugar water solution to feed on
before immobilizing them on ice for up to 15 min and tethering them to a metal pin by their
98
mesonotum (thorax) using Bondic liquid plastic welder (Biochem Solutions, Ellerslie, New
99
Zealand). The ants were placed on an air-cushioned light-weight, 5 cm diameter track ball (Fig.
100
1A) on which they were free to rotate around the yaw axis but that allowed us to record their
101
intended translational movements as described in detail by Dahmen et al. (2017). We placed
102
the trackball contraption with a tethered ant at each of three locations in a random order
103
(Fig. 2, top row centre panel): 6.5 m west of the nest where none of the ants were likely to
104
have been before (Off-route), 6.5m south of the nest, half-way along their normal foraging
105
route towards trees (On-route), and directly above the nest (Nest).
106
We recorded the intended movement directions and distances on the trackball at each
107
displacement for up to 10 minutes, before shifting the track ball contraption together with
108
the tethered ant to the next location. Ants were carefully un-tethered and released close to
109
the nest following the three displacements.
110
To demonstrate the foraging patterns of ants at this nest and the full range of learning walks,
111
we show the paths of foraging ants, ants that performed learning walks and ants that were
112
released after contributing to unrelated experiments that were recorded with Differential
113
GPS over two years (Fig. 2, top row centre panel and Fig. S1; for details see Narendra et al.,
114
2013). In brief, coloured flag pins were placed on the ground approximately 20 cm behind a
115
walking ant at fairly regular intervals, carefully avoiding disturbing her progress. The resulting
116
pin trail was subsequently followed with the rover antenna of a Differential GPS system,
117
recording the position with an accuracy of better than 10 cm.
118 119
Data analysis
120
We recorded trackball rotations due to the intended translation of the ants at 275 fps, which
121
reflect the direction and speed of the ants’ intended movements. We present the
122
reconstructed paths, final bearings, changes in walking direction and path lengths for the first
123
5 min of recordings at the three displacement locations. With the exception of one ant at the
124
off-route location, all ants reached this criterion. We used the Matlab (MathWorks, Natick,
125
MA, USA) circular statistics toolbox (by Philipp Berens) to perform Rayleigh's test for
non-126
uniformity on directional data and Wilcoxon Rank Sum tests on differences between
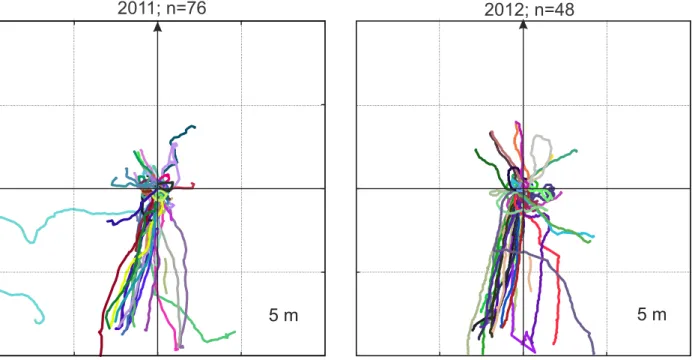
127
displacement locations using the ranksum function in Matlab. For comparisons between all
three locations we applied a Bonferroni correction with a resulting critical value for individual 129 tests of p=0.0167. 130 131 Agent-based modelling 132
Reconstructed world and ant views: We rendered panoramic views within a 3D model of the
133
ants’ natural environments that was previously reconstructed at the ANU Campus Field
134
Station using a laser scanner and camera-based methods (Stürzl et al., 2015). We
down-135
sampled the rendered views to 360×180 pixels, that is, 1°/pixel resolution to roughly match
136
the resolution of the ants’ compound eyes. Note that the 3D model was obtained 3 years
137
before the treadmill experiments were conducted, so that there will be some changes to the
138
landmark panorama, in particular involving the canopy, while all the major geometric
139
relationships of dominant visual features such as trees will have remained the same.
140
Memorised views and current familiarity: The agent is assumed to have stored a collection of
141
memorised views around the nest during learning walks and along their normal foraging route
142
(Fig. 1B). During tests, the agent is computing a value of visual familiarity at each time step by
143
comparing the current view to its memory bank. This is achieved by calculating the global root
144
mean squared pixel difference (Zeil et al., 2003) between the current view and each of the
145
views in the memory bank, and keeping the value of the lowest mismatch, as is typically done
146
in models and studies of ant navigation (Wystrach et al., 2011b; Wystrach et al., 2012;
147
Baddeley et al., 2011, 2012; Philippides et al., 2011; Narendra et al., 2013, Zeil et al., 2014,
148
Stürzl et al., 2015). Because high mismatch values indicate a large discrepancy between the
149
current and a memorized view, the value indicates the current unfamiliarity score rather than
150
a familiarity score. Note that in the insect brain, the activity of the mushroom body output
151
neurons (MBON) also correlate with unfamiliarity rather than familiarity (Owald et al., 2015;
152
Felsenberg et al., 2018). Importantly, views in this model are not rotated, but compared only
153
at the facing direction of the current and memorized views. That is, the agent does not need
154
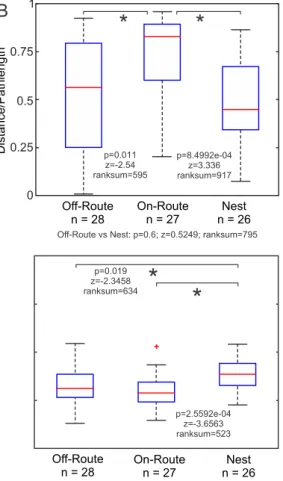
to stop and scan because only one view is compared for each step.
155
Combining attractive and repellent visual memories: The novel aspect of this current model
156
is that the agent is assumed to have two independent memory banks (Fig. 1B-D): one
157
containing attractive views and one containing repellent views. Both memory banks contain
views experienced during learning and foraging walks; the attractive memory bank containing
159
views that are assumed to have been memorised when the ants were oriented toward the
160
nest and the repellent memory bank those that have been memorised while looking away
161
from the nest. This is motivated by the very regular scanning movements of ants during their
162
learning walks where they alternate looking towards the nest and away from the nest
163
direction (Jayatilaka et al., 2018; Zeil and Fleischmann, 2019). For simplicity, learning walk
164
views were assumed to have been acquired within a 1 m radius around the nest and we chose
165
a 10 m long route, corresponding roughly with the foraging corridor of this particular nest
166
(see Fig. 2, top centre panel). Both nest-directed (attractive) learning walk views and views
167
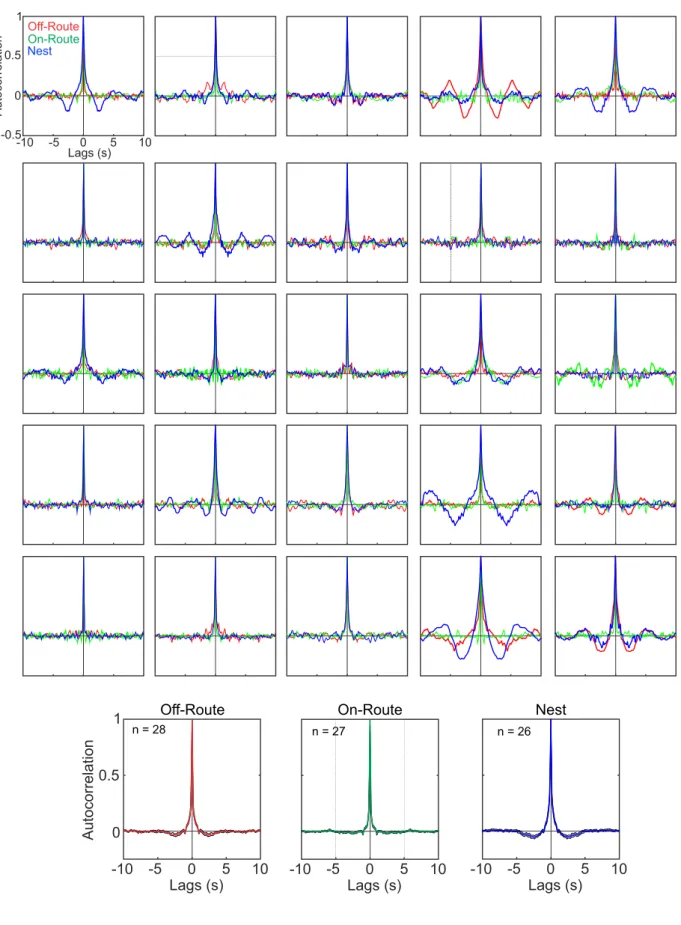
away from the nest (repellent) were taken from positions along a spiral rather than a circle
168
around the nest (Fig. 1B), to mimic the fact that successive learning walk loops reach
169
increasing distances from the nest (e.g. Fleischmann et al., 2016; Jayatilaka et al., 2018) and
170
to ensure that results at the nest were not dependent on having views memorised at the
171
exact same distance from the nest. We also included in the attractive memory bank views
172
that foragers experience when travelling back to the nest along their normal foraging corridor
173
(Fig. 1B).
174
Modelling procedure: At each time step, the agent computes two values of unfamiliarity: one
175
by comparing the current view to the attractive memory bank and one by comparing the same
176
current view to the repellent memory bank (Fig. 1C & D). These two unfamiliarity values are
177
assumed to have an antagonistic effect on the agent’s behaviour by turning it towards
178
attractive and away from repellent stimuli with the balance between the two drives
179
determining the agent’s turning direction. We modelled this by a simple subtraction resulting
180
in a raw overall drive
181
Raw overall drive = (attractive unfamiliarity value – repellent unfamiliarity value) / 0.2 (1)
182
We normalised the value of this drive by using always the same value (0.2 in our world),
183
corresponding roughly to the unfamiliarity score obtained between views from locations in
184
the virtual world that are far apart, so that Raw overall drive will be contained between -0.5
185
and 0.5. A negative value thus indicates that ‘attractive unfamiliarity’ < ‘repellent
186
unfamiliarity’. A positive value indicates that ‘attractive unfamiliarity’ > ‘repellent
187
unfamiliarity’. We then transform Raw overall drive into an Overall drive with values ranging
188
from 0 to 1 using a simple sigmoid function:
Overall drive = Sigmoid (Raw overall drive) (2)
190
As a result, the Overall drive tends towards 0 if ‘attractive unfamiliarity’ < ‘repellent
191
unfamiliarity’, towards 1 if ‘attractive unfamiliarity’ > ‘repellent unfamiliarity’ and is 0.5 if
192
‘attractive unfamiliarity’ = ‘repellent unfamiliarity’. In other words, a low score indicates that
193
the current view matches a view in the attractive memory bank better than in the repellent
194
memory bank and a high score indicates that the current view matches a view in the repellent
195
memory bank better than in the attractive memory bank (Fig. 1C).
196
To drive the agent, we used a similar approach to Kodzhabashev and Mangan (2015). The
197
agent is a simple dot in space (x,y) with a current heading (theta). The agent has a
198
continuously running oscillator alternating between left mode and right mode, which controls
199
the current turning direction. For simplicity, we modelled this by simply alternating the
200
turning direction at each time step (Left-Right-Left-Right) as in Kodzhabashev and Mangan
201
(2015). The resulting paths typically show sharp zigzags, however it is worth noting that
202
alternating turning direction every 4th step produces smoother oscillations that better
203
resemble real ant paths (Fig. 1E).
204
Turn direction is thus purely controlled by the oscillator, however, the Turn amplitude is
205
directly dependent on the current Overall drive (see previous section), that is, on the current
206
view familiarities.
207
Turn amplitude (deg) = gain × Overall drive (3)
208
We use a single parameter (gain) to convert the Overall drive (between 0 and 1) into the
209
angular value for the turn amplitude. We simply used gain = 180, so that the turning amplitude
210
would vary between 0 degrees (if Overall drive = 0) and 180 degrees (if Overall drive = 1), with
211
90 degrees if Overall drive = 0.5, that is if attractive and repellent unfamiliarity values are
212
equal.
213
Across time steps (n), the agent orientation (theta) will thus alternate between left and right
214
turns ((-1)n), with each turn varying between 0 and 180 degrees.
215
Theta(n+1) = Theta(n) + (Turn amplitude × (-1)n) + noise
To ensure that the agent is robust against the intrinsic noise of the real world, we added noise
217
at each time step, as a random angular value drawn from a Gaussian distribution (mu=0;
218
std=10 degrees).
219
Agent on a fictive tread-mill: We simulated agent behaviour on a fictive treadmill by simply
220
preventing forward motion. That is, at each time step we assumed that the agent (1) obtains
221
the current view and computes its Overall drive (Eqn 1 & 2); (2) turns on the spot with turn
222
direction determined by the state of the oscillator and turn amplitude by Eqn 3 & 4. Since the
223
location at which the agent is standing does not change, the view perceived at each time step
224
only varies depending on the agent’s current orientation. The agent on the tread mill was
225
tested at different release locations and we recorded the resulting behaviour.
226
Using attractive visual memories only: We also tested the agent using the attractive memory
227
bank only. In that case
228
Raw overall drive = attractive unfamiliarity/0.2 - 0.5.
229
Given that attractive unfamiliarity is always positive, we removed 0.5 during normalisation to
230
centre the Raw overall drive on 0, ranging roughly from -0.5 to 0.5 in the same way as when
231
combining attractive and repellent memories. We then used the same sigmoid function to
232
obtain an Overall drive between 0 and 1 (Eqn 2).
233 234
Results
235
Myrmecia ants released on the tread-mill
236
Irrespective of whether they were caught in a zero-vector state (ZV) or a full-vector state (FV),
237
tethered ants behaved differently when placed 6.5 m west of the nest (off-route, Fig. 2, top
238
left panel), 6.5 m south of the nest (on-route, Fig. 2, bottom middle panel) or over the nest
239
(Nest, Fig. 2, top right panel).
240
In the off-route and on-route locations, most intended paths of both ZV and FV ants were goal
241
directed either to the nest or to the individuals’ specific foraging trees (see inset circular
242
histograms in Fig. 2). This is to be expected for M. croslandi foragers, which ignore path
243
integration information in the FV state as long as the landmark panorama provides
navigational information (see Narendra et al., 2013; Zeil et al., 2014). The paths tended to be
245
straight (see Fig. 3D). In contrast, over the nest, ZV ants moved in random directions, while
246
FV ants tended to move roughly along the home vector direction to the north (at 90o Fig 2,
247
black tracks, top right panel, see also Fig. 3B). Both ZV and FV ants at the nest changed their
248
walking direction frequently. Inset histograms show that most tethered ants over the nest
249
ended up after 5 minutes at final virtual distances less than 10 m from the nest (median 6.07
250
m), while at the on-route location, most ants reached much larger virtual distances (median
251
12.61 m) in the same amount of time (Wilcoxson Rank Sum test: nest vs on-route distances
252
are different: p = 0.0045; z = 2.8378. See Fig. S2A). The median distances reached at the
off-253
route location are not larger than the ones at the nest (median 6.2 m), owing to a conspicuous
254
peak at small distances contributed by ants that were lost at this location.
255
The behaviour of ants at the off-route location is interesting primarily because most ants are
256
home directed despite it being unlikely that they have ever been to this location before (see
257
inset circular histogram, Fig. 2, top row left panel). A heat map of the foraging movements of
258
124 ants from this nest that had been DGPS-tracked on their outward foraging trips over two
259
years shows that no ant had moved off-route of the nest for more than a few meters (Fig. 2,
260
top row middle panel). Some of the tethered ants appear to have headed towards their
261
foraging trees or the foraging corridor in south-easterly direction, however, when we track
262
ants that were released just north of the off-route location, many initially for 2 m or so do
263
walk in a south-easterly direction before turning east toward the nest (Fig. 2, bottom row, left
264
panel). Tethered ants at the off-route location must therefore get their bearing by comparing
265
what they currently see with nest-directed views they are likely to have gathered during their
266
learning walks, which can extend up to 4 m from the nest (Fig. 2, bottom right panel. See also
267
Jayatilaka et al., 2018).
268
Both FV and ZV ants at the on-route location decided to move either back toward the nest or
269
south toward their foraging trees (Fig. 2, bottom row, centre panel). Otherwise, they moved
270
in a similar way than when at the off-route location. Most of them moved fast, straight and
271
for distances far exceeding those needed to reach the nest or the trees.
272
The most conspicuous feature of paths at the nest location is the fact that the initial walking
273
direction of ZV ants is random, while those of FV ants is in the general home vector direction
274
(north) and that both ZV and FV ants change walking direction frequently.
We quantify these differences between locations in three ways in Fig. 3, considering final
276
bearings, the relationship between path length and distance reached and changes in walking
277
direction. Fig. 3A shows the initial paths of ants at the three locations in more detail to
278
emphasize the different behaviours and to highlight the additional fact that paths are fairly
279
smooth at the off-route and on-route locations, but show a distinct sinusoidal oscillation at
280
the nest location. With the exception of the bearings of ZV ants at the nest (Fig. 3C right panel)
281
and those of FV ants after 5 min at the off-route and the nest location (Fig. 3C left and right
282
panel) the virtual bearings of ants after 5 minutes or at 5 m distance from the start are all
283
significantly different from uniform distributions, both for ZV (Fig. 3B) and FV ants (Fig. 3C).
284
While the distributions are unimodal for the off-route and nest location (see insets Fig. 3B
285
and C for circular statistics), they are clearly bimodal at the on-route location.
286
One measure of the straightness of paths is the way in which the straight-line distance from
287
the start depends on path length (Fig. 3D), with straight paths without changes in direction
288
lying close to the line of equality. After 5 minutes, the distribution of the ratios of final
289
distance to final path length differs between the sites (see insets in Fig. 3D and Fig. S2B) with
290
the on-route paths being significantly straighter with a median ratio of distance over path
291
length of 0.83, compared with 0.62 at the off-route location and of 0.45 at the nest location
292
(Wilcoxon Rank Sum test at 5% significance level: On-route vs off-route: p=0.0110; on-route
293
vs nest: p=8.4992e-4; off-route vs nest: p = 0.6. See Fig. S2B).
294
Finally, the behaviour of ants at the three sites also differs on a finer scale: the distribution of
295
changes in path direction is much broader at the nest site, compared to the off-route and
on-296
route location (Fig. 3E) reflecting the conspicuous oscillations of ant paths over the nest (see
297
right panel, Fig. 3A). Note that these distributions have very long tails due to spikes of very
298
high angular velocities which may be artefacts of trackball rotations when the ants are moving
299
very slowly (see time series in Fig. 4). To test whether changes in path direction are indeed
300
systematically larger at the nest location, we calculated the means of their absolute values at
301
11fps over the first 5 min of walking for each ant and compared their distributions, both for
302
angular velocities smaller than 200o/s (insets Fig. 3E and Fig. S2C) and for all angular velocities
303
(Fig. S2D). Below 200o/s, nest paths are indeed wigglier compared to on-route paths (Fig. S2C,
304
Wilcoxon Rank Sum test: nest vs on-route p=2.56e-4, z=-3.6563), with the difference between
305
nest and off-route location just failing to reach significance (nest vs off-route p=0.019,
2.3458). Considering the whole range of angular velocities (Fig. S2D) there is no difference
307
between nest and the other locations, mainly because of high angular velocities exhibited by
308
ants at all sites.
309
We note that many ants at various times during the first 5 minutes on the trackball over the
310
nest show very regular path oscillations as documented in Fig. 3A and for three examples in
311
Fig. 4 (red traces). The distribution and the time course of changes in path direction over the
312
nest are different from those exhibited by the same ants at the on-route location (shown in
313
blue in Fig. 4). Regular and sustained path oscillations lead to periodicities in the
auto-314
correlation function of changes in path direction and can be detected in 13 out of 25 cases of
315
ants participating in all three locations (blue traces in Fig. S3), compared to 4/25 at the
off-316
route location (red traces in Fig. S3) and 1/25 at the on-route location (green traces in Fig.
317
S3). We add the caveat that the statistics of path properties are unlikely to be stationary
318
during an experiment and that this particular aspect of ant behaviour will require future
319 attention. 320 321 Agent-based modelling 322
To model the agent on a fictive tread-mill, we simply prevented it from stepping forward, so
323
that views were always perceived from the same spot, and where rotated according to the
324
agent’s current facing direction. We released the agent at four locations.
325
When tested close to the beginning of the homing route (on-route RP), the agent oriented
326
mostly in the correct direction, that is, along the route towards the nest (blue paths in Fig.
327
5A). This is because the overall drive is close to 0 while facing in this direction (the attractive
328
unfamiliarity is very low and the repellent unfamiliarity is high (Fig. 1C) yielding very small
329
turns (Fig. 5B & C). Note that if the agent happened to face in the opposite direction (due to
330
noise), the overall drive would strongly increase and thus trigger a large turn.
331
When released away from the route (off-route RP), the agent also favoured one direction
332
indicating that this direction provided a smaller overall drive (yellow paths in Fig. 5A). This is
333
an indication that the view at the off-route RP and nest-directed learning walk views are most
familiar because their comparison produces a detectable minimum of the rotIDF and that the
335
agent thus favours a direction roughly pointing towards the nest.
336
When released on top of the nest (nest RP), the agent produced convoluted paths with no
337
preferred directions (red paths in Fig. 5A). This is due to the rather uniform distribution of
338
visual familiarities across directions (see Fig. 1C). At a more local scale, the paths show much
339
larger turn amplitudes than at the on-route or off-route RPs (Fig. 5B & C). This is because at
340
the nest location, attractive and repellent memorised views provide a roughly equal match
341
whatever the current facing direction, resulting in an overall drive around 0.5, thus yielding
342
turns that are larger than when attractive and repellent memories match best for different
343
directions (see Fig. 1C).
344
When released at a distant unfamiliar location (distant RP), the agent displayed equally large
345
turn amplitudes as at the nest (marked in black in Fig. 5A-C) because, as for the nest location,
346
both the attractive and the repellent memory bank provide roughly equal unfamiliarity
347
values, thus resulting in an average overall drive around 0.5.
348
In contrast, when using the attractive memory bank only, turn amplitudes were large at the
349
distant unfamiliar location (black) but comparatively low at the nest (red, right column, Fig.
350
5). This is simply because the unfamiliarity value is high in the unfamiliar location (yielding a
351
strong directional drive and thus large turns), and low at the nest due to the good match with
352
learning walks views (yielding a low directional drive and thus small turns).
353 354
Testing model-predictions with Myrmecia
355
Motivated by the different simulation results when using ‘attractive only’ and
356
‘attractive/repellent’ memory banks as well as by the rather counter-intuitive outcome that
357
the use of ‘attractive/repellent’ memories predicts a similar behaviour at the familiar nest
358
location and at a completely unfamiliar location, we released Myrmecia ants mounted on the
359
trackball both at the nest and at a distant location about 50 m south-west of the nest. The
360
location was far beyond the ants’ foraging trees and thus was likely to be completely
361
unfamiliar to the ants. Strikingly, ants at this distant release location behaved in a similar way
362
as at the nest, both in terms of the ratio between the distance reached after 5 minutes and
the path length (see box plot insets in Fig. 6A centre panels, Wilcoxon Rank Sum test
364
unfamiliar vs nest location: p=0.7984, ranksum=71) and in terms of the mean absolute
365
changes in walking direction (see box plot insets in Fig. 6A right panels, Wilcoxon Rank Sum
366
testunfamiliar vs nest location: p=0.9591, ranksum=67). The ants at both the unfamiliar and
367
the nest site also displayed the characteristic path oscillations we observed at the nest in our
368
previous experiments (Fig. 6A and B, compare with Fig. 4), as predicted by the
369 attractive/repellent model. 370 371
Discussion
372Our behavioural experiments revealed three fundamental properties of visual navigation in
373
ants that could only be uncovered using the trackball method. First, we determine that
374
whether on-route or off-route, several metres away from the nest, ants can recover the goal
375
direction without the need to physically move and to sample neighbouring locations. Second,
376
we find no evidence that they ‘expect’ outcomes from their behaviour, such as a changing
377
visual scene or increasing certainty about the location of the nest. M. croslandi ants show no
378
evidence of monitoring the distance that separates them from the goal, unlike for instance
379
ants that rely strongly on path integration (Dahmen et al., 2017). Third, ants behave
380
differently when positioned above the nest, by following random heading directions and
381
frequently changing their walking direction. These are the characteristics of search behaviour
382
and thus could be interpreted as indicating that ants ‘know’ that they are at the nest, as if
383
they possessed location information. However, our simulation results demonstrate that the
384
nest-specific behaviour of ants can be parsimoniously explained by the density of attractive,
385
nest-directed, and repellent views away from the nest that at least M. croslandi ants are likely
386
to acquire in the course of systematic scanning movements during their learning walks (e.g.
387
Jayatilaka et al., 2018). Our simulation also confirms that the same parsimonious mechanism
388
can recover a correct direction from on- and off-route locations, as previous modelling has
389
indicated (Baddeley et al., 2011, 2012; Narendra et al., 2013; Wystrach et al., 2013;
390
Kodzhabashev and Mangan, 2015).
391 392
Alignment matching and visual memories
393
Current thinking holds that ants during their learning walks learn nest-directed views
394
(Cataglyphis sp: Fleischmann et al., 2016, 2017, 2018a,b; Ocymyrmex robustior: Müller and
395
Wehner, 2010; Melophorus bagoti: Wehner et al., 2004; Muser et al., 2005) and possibly both
396
nest-directed views and views pointing away from the nest (Myrmecia croslandi: Jayatilaka et
397
al., 2018; Zeil and Fleischmann, 2019). In addition, they memorize the views they experience
398
along routes as they go back and forth on foraging excursions (Wehner et al., 1996; Mangan
399
and Webb, 2012; Kohler and Wehner, 2005; Wystrach et al., 2010; Freas and Specht, 2019).
400
When using their visual memories to navigate, the currently perceived panorama provides a
401
heading direction if the comparison between memorised views and the current view
402
generates a detectable minimum of the rotational image difference function (see Narendra
403
et al., 2013). This is a basic measure of familiarity and at any location, the direction presenting
404
the most familiar view would provide the deepest (lowest) minimum. At both the on-route
405
and off-route location ants on the trackball were free to scan the panorama and detect the
406
direction of any present minima. Our results show that they were successfully able to recover
407
the goal direction by doing so (Fig. 2). On route, some ants headed to the nest while others
408
aimed at their foraging trees, reflecting their motivation to home or to forage.
409
While the directedness of ants at the on-route site would have been supported by both
410
learning walk views and views learnt along the route, their directedness at the off-route
411
(west) location depends on their detecting a higher similarity with learning walk views
412
directed at the nest from the west compared to all other nest-directed views. As shown here
413
and before (Narendra et al., 2013; Zeil et al., 2014; Stürzl et al., 2015), this is possible up to
414
10-15m distance from the nest in the open woodland habitats of Myrmecia ants, provided
415
ants have acquired such nest-directed views about 1 to 5 metres away from the nest (see Fig.
416
2B, bottom right).
417
When released at the nest, ants behaved differently. They walked in various directions and
418
displayed larger turns that regularly alternated between left and right, resulting in sinusoidal
419
paths. So are nest views special?
420
As far as navigational information is concerned, the situation at the nest is indeed different
421
compared with both on- and off-route sites. During their learning walks ants will have
encountered a dense set of views at different distances and compass bearings around the
423
nest, each potentially tagged with the nest direction through path integration (Müller and
424
Wehner, 2010; Graham et al., 2010; Baddeley et al., 2012; Fleischmann et al., 2018a;
425
Jayatilaka et al., 2018; Zeil and Fleischmann, 2019). In contrast to other locations, tethered
426
ants placed above the nest location thus will encounter attractive familiar views (or deep
427
rotIDF minima) in many compass directions, which might explain why they initially walked in
428
various directions at this location.
429
The high amplitude oscillation displayed by ants at the nest location, however, is puzzling.
430
Previous models suggest that experiencing a familiar (attractive) view should inhibit turns and
431
favour forward motion (Zeil, 2012; Möller, 2012; Baddeley et al., 2011, 2012; Wystrach et al.,
432
2013; Kodzhabashev and Mangan, 2015; Ardin et al., 2016), which is here clearly not the case.
433
The behaviour of tethered ants on top of the nest can be interpreted as search for the nest
434
entrance, which in ants relying on path integration is characterized by frequent changes in
435
path direction and a systematic pattern of increasing loops around the expected location of
436
the goal (e.g. Schultheiss et al., 2015). To our knowledge, however, no analysis of the
fine-437
scale changes in orientation of searching ants – as we observed them here - has been done
438
to date.
439
Previous work has suggested that the recognition of views memorised at the nest may trigger
440
specific behaviours when subsequently released in unfamiliar locations (Wystrach et al.,
441
2013). This interpretation may suggest positional knowledge, or at least that views close to
442
the nest are categorised separately from route views during learning and being treated
443
differently when recognised. In the following we discuss the results of our simulation that
444
suggest a parsimonious and unifying explanation for view-based route guidance, pinpointing
445
goals and the current observation of high amplitude oscillation at the nest without the need
446
to invoke positional knowledge or the need for a ‘trigger’ of search behaviour. Our
agent-447
based modelling exhibits the same pattern of fine-scale oscillations, including overall changes
448
in path direction, but only if we assume that the agent operates with both attractive and
449
repellent memory banks.
450 451
Continuously integrating attractive and repellent views
Our model was developed quite independently to explain other recently observed
453
phenomena, such as how ants manage to use views for guidance while walking backward and
454
thus facing in the anti-nest direction (Schwarz et al., under review); or how ants learn to
455
detour areas along their route associated with an aversive experience (Wystrach et al., 2019).
456
Interestingly, this new model happens to also capture the current results remarkably well.
457
The model is based on two assumptions: (1) that ants store both attractive and repellent
458
views during their learning walks as suggested by Jayatilaka et al. (2018), and (2) that guidance
459
involves an oscillator resulting in a continuous alternation between left and right turns
460
(Namiki and Kanzaki, 2016; Kodzhabashev and Mangan, 2015; Wystrach et al., 2016). The
461
model assumes no positional knowledge whatsoever, only procedural knowledge.
462
Several pieces of evidence suggest that insects possess an intrinsic oscillator triggering
463
alternatively left and right body rotations, the amplitude of which can be modulated by the
464
stimuli perceived (Namiki and Kanzaki, 2016; Lent et al., 2013; Wystrach et al., 2016). Such a
465
control of oscillations can provide guidance along odour plumes (Namiki and Kanzaki, 2016)
466
and odour gradients (Wystrach et al., 2016), support visual route following (Kodzhabashev
467
and Mangan, 2015) and greatly facilitates the integration of different sources of stimulation
468
(Wystrach et al., 2016). In the case of visual route following, the amplitude of the oscillations
469
needs to be simply modulated by the familiarity of the currently perceived view. The
470
suggestion is that familiar views trigger small turns whereas unfamiliar views trigger large
471
turns, and that the direction of the turn is dependent on the current state of the oscillator.
472
Because views are assumed to be memorized while moving along the route, during route
473
recapitulation visual familiarity is higher when facing in the correct route direction. This model
474
is sufficient for an agent to recapitulate a route in naturalistic environments (Kodzhabashev
475
and Mangan, 2015). However, when released at the nest, this model does not predict large
476
amplitude oscillations such as the ones we observed here in ants. On the contrary, because
477
of the high familiarity experienced at the nest, which results from the collection of
nest-478
oriented views acquired during learning walks, the model predicts an inhibition of the
479
oscillations whatever the current facing direction (see Fig 5, right column).
480
The visual memories used by insect navigators are likely stored in the mushroom bodies
481
(Webb and Wystrach, 2016), but current models assume only the existence of attractive
482
memories (Möller, 2012; Baddeley et al., 2011, 2012; Wystrach et al., 2013; Kodzhabashev
and Mangan, 2015; Ardin et al., 2016). Here we incorporated into the model the recent
484
suggestion that ants store both attractive and repellent views, mimicking the so-called
485
'appetitive/aversive' output pathways from the insect mushroom bodies (e.g. Owald et al.,
486
2015; Saumweber et al., 2018) (Fig. 1D). Indeed, during their learning walks, many ants, not
487
only Myrmecia croslandi (Jayatilaka et al., 2018) display regular head and body oscillations,
488
facing alternatively towards and away from the nest (Zeil and Fleischmann, 2019). We
489
assumed in our model that these views form two distinct memory banks: one holding
490
‘attractive’, nest-directed, views and one holding ‘repellent’ views pointing away from the
491
nest, and that both sets are used continuously and simultaneously during homing. Our agent
492
compares the current view to both sets of memories at each time step and thus obtains two
493
familiarity values, one for attraction (high familiarity, inhibiting turns) and one for repulsion
494
(high familiarity, triggering large turning amplitudes). Given that both memory pathways have
495
antagonist outcomes, they can be simply integrated by subtracting attractive and repellent
496
familiarity values, resulting in what we called here an ‘overall drive’ which modulates the
497
amplitude of the oscillator (Fig. 1C).
498
Interestingly, this model closely mimics ant behaviour as documented in our behavioural
499
experiments. If released on a fictive tread-mill (preventing the agent from translating) it
500
displays high amplitude turns when released on top of the nest, and much lower amplitude
501
turns when released further along the homing route. In contrast, when using the ‘attractive’
502
memory bank only, the agent produces low amplitude turns at the nest (Fig 5).
503
The behaviour of the agent when combining attractive and repellent views is straightforward
504
to explain (Fig. 1C). At the route release point, facing in the correct direction the simulation
505
generates very small turns because only the attractive memory bank provides a good match.
506
By integrating this with a high unfamiliarity of the repellent memory bank, we obtain a very
507
low overall drive, and thus small turns. However, when released at the nest, whatever the
508
direction the agent faces, there are always both attractive and repellent views that are
509
matching the current view (Fig. 1C). The reason being that these views, when acquired during
510
learning walks, are experienced in multiple compass direction at very closely spaced locations
511
(Fig. 1B). Both attractive and repellent pathways signal high familiarity values and cancel each
512
other out, resulting in large turns.
513 514
Testing the model’s prediction.
515
Interestingly, the attractive/repellent memory bank model makes a rather counterintuitive
516
prediction, because it relies on the relative difference in familiarities between attractive and
517
repellent pathways and not on the absolute familiarity experienced: the agent’s behaviour
518
should be similar when on top of the nest and at a completely unfamiliar location, outside the
519
catchment area of acquired views. At the nest, both attractive and repellent memories result
520
in high familiarity, so their signals cancel each other when integrated (attractive - repellent),
521
resulting in large turns. In completely unfamiliar terrain, both attractive and repellent
522
memories result in very low familiarity, and thus their signals equally cancel each other when
523
integrated (attractive - repellent), resulting also in large turns (Fig. 1C).
524
As predicted by the model, experiments showed indeed that ants tethered at a completely
525
unfamiliar location exhibit a very similar behaviour to when released on top of the nest: that
526
is, they displayed regular high amplitude path oscillations (Fig. 6).
527 528
Integration with path integration.
529
We did not incorporate integration of path integration information and landmark panorama
530
guidance in our model and so do not at this stage tackle the fact that full vector ants (i.e.,
531
those captured with a remaining path integration home vector) showed a small bias towards
532
the home vector direction at the nest location (Fig. 2 & 3, FV vs ZV ants). In M. croslandi
533
foragers, as in other ants, path integration information and scene information are integrated
534
(Collett et al., 2001; Collett, 2012; Reid et al., 2013 ; Legge et al., 2012; Narendra et al., 2013;
535
Wystrach et al., 2015; Wehner et al., 2016) with familiar views more strongly weighted – to
536
the degree that a current view providing information on heading direction can completely
537
override conflicting information from path integration (Kohler and Wehner, 2005; Narendra
538
et al., 2013; Zeil et al., 2014). In ants that rely heavily on path integration, this information is
539
more strongly weighted as the length of the vector increases (Wystrach et al., 2015; Wystrach
540
et al., 2019). The bias towards the home vector direction observed here in FV ants fits this
541
current view, which is summarised in a recent model (Hoinville and Wehner, 2018). Also,
542
experienced ants seem to rely less on path integration than naïve ants, and rather display a
search when on unfamiliar terrain (Schwarz et al., 2017), which may explain why path
544
integration information is never strongly weighted in the long-lived M. croslandi.
545 546
Outlook
547
Our results may contribute to the lingering debate about the format of spatial knowledge
548
underlying visual navigation in insects and animals in general (see for instance, Cheeseman et
549
al., 2014a,b and Cheung et al., 2014; Warren, 2019). We showed that ants released on top of
550
the nest displayed large turns. These results were clearly at odds with the current ‘procedural’
551
models, stipulating that the high familiarity of views at the nest should inhibit turns. In
552
contrast, the ants’ behaviour suggested that they could derive positional knowledge from the
553
current views, given the interpretation that the ants searched because they recognised that
554
they were at the nest. Previous results, such as the apparent ability of insects to make
555
shortcuts also favoured explanations assuming ‘positional’ rather than ‘procedural’
556
knowledge (e.g. Cheeseman et al., 2014a,b; Warren, 2019). However, as often in the insect
557
literature (Cartwright and Collett, 1983; Collett et al., 2007; Cruse and Wehner, 2010;
558
Wystrach and Graham, 2012; Narendra et al., 2013; Cheung et al., 2014), an alternative, more
559
parsimonious explanation can also explain our results: ants may simply combine attractive
560
and repellent memories. Importantly, this procedural explanation did not come from actively
561
seeking for it, but emerged from other observations, such as the way in which ants behave
562
when learning views around the nest (Jayatilaka et al., 2018), avoid adverse situations
563
(Wystrach et al., 2019), steer while walking backwards (Schwarz et al., 2017; Schwarz et al.,
564
under review) as well as how appetitive and aversive memory pathways are combined in
565
other insects such as flies (Felsenberg et al., 2018) and fly larvae (Eichler et al., 2017).
566
Our simulation made the unexpected prediction that behaviour in completely unfamiliar
567
terrain should be the same as at the very familiar nest, which we confirmed by subsequent
568
experimentation. Purely scene familiarity-based modelling replicates these results with
569
astonishing detail, providing support for the suggestion that ants during their learning walks,
570
acquire both attractive, nest-directed views and repellent views when pointing away from the
571
nest during systematic scanning movements (Jayatilaka et al., 2018; Zeil and Fleischmann,
2019). It is not clear at present, however, whether all views are memorized irrespective of
573
gaze direction or only when the ants’ head is aligned parallel to the home vector (see
574
discussion in Jayatilaka et al., 2018). We show here, at least, that the distinctly different
575
behaviour of ants over the nest location can be replicated if an agent has an attractive and a
576
repellent scene memory bank.
577
The most parsimonious explanation for our observations is therefore that the ants operate
578
on ‘procedural’ rather than ‘location’ information (sensu Collett et al., 2002; Wehner et al.,
579
2006; Graham and Philippides, 2017): at both familiar and unfamiliar locations away from the
580
nest they may know where to go, but they do not know where they are. Moreover, the main
581
assumptions of our simulation - attractive and repellent view comparison driving an oscillator
582
- can be tested by a detailed comparison of the gaze and path directions of individually
583
identified ants during their learning walks and during their subsequent approach to the nest,
584
when returning from foraging excursions. Such an analysis may also reveal how ants
585
eventually pinpoint the nest entrance, which none of the current homing models can properly
586 explain. 587 588
Acknowledgements
589We thank Chloé Raderschall and Piyankarie Jayatilaka for tracking ants over the years, Camile
590
Moray, Fiorella Ramirez-Esquivel and Moosarreza Zahedi for help with field work and the
591
mechanical workshop of the Research School of Biology for constructing the housing for the
592
trackball contraption. We are grateful to Marijke Welvaert and Teresa Neeman from the ANU
593
Statistical Consulting Unit for their advice.
594
Competing interests
595
No competing interests declared.
596
Funding
597
We acknowledge financial support from the Australian Research Council, Discovery Project
598
Grant (DP150101172), Future Fellowship (FT140100221), the Hermon Slade Foundation (HSF
10/7), the ANU Endowment Fund and the European Research Council (ERCstg: EMERG-ANT 600 759817). 601
Data availability
602Upon acceptance, data will be made available through FigShare. Requests for further
603
information and for original video footage should be directed to and will be fulfilled by the
604
corresponding author, Trevor Murray. Requests for the python code for the model should be
605
directed to Antoine Wystrach.
References
607
Baddeley, B., Graham, P., Philippides, A., and Husbands, P. (2011). Holistic visual encoding
608
of ant-like routes: navigation without waypoints. Adaptive Behav. 19, 3–15.
609
Baddeley, B., Graham, P., Husbands, P., and Philippides, A. (2012). A model of ant route
610
navigation driven by scene familiarity. PLoS Comp. Biol. 8, e1002336.
611
Baerends, G.P. (1941). Fortpflanzungsverhalten und Orientierung der Grabwespe
612
Ammophilia campestris. Jur. Tijdschrift voor Entomologie 84, 68–275.
613
Cheeseman, J. F., Millar, C. D., Greggers, U., Lehmann, K., Pawley, M. D. M., Gallistel, C.
614
R.,Warman, G. R., and Menzel, R. (2014a). Way-finding in displaced clock-shifted bees
615
proves bees use a cognitive map. Proc. Natl Acad. Sci. USA 111, 8949-8954.
616
Cheeseman, J.F., Millar, C.D., Greggers, U., Lehmann, K., Pawley, M.D.M., Gallistel, C.R.,
617
Warman, G.R., and Menzel, R. (2014b). Reply to Cheung et al.: the cognitive map
618
hypothesis remains the best interpretation of the data in honeybee navigation. Proc. Nat.
619
Acad. Sci. USA 111, E4398.
620
Cheung, A., Collett, M., Collett, T.S., Dewar, A., Dyer, F.C., Graham, P., Mangan, M.,
621
Narendra, A., Philippides, A., Stürzl, W., Webb, B., Wystrach, A., and Zeil, J. (2014). Still
622
no convincing evidence for cognitive map use by honeybees. Proc. Nat. Acad. Sci. USA
623
111, E4396-E4397.
624
Collett, M. (2012). How navigational guidance systems are combined in a desert ant. Curr.
625
Biol. 22, 927-932.
626
Collett, T.S., and Zeil, J. (1998). Places and landmarks: an arthropod perspective. In Spatial
627
representation in animals (ed. S. Healy), pp. 18–53. Oxford, UK: Oxford University Press.
628
Collett, M., Chittka, L., and Collett, T. S. (2013). Spatial memory in insect navigation. Curr.
629
Biol. 23, R789-R800.
630
Collett, M., Harland, D., and Collett, M. (2002). The use of landmarks and panoramic context
631
in the performance of local vectors by navigating honeybees. J. Exp. Biol. 205, 807-814.
Collett, T.S., Collett, M., and Wehner, R. (2001). The guidance of desert ants by extended
633
landmarks. J. Exp. Biol. 204, 1635–1639.
634
Collett, T. S., Graham, P., and Harris, R.A. (2007). Novel landmark-guided routes in ants. J.
635
Exp. Biol. 210, 2025-2032.
636
Cruse, H., and Wehner, R. (2011). No need for a cognitive map: decentralized memory for
637
insect navigation." PLoS Comp. Biol. 7, e1002009.
638
Dahmen, H.J., Wahl, V.L., Pfeffer, S.E., Mallot, H.A., and Wittlinger, M. (2017).Naturalistic
639
path integration of Cataglyphis desert ants on an air-cushioned light weight spherical
640
treadmill.J. Exp. Biol. 220, 634-644.
641
Eichler, K., Li, F., Litwin-Kumar, A., Park, Y., Andrade, I., Schneider-Mizell, C.M., Saumweber,
642
T., Huser, A., Eschbach, C., Gerber, B., Fetter, R.D., Truman, J.W., Priebe, C.E., Abbott,
643
L.F., Thum, A.S., Zlatic, M., and Cardona, A. (2017). The complete connectome of a
644
learning and memory centre in an insect brain. Nature 548, 175-182.
645
Felsenberg, J., Jacob, P.F., Walker, T., Barnstedt, O., Edmondson-Stait, A.J., Pleijzier, M.W.,
646
Otto, N., Schlegel, P., Sharifi, N., Perisse, E., Smith, C.S., Lauritzen, J.S., Costa, M.,
647
Jefferis, G.S.X.E., Bock, D.D., and Waddell, S. (2018). Integration of parallel opposing
648
memories underlies memory extinction. Cell 175, 709-722.
649
Fleischmann, P.N., Christian, M., Müller, V.L., Rössler, W., and Wehner, R. (2016). Ontogeny
650
of learning walks and the acquisition of landmark information in desert ants Cataglyphis
651
fortis. J. Exp. Biol. 219, 3137-3145.
652
Fleischmann, P.N., Grob, R., Wehner, R., and Rössler, W. (2017). Species-specific differences
653
in the fine structure of learning walk elements in Cataglyphis ants. J. Exp. Biol. 220,
2426-654
2435.
655
Fleischmann, P.N., Grob, R., Müller, V.L., Wehner, R., and Rössler, W. (2018a). The
656
geomagnetic field Is a compass cue in Cataglyphis ant navigation. Curr. Biol. 28,
1440-657
1444.
Fleischmann, P.N., Rössler, W., and Wehner, R. (2018b). Early foraging life: spatial and
659
temporal aspects of landmark learning in the ant Cataglyphis noda. J. Comp. Physiol. A
660
204, 579–592.
661
Freas, C.A., and Spetch, M.L. (2019). Terrestrial cue learning and retention during the
662
outbound and inbound foraging trip in the desert ant, Cataglyphis velox. J. Comp. Physiol.
663
A 205, 177–189.
664
Graham, P., and Cheng, K. (2009). Ants use the panoramic skyline as a visual cue during
665
navigation. Curr. Biol. 19, R935–R937.
666
Graham, P., and Philippides, A. (2017). Vision for navigation: What can we learn from ants?
667
Arthropod Struct. & Dev. 46, 718-722.
668
Graham, P., Philippides, A., and Baddeley, B. (2010). Animal cognition: multimodal
669
interactions in ant learning. Curr. Biol. 20, R639–R640.
670
Hoinville, T. and Wehner, R. (2018). Optimal multiguidance integration in insect navigation.
671
Proc. Natl. Acad. Sci. USA 115, 2824-2829.
672
Jayatilaka, P., Murray, T., Narendra, A., and Zeil, J. (2018). The choreography of learning
673
walks in the Australian jack jumper ant Myrmecia croslandi. J. Exp. Biol.
674
doi/10.1242/jeb.185306
675
Jayatilaka, P., Raderschall, A. C., Narendra, A., and Zeil, J. (2014). Individual foraging patterns
676
of the jack jumper ant Myrmecia croslandi (Hymenoptera: Formicidae). Myrmecol. News
677
19, 75-83.
678
Jayatilaka, P., Narendra, A., Reid, F.S., Cooper, P., and Zeil, J. (2011). Different effects of
679
temperature on foraging activity schedules in sympatric Myrmecia ants. J. Exp. Biol. 214,
680
2730-2738.
681
Kodzhabashev, A., and Mangan, M. (2015). Route following without scanning. In Biomimetic
682
and Biohybrid Systems (ed . S.P. Wilson, P.F.M.J. Verschure, A. Mura and T.J. Prescott),
683
pp. 199–210. Lecture Notes in Artificial Intelligence 9222. Heidelberg, Berlin, New York:
684
Springer Verlag.
Kohler, M., and Wehner, R. (2005). Idiosyncratic route-based memories in desert ants,
686
Melophorus bagoti: How do they interact with path-integration vectors? Neurobiol.
687
Learning and Memory 83: 1–12
688
Mangan, M., and Webb, B. (2012). Spontaneous formation of multiple routes in individual
689
desert ants (Cataglyphis velox). Behav. Ecol. 23, 944–954.
690
Möller, R. (2012). A model of ant navigation based on visual prediction. J. Theo. Biol. 305,
691
118–130.
692
Müller, M., and Wehner, R. (2010). Path integration provides a scaffold for landmark learning
693
in desert ants. Curr. Biol. 20, 1368–1371.
694
Murray, T., and Zeil, J. (2017). Quantifying navigational information: The catchment volumes
695
of panoramic snapshots in outdoor scenes. PLoS ONE 12, e0187226.
696
Muser, B., Sommer, S., Wolf, H., and Wehner, R. (2005). Foraging ecology of the thermophilic
697
Australian desert ant Melophorus bagoti. Autr. J. Zool. 53, 301-311.
698
Namiki, S., and Kanzaki, R. (2016). The neurobiological basis of orientation in insects: insights
699
from the silkmoth mating dance.Curr. Opin. Insect Sci. 15, 16–26.
700
Narendra, A., Gourmaud, S., and Zeil, J. (2013). Mapping the navigational knowledge of
701
individually foraging ants Myrmecia croslandi. Proc. R. Soc. Lond. B 280, 20130683.
702
Owald, D., Felsenberg, J., Talbot, C.B., Das, G., Perisse, E., Huetteroth, W., and Waddell, S.
703
(2015). Activity of Defined Mushroom Body output neurons underlies learned olfactory
704
behavior in Drosophila. Neuron 86, 417–427.
705
Philippides, A., Baddeley, B., Cheng, K., and Graham, P. (2011). How might ants use
706
panoramic views for route navigation? J. Exp. Biol. 214, 445–451.
707
Saumweber, T., Rohwedder, A., Schleyer, M., Eichler K., Chen, Y-c., Aso, Y., Cardona, A.,
708
Eschbach, C., Kobler, O., Voigt, A., Durairaja, A., Mancini, N., Zlatic, M., Truman, J.W.,
709
Thum, A.S., and Gerber, B. (2018). Functional architecture of reward learning in
710
mushroom body extrinsic neurons of larval Drosophila. Nature Comm. 9, 1104.
711
Schultheiss, P., Cheng, K., and Reynold, A.M. (2015). Searching behavior in social
712
Hymenoptera. Learning and Motivation 50, 59–67.