HAL Id: hal-02267170
https://hal-enac.archives-ouvertes.fr/hal-02267170
Submitted on 19 Aug 2019
HAL is a multi-disciplinary open access
archive for the deposit and dissemination of
sci-entific research documents, whether they are
pub-lished or not. The documents may come from
teaching and research institutions in France or
abroad, or from public or private research centers.
L’archive ouverte pluridisciplinaire HAL, est
destinée au dépôt et à la diffusion de documents
scientifiques de niveau recherche, publiés ou non,
émanant des établissements d’enseignement et de
recherche français ou étrangers, des laboratoires
publics ou privés.
On the Use of Generative Adversarial Networks for
Aircraft Trajectory Generation and Atypical Approach
Detection
Gabriel Jarry, Nicolas Couellan, Daniel Delahaye
To cite this version:
Gabriel Jarry, Nicolas Couellan, Daniel Delahaye. On the Use of Generative Adversarial Networks
for Aircraft Trajectory Generation and Atypical Approach Detection. EIWAC 2019:, 6th ENRI
Inter-national Workshop on ATM/CNS, Oct 2019, Tokyo, Japan. pp 227-243 / ISBN 978-981-33-4668-0,
�10.1007/978-981-33-4669-7_13�. �hal-02267170�
№ 1396
On the Use of Generative Adversarial Networks for
Aircraft Trajectory Generation and Atypical
Approach Detection
Gabriel Jarry, Nicolas Couellan and Daniel Delahaye
EasyChair preprints are intended for rapid dissemination of research results and are integrated with the rest of EasyChair.
ENRI Int. Workshop on ATM/CNS. Tokyo, Japan. (EIWAC 2019)
[EN-A-5] On the use of Generative Adversarial
Networks for Aircraft Trajectory Generation and
Atypical Approach Detection
(EIWAC 2019)+
Gabriel Jarry
∗, Nicolas Couellan
∗†, and Daniel Delahaye
∗ ∗Ecole Nationale de l’Aviation Civile, Université de Toulouse
7 Avenue Edouard Belin, 31400 Toulouse, France
[jarry.gabriel | nicolas.couellan | daniel.delahaye]@enac.fr
†
Institut de Mathématiques de Toulouse, UMR 5219, Université de Toulouse
CNRS, UPS, F-31062 Toulouse Cedex 9, France
Abstract: Aircraft approach flight path safety management provides procedures that guide the aircraft to intercept the final approach axis and runway slope before landing. In order to detect atypical behavior, this paper explores the use of data generative models to learn real approach flight path probability distributions and identify flights that do not follow these distributions. Through the use of Generative Adversarial Networks (GAN), a GAN is first trained to learn real flight paths, generating new flights from learned distributions. Experiments show that the new generated flights follow realistic patterns. Unlike trajectories generated by physical models, the proposed technique, only based on past flight data, is able to account for external factors such as Air Traffic Control (ATC) orders, pilot behavior or meteorological phenomena. Next, the trained GAN is used to identify abnormal trajectories and compare the results with a clustering technique combined with a functional principal component analysis. The results show that reported non compliant trajectories are relevant.
Keywords: Anomaly Detection, Aircraft Trajectory Generation, Generative Adversarial Networks, Machine Learning, Flight Path Safety Management
1. INTRODUCTION
Accidents that occur during initial, intermediate and final approach until landing represent every year 47% of the total accidents, and 40% of fatalities. In nominal operations, ap-proach flight path safety management consists in procedures which guide the aircraft to intercept the final approach axis, and the runway slope with an expected configuration in order to land. Some abnormal flights are observed with deviations from procedures and operational documentation.
The International Air Transportation Association (IATA) forecasts a growth of air passengers worldwide from around 4 billion today, up to 7.8 billion in 2036. Consequently, the number of non-standard procedures will also increase if nothing is done to reduce their number. This kind of trajectory generates difficulties for both crew and Air Traffic Control (ATC) and may induce undesirable events such as Non-Compliant Approach and Non-Stabilized Approaches that can drive to ultimate events like Runway Excursion, Control Flight Into Terrain, and Loss of Control In Flight. Analyzing and gaining a better understanding of these pro-cedure deviations would be profitable for both air traffic managers and flight operators. Besides, generating realistic trajectories while data are not available can greatly benefit noise prediction simulation in the context of air traffic
growth, and in many other applications.
Anomaly Detection is a well-known problem, which has been investigated for a long time. It consists in finding samples from a data set that do not comply with the overall behavior. Among the various methods available, the Multiple Kernel Anomaly Detection (MKAD) [1] technique is one of the most efficient algorithms. It was developed to detect anomalies in heterogeneous data (i.e both discrete and continuous data), and has been used to detect anomalies in aircraft approach parameters from on-board data. Another kernel-based approach to study on-board aircraft parameters was detailed in [2]. Neural network auto-encoder reconstruc-tion error can also be used to detect abnormal behavior [3], [4]. Other anomaly detection techniques using information geometry and functional representation have also proven to be efficient. In her thesis [5], the author presents different Outlier Detection in Space Telemetries. In [6], functional principal component analysis is used to develop a local anomaly detection algorithm in aircraft landing trajectories. This paper details the work conducted around the gener-ation of trajectory and the detection of atypical trajectories using a novel machine learning technique called Genera-tive Adversarial Networks (GAN). GAN are recent neural network techniques that have already provided successful
results in various fields such as image or video generation [7], [8], image resolution enhancement [9], drug discovery [10], text-to-image synthesis [11] and many others. They enable learning the data distribution by solving a min-max optimization problem between a data generator and a data classifier. The data generator tries to generate realistic data while fooling the data classifier. The classifier tries to distinguish real data from generated data. Recently, GAN have also been applied to detect anomalies in imaging data [12].
In the specific field of trajectory generation with GAN, some work has already been conducted on learning and re-producing human motion behavior [13], on robot navigation [14], or on vehicle-to-vehicle-encounters [15]. However, to the best of the authors’ knowledge, no investigation has been carried out on applying these techniques to aircraft trajectory generation. This article aims at conducting experiments with GAN to generate realistic aircraft trajectories based on air-port approach and landing data. Classical trajectory genera-tion is based on the physical aircraft model whereas here, the generation is data driven and does not use aircraft and flights physics. It can, therefore, account for external factors that impact real trajectories such as Air Traffic Control (ATC) orders, pilot behavior or meteorological phenomena. Further investigations on the use of the GAN to detect abnormal trajectory patterns were carried out and compared with the results of a prior information geometry based approach.
After introducing the principles of GAN, the application of GAN to generate approach trajectories is shown and results are compared with other methods such as geometric information techniques. The second part of the paper is dedicated to the detection of abnormal or atypical trajectories using the distribution of data learned by the network. The relevance of the results is discussed with operational criteria and the performance of our algorithm in real operations is detailed.
2. GENERATIVE ADVERSARIAL NETWORKS (GAN)
GAN have recently attracted much interest in the machine learning community [7] [16]. These models have the ability to learn the distribution pd of input data and generate new
data according to the learned distribution. This is achieved through the use of a network that combines a generator G (usually a type of neural network) and a discriminator D (a classifier function). The generator G takes input noise vec-tors z from a low dimensional space so-called latent space, and generates new sample vectors in the data representation space. The discriminator D is trained on a given input data x to compute the probability of a sample being an input data rather than being generated by G. The process, that can be seen as a two player game is simultaneously repeated so that G minimizes log(1 − D(G(z)) (generated data that could not fool the discriminator), and D maximizes log(D(x))
Fig. 1. This figure illustrates a GAN. It is composed of a generator G, that takes as input a noise vector from the latent space to compute a trajectory, and a discriminator D, that classifies trajectories between real and generated.
(real data correctly classified). The process is initiated by drawing random noise vectors z. The two player game can be summarized in the following optimization problem:
min
G maxD Ex∼pd[log(D(x))] + Ez∼pz[log(1 − D(G(z))]
(1) Figure 1 illustrates this principle in the specific case where x belongs to a space of trajectories. Initial vectors z are randomly generated in the latent space and mapped into the trajectory space via the Generator G. The discriminant function D returns a score value close to 1 if the generated trajectory belongs to the real trajectory data distribution or close to 0 otherwise. Next, the training phase of G receives the score feedback in order to generate a more realistic trajectory if the score is low. The process is repeated several times until an equilibrium of the min max game is found. The next section gives more details on the architecture of the generator and discriminator neural network maps used.
3. TRAJECTORY GENERATION
The problem of trajectory generation is usually divided into two paradigms, model-driven generation, and data-driven generation. The approach with GAN is a data-data-driven generation. Since in model-driven generation, trajectories are generated with physical and dynamical models, they cannot take into consideration real-time constraints such as Air Traffic Control or even pilot behavior. Data-driven generation is supposed to provide more realistic generation considering all the parameters from real data. Model-driven generation can use real aircraft models directly, or the BADA (Base of Aircraft Data) model [17], [18] developed by Eurocontrol.
3.1 Aircraft Landing Trajectories
This section illustrates how GAN can be used to generate aircraft landing trajectories at Paris Orly (LFPO) airport. The dataset used is composed of 4401 A320 landing trajecto-ries on runway 26 from Flight Data Monitoring Records. The parameters selected are the longitude, the latitude, the
ENRI Int. Workshop on ATM/CNS. Tokyo, Japan. (EIWAC 2019)
Fig. 2. This figure illustrates the two network architectures; on the left a) the discriminator structure, and on the right b) the generator structure. Both structures use convolution or convolution transpose layers.
altitude and the ground speed for the last 25NM. The initial trajectory rate is one point every 4 seconds, but each trajectory is resampled to obtain 256 uniformly distributed points which fit a neural network structure.
3.2 Neural Network Structures and Learning Process In order to generate aircraft trajectories, specific neu-ral network structures were built using convolutional and transpose convolutional neural networks. The structure of the various networks is illustrated in figure 2. A uniform distribution of the noise z was arbitrarily chosen in a 4-dimensional space since the output space considers 4 dimensions (longitude, latitude, altitude, ground speed). In addition to convolutional structure, each layer is followed by a batch normalization, max pooling, and dropout layers in order to regularize the network.
The learning task was made using Adam optimizer [19] with a decay. The learning rate starts from 10−3 and de-creases to 10−7. Networks were trained during 30 000 steps on a multi-GPU cluster. The cluster is composed of a dual ship Intel Xeon E5-2640 v4 - Deca-core (10 Core) 2,40GHz - Socket LGA 2011-v3 with 8 GPU GF GTX 1080 Ti 11 Go GDDR5X PCIe 3.0.
3.3 Generated Trajectories
After the learning phase, the generator was able to compute new trajectories from sampled noise distribution.
Fig. 3. Illustration of 1000 generated trajectories at Paris Orly Airport. In blue are represented the original trajectories and in green the generated trajectories. At the top, the longitudinal path is represented, in the center, the altitude profile, and at the bottom the ground speed profile.
However, the obtained trajectories were noisy with mainly high-frequency noise. Therefore, a smoothing filter was applied. In particular, a cubic smoothing spline interpolation was computed to remove the noise from the generated trajectories. Figure 3 illustrates filtered generated trajectories for all the parameters.
The overall shape and distribution of the generated tra-jectories was satisfying since they followed the original distribution. Nevertheless, one can see that the generator was not able to capture some types of patterns. For the altitude profile, it is known that aircraft follow levelled-off path before descending on the glide path, but this was not captured by the generator. The same behavior was observed for the extended runway centre line which should be followed from 10NM to the threshold, but the generated trajectories barely followed the localizer path for the last nautical miles. This may be linked to the difficulty of convergence in GAN models. As a reminder, GAN models
solve a min-max problem, which implies a very unstable optimal saddle point. The optimal solution in Equation (1) may not be achieved, meaning that some information such as the levelled-off pattern might not be learned during the training phase.
3.4 Comparison with information Geometry
Information geometry also enables the generation of new trajectories by estimating the Karhunen-Loève expansion [20] through the Functional Principal Component Analysis process. [21]. It consists in considering each curve Γ as the weighted sum of a mean curve γ plus the principal com-ponents φj by defining the orthogonal basis that maximizes
the explained variance in the first dimensions, as shown in the following equation:
Γ(t) = γ(t) +
+∞
X
j=1
bjφj(t)
Usually, the decomposition is truncated to retain a certain variance, which also enables dimensionality reduction. To generate new trajectories, one must first estimate the distri-bution of the principal coefficients bj. Then, one is able to
generate new trajectories using the decomposition basis. It is interesting to highlight that results from FPCA generation with dimensionality reduction are similar to those obtained with our GAN model. Indeed, applying dimensionality re-duction in FPCA only preserves the largest variation mode around the mean curve. Therefore, the levelled-off flights are not captured with the truncated FPCA decomposition either.
4. ANOMALY DETECTION
This section, illustrates how GAN provide solutions to the anomaly detection problem. As explained in 2, GAN combine a generator G, and a discriminator D. After the learning task, the discriminator has been trained to recog-nize real data from generated data. Consequently, the first approach to anomaly detection consists in using the score of D. Indeed, the closer the score is to 0 , the less realistic the data is supposed to be, or in other words, the less likely it is to belong to the original distribution.
Another way to perform anomaly detection with GAN is to build an encoder E (usually another neural network). The encoder embeds samples from the trajectory space to the latent space. The encoder is illustrated in Figure 4. It can be automatically tuned during the GAN training (this setup is known as BIGAN), or after the training (Encoder). The anomaly detection can be applied to a dataset with the following process : first, encode each trajectory in the latent space with the encoder E, next, rebuild the trajectories through the generator, and finally compute a distance be-tween the original and reconstructed trajectories. The most distant trajectories can be considered as anomalies since the generator was not able to rebuild the trajectory properly.
Fig. 4. This figure completes Figure 1 with the encoder E. The encoder selects a trajectory and builds the corresponding noise vector in the latent space.
Indeed, if a trajectory does not belong to the trajectory distribution learned by the generator, the reconstruction error will be high. This approach is very similar to auto-encoder anomaly detection [3], [4]. Nevertheless, GAN are richer since they also provide trajectory generation. The encoder network structure is similar to the discriminant network detailed in Figure 2. However, the last layer is sized to correspond to the latent space dimension.
4.1 Anomaly Detection using the Discriminator A first approach to performing anomaly detection is to use the discriminator. It is trained to distinguish real samples from the original data set and generates samples from the generator. Therefore, its natural behavior tends to give a score next to 1 for trajectories that are similar to the original data set and a score close to 0 for atypical trajectories.
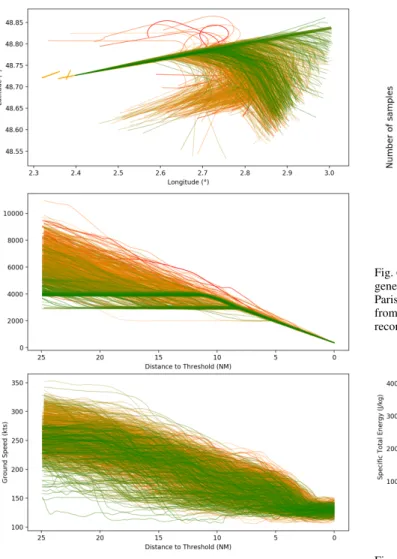
This method of anomaly detection was applied to the original dataset of the Paris Orly Airport trajectories and the results are shown on Figure 5. Red lines correspond to trajectories with the minimum discriminator score for the dataset, green lines to the maximum discriminant score, and orange lines to intermediate values.
The anomaly detection with the discriminator shows in-teresting results for the longitudinal trajectories and for the altitude profiles. The typical altitude profile (in green) follows a levelled-off path before descending on the glide path, which corresponds to the published procedure. On the other hand, the atypical profiles present high altitude or even Glide Interception From Above. 2D trajectories are illustrated at the top of Figure 5. It seems that typical 2D paths are approaches from the south and east, while less typical come from the west and very atypical from the north with holding patterns. The ground speed profiles, at the bottom of Figure 5, do not show any specific results.
4.2 Anomaly Detection using the Encoder
This section illustrates the use of the encoder to detect anomalies. The encoder was tuned automatically after the GAN training phase. The encoder embedded the trajec-tory samples to the latent space. The anomaly detection
ENRI Int. Workshop on ATM/CNS. Tokyo, Japan. (EIWAC 2019)
Fig. 5. This figure illustrates the score given by the discriminator to the original dataset. The red lines correspond to the minimum discriminator score obtained for the dataset, and green lines to the maximum discrimi-nator score (orange corresponds to intermediate scores). The longitudinal trajectories are illustrated at the top, the altitude profiles in the centre, and the speed profiles at the bottom.
was performed in three steps. First, each trajectory was embedded to the latent space with the encoder. Second, all trajectories were rebuilt through the generator. Third, the reconstruction error (L2 Norm) was computed between the original trajectories and the rebuilt trajectories. Finally, trajectory with high reconstruction errors were considered as atypical.
In order to be able to compare results with the functional principal component analysis method explained in [6], the anomaly detection was applied to specific total energy tra-jectories. The specific total energy is the sum of the potential energy and the specific kinetic energy per unit of mass. Since the mass is not available in radar data, the method developed in [6] considers an approximation of the total energy considering a mass constant over the last nautical miles. Considering specific total energy can be explained by
Fig. 6. In this figure is illustrated the normalized distribution of the encoder-generator reconstruction errors for the specific total energy trajectories at Paris Orly Airport. The color green is attributed to small errors and goes from orange to red for larger errors. Trajectories corresponding to important reconstruction errors on the right of the plot are considered as atypical.
Fig. 7. This figure represents the specific total energy trajectories at Paris Orly Airport. The color corresponds to the reconstruction error. Trajectories with a small reconstruction error are represented in green, and large errors in red.
the fact that safe approaches and landings are closely linked to good energy management. Therefore, one may assume that atypical energy management may induce safety events or incidents.
In this purpose, another network was trained to gener-ate and encode specific total energy trajectories extracted from Paris Orly landing trajectories. Figure 6 illustrates the normalized distribution of reconstruction errors. The color variation is from green for small errors to red for large reconstruction errors. This corresponding color (and reconstruction error) is also used to represent the specific total energy trajectories in Figure 7.
Two groups of anomalies can be found. The first group is composed of low energy profile trajectories, the second of high energy profile trajectories. However, the largest reconstruction errors correspond to high energy profiles (in red at the top of the figure). The flight with the highest reconstruction error was selected. The comparison with the atypical coefficient algorithm using FPCA [6] is detailed
Fig. 8. This figure represents the highest reconstruction score flight altitude profile (at the top), and speed profile (at the bottom). The colored dots correspond to the atypical FPCA coefficients.
below. Figure 8 illustrates the altitude profile and the speed profile of this flight. The colored dots correspond to atypical coefficients between 0 for typical and 1 for atypical. Be-tween, 25NM and 15NM, one can observe a large atypical area due to high energy (high altitude and high speed). FPCA algorithm and GAN anomaly detection seem to be correlated. This result is also observed for the 10 highest reconstruction error flights from the GAN anomaly detection experiments.
4.3 Latent Space Representation
The encoder enables the trajectories to be embedded in latent space. Each trajectory is then represented as a single
Fig. 9. The graph illustrates, at the top, the embedding of the original total specific energy trajectories into the latent space, and at the bottom the corresponding trajectories. Trajectories were clustered into two groups (green and blue) around the line x + y = 0.
point in a low dimensional space. Therefore, this enables a simpler representation of a group of samples with a dimensionality reduction. The embedding of the original trajectories in latent space is represented at the top of Figure 9. The corresponding total energy trajectories are illustrated at the bottom. The embedded data of the two groups were clustered around the line x + y = 0. The first group in blue is above the line, and the second group in green is below the line.
This representation enables different applications such as clustering, data analysis, or linear interpolation. For example, one may use this representation for approach procedure detection.
ENRI Int. Workshop on ATM/CNS. Tokyo, Japan. (EIWAC 2019)
5. CONCLUSION
Generative adversarial networks have proven to be very effective in generating realistic scenes and objects in com-puter vision. This article investigates their use in the field of aircraft trajectory generation and abnormal or non-compliant trajectory detection. Preliminary experiments show that the generated trajectories follow realistic patterns. This con-firms that GAN are promising alternatives to model-based trajectory simulators. The resulting generated trajectories are based on past historical data and therefore account for external factors that are often difficult to embed in physical models. Further experiments were also provided with GAN to detect non-compliant or atypical trajectories. A comparison with a technique based on functional principal component analysis also confirms that reported anomalies are relevant. To the best of our knowledge, this work is the first attempt to generate aircraft trajectories with such generative machine learning tools. There remains, therefore, much more to investigate in this domain. Further work should include the analysis of tailored network architectures and learning, or extensions to Wasserstein GAN [22] that can learn data from multimodal distributions.
ACKNOWLEDGMENT
The authors would like to show their gratitude to Aigle-Azur airline company for providing Flight Data Monitoring Records.
REFERENCES
[1] S. Das, B. L. Matthews, A. N. Srivastava, and N. C. Oza, “Multiple kernel learning for heterogeneous anomaly detection: algorithm and aviation safety case study,” in Proceedings of the 16th ACM SIGKDD international conference on Knowledge discovery and data mining. ACM, 2010, pp. 47–56.
[2] N. Chrysanthos, “Kernel methods for flight data monitoring,” Ph.D. dissertation, Troyes, 2014.
[3] M. Sakurada and T. Yairi, “Anomaly detection using autoencoders with nonlinear dimensionality reduction,” in Proceedings of the MLSDA 2014 2nd Workshop on Machine Learning for Sensory Data Analysis. ACM, 2014, p. 4.
[4] C. Zhou and R. C. Paffenroth, “Anomaly detection with robust deep autoencoders,” in Proceedings of the 23rd ACM SIGKDD Interna-tional Conference on Knowledge Discovery and Data Mining. ACM, 2017, pp. 665–674.
[5] C. Barreyre, “Statistiques en grande dimension pour la détection d’anomalies dans les données fonctionnelles issues des satellites,” Ph.D. dissertation, INSA de Toulouse, 2018.
[8] C. Vondrick, H. Pirsiavash, and A. Torralba, “Generating videos with scene dynamics,” in Advances in Neural Information Processing Systems 29, D. D. Lee, M. Sugiyama, U. V. Luxburg, I. Guyon, and R. Garnett, Eds. Curran Associates, Inc., 2016, pp. 613– 621. [Online]. Available: http://papers.nips.cc/paper/6194-generating-videos-with-scene-dynamics.pdf
[6] G. Jarry, D. Delahaye, F. Nicol, and E. Féron, “Aircraft atypical approach detection using functional principal component analysis,” in SESAR Innovations Days 2018, 2018.
[7] I. J. Goodfellow, J. Pouget-Abadie, M. Mirza, B. Xu, D. Warde-Farley, S. Ozair, A. Courville, and Y. Bengio, “Generative adversarial nets,” in Proceedings of the 27th International Conference on Neural Information Processing Systems - Volume 2, ser. NIPS’14. Cambridge, MA, USA: MIT Press, 2014, pp. 2672–2680. [Online]. Available: http://dl.acm.org/citation.cfm?id=2969033.2969125 [9] A. Brock, J. Donahue, and K. Simonyan, “Large scale GAN
training for high fidelity natural image synthesis,” in International Conference on Learning Representations, 2019. [Online]. Available: https://openreview.net/forum?id=B1xsqj09Fm
[10] E. Putin, A. Asadulaev, Q. Vanhaelen, Y. Ivanenkov, A. V. Aladinskaya, A. Aliper, and A. Zhavoronkov, “Adversarial threshold neural computer for molecular de novo design,” Molecular Pharmaceutics, vol. 15, no. 10, pp. 4386–4397, 2018, pMID: 29569445. [Online]. Available: https://doi.org/10.1021/acs.molpharmaceut.7b01137
[11] S. Reed, Z. Akata, X. Yan, L. Logeswaran, B. Schiele, and H. Lee, “Generative adversarial text to image synthesis,” in Proceedings of The 33rd International Conference on Machine Learning, ser. Proceedings of Machine Learning Research, M. F. Balcan and K. Q. Weinberger, Eds., vol. 48. New York, New York, USA: PMLR, 20–22 Jun 2016, pp. 1060–1069. [Online]. Available: http://proceedings.mlr.press/v48/reed16.html
[12] T. Schlegl, P. Seeböck, S. M. Waldstein, U. Schmidt-Erfurth, and G. Langs, “Unsupervised anomaly detection with generative adversarial networks to guide marker discovery,” CoRR, vol. abs/1703.05921, 2017. [Online]. Available: http://arxiv.org/abs/1703.05921
[13] A. Gupta, J. Johnson, L. Fei-Fei, S. Savarese, and A. Alahi, “So-cial gan: So“So-cially acceptable trajectories with generative adversarial networks,” in The IEEE Conference on Computer Vision and Pattern Recognition (CVPR), June 2018.
[14] N. Hirose, A. Sadeghian, P. Goebel, and S. Savarese, “To go or not to go? a near unsupervised learning approach for robot navigation,” CoRR, vol. abs/1709.05439, 2017.
[15] W. Ding, W. Wang, and D. Zhao, “Multi-Vehicle Trajectories Gener-ation for Vehicle-to-Vehicle Encounters,” in 2019 IEEE InternGener-ational Conference on Robotics and Automation (ICRA), 2019.
[16] I. J. Goodfellow, “NIPS 2016 tutorial: Generative adversarial networks,” CoRR, vol. abs/1701.00160, 2017. [Online]. Available: http://arxiv.org/abs/1701.00160
[17] D. Poles, A. Nuic, and V. Mouillet, “Advanced aircraft performance modeling for atm: Analysis of bada model capabilities,” in 29th Digital Avionics Systems Conference. IEEE, 2010, pp. 1–D. [18] A. Nuic, D. Poles, and V. Mouillet, “Bada: An advanced aircraft
performance model for present and future atm systems,” International journal of adaptive control and signal processing, vol. 24, no. 10, pp. 850–866, 2010.
[19] D. P. Kingma and J. Ba, “Adam: A Method for Stochastic Optimization,” arXiv:1412.6980 [cs], Dec. 2014, arXiv: 1412.6980. [Online]. Available: http://arxiv.org/abs/1412.6980
[20] H. Stark and J. Woods, Probability, random processes, and estimation theory for engineers. Prentice-Hall, 1986. [Online]. Available: https://books.google.fr/books?id=2pFRAAAAMAAJ [21] C. Hurter, S. Puechmorel, F. Nicol, and A. Telea, “Functional
decom-position for bundled simplification of trail sets,” IEEE Transactions on Visualization and Computer Graphics, vol. 24, no. 1, pp. 500–510, Jan 2018.
[22] M. Arjovsky, S. Chintala, and L. Bottou, “Wasserstein gan,” ArXiv, vol. abs/1701.07875, 2017.


![Rhéologie globale et structurale des alliages de titane TA6V et BETACEZ dans les domaines [alpha] + [bêta] et [bêta]](data:image/gif;base64,R0lGODlhAQABAIAAAP///wAAACH5BAEAAAAALAAAAAABAAEAAAICRAEAOw==)