A. Aroua H. Rickli J.-C. Stauffer P. Schnyder P. R. Trueb J.-F. Valley P. Vock F. R. Verdun Received: 12 January 2006 Revised: 28 July 2006 Accepted: 25 August 2006 Published online: 27 October 2006 # Springer-Verlag 2006
How to set up and apply reference levels
in fluoroscopy at a national level
Abstract A nationwide survey was launched to investigate the use of fluoroscopy and establish national reference levels (RL) for dose-inten-sive procedures. The 2-year investi-gation covered five radiology and nine cardiology departments in public hospitals and private clinics, and focused on 12 examination types: 6 diagnostic and 6 interventional. A total of 1,000 examinations was re-gistered. Information including the fluoroscopy time (T), the number of frames (N) and the dose-area product (DAP) was provided. The data set was used to establish the distributions of T,
N and the DAP and the associated RL values. The examinations were pooled to improve the statistics. A wide variation in dose and image quality in fixed geometry was observed. As an example, the skin dose rate for ab-dominal examinations varied in the range of 10 to 45 mGy/min for comparable image quality. A wide variability was found for several types of examinations, mainly complex ones. DAP RLs of 210, 125, 80, 240, 440 and 110 Gy cm2were established for lower limb and iliac angiography, cerebral angiography, coronary angi-ography, biliary drainage and stenting, cerebral embolization and PTCA, respectively. The RL values estab-lished are compared to the data published in the literature. Keywords Reference levels . Diagnostic and interventional radiology . Patient dose
Introduction
X-ray examinations involving fluoroscopy, particularly those performed in gastroenterology and cardiology as well as angiography and interventional procedures,
con-tribute significantly to the total collective dose due to medical exposure even if their frequency is relatively low. The last survey on the exposure of the Swiss population by X-ray imaging indicated that this contribution amounts to up to 29% [1]. Moreover, these types of examinations A. Aroua . J.-F. Valley . F. R. Verdun
University Institute of Applied Radiation Physics, Lausanne, Switzerland H. Rickli Department of Cardiology, Kantonsspital, St. Gallen, Switzerland J.-C. Stauffer Department of Cardiology, Vaud University Hospital, Lausanne, Switzerland P. Schnyder
Department of Radiology, Vaud University Hospital, Lausanne, Switzerland P. R. Trueb
Federal Office of Public Health (FOPH),
Bern, Switzerland
P. Vock
Department of Radiology, Bern University Hospital, Bern, Switzerland A. Aroua (*)
Institut Universitaire de Radiophysique Appliquée, Grand-Pré 1, 1007 Lausanne, Switzerland e-mail: [email protected] Tel.: +41-21-6233434 Fax: +41-21-6233435
deliver effective doses to the patient as high as 100 mSv and lead to extremely high entrance surface doses, up to a few Gy, resulting in a significant risk of deterministic effects.
Several international bodies seriously address the issue of radiation protection of the patient and the radiologist for dose-intensive examinations. The International Commis-sion on Radiological Protection (ICRP) dedicated one of its publications to the means and methods to use for preventing the lesions that may be induced by interventional radiology [2]. Similarly, the European Directive 97/43 Euratom states in its article 9 that the “member States shall ensure that appropriate radiological equipment, practical techniques and ancillary equipment are used for the medical exposure (a) of children, (b) as part of a health screening programme, (c) involving high doses to the patient, such as interven-tional radiology, computed tomography or radiotherapy” [3].
In this context, in recent years reference levels (RLs) have become of central importance in the management of radiation doses delivered to the patient in diagnostic and interventional radiology [4,5]. In 2000 the National Radio-logical Protection Board (NRPB), now part of the Health Protection Agency, reviewed the UK national reference levels for a number of examinations [6], in 2002 the Swedish Radiation Protection Authority issued regulations and general advice concerning the implementation of refer-ence levels in Sweden [7], and in 2003 the Federal Office for Radiological Protection (BfS) introduced reference levels in Germany [8]. More and more effort is focused on dose-intensive fluoroscopy examinations. At the interna-tional level, the results of several investigations of patients’ doses have been published in the recent literature [9–28]. Since the dose-intensive examinations involving fluoros-copy may result in a significant risk of deterministic effects, notably to the skin, it is recommended that the entrance surface doses be monitored for preventing skin injuries. Some authors claim that the DAP is not a suitable quantity for such a monitoring task because of the weak correlation between the DAP and the entrance surface dose [29], and that the latter should be measured directly on the patient. But in the absence of a direct measurement, conversion factors published in the literature [19,30–33] may be used to establish the maximum (peak) skin dose from the DAP.
Setting up RLs for dose-intensive examinations involving fluoroscopy is a difficult task due to the large variability of the fluoroscopy time and the number of images leading to a wide distribution of patient doses. This is due to several factors, including the often loose definition of the exami-nation, differences in the techniques and protocols used, the variability in the complexity of the cases and the experience of the radiologist. In 2000 already, Marshall et al. [9] pointed out the difficulties encountered when establishing RLs for interventional radiology, such as the difficulty of defining a “typical” examination, the limited number of patients and the restriction to specialist centres. On the other hand, the large variability related to the procedures makes it
mean-ingless in the application of RLs to compare a single interventional examination to the RL value. These difficul-ties may lead to the perception that even the concept of RL is not appropriate for interventional radiology or at least to the view that this tool should be used with caution.
To have a reliable set of RLs for a selection of exam-inations, a large number of registrations must be made for each type of examination, which is time and resource con-suming. As an alternative, the pooling of all the examina-tions registered regardless of their type is proposed to improve the accuracy of the RL values [9].
In Switzerland the strategy for establishing RLs consisted of: (1) launching nationwide dosimetric surveys in order to establish national RLs for the various radiolog-ical modalities; (2) until the results of these surveys are available, European RL values are adopted when possible [34,35]; (3) in the absence of European data, provisional RLs were calculated from average doses established by dosimetric modelling in diagnostic and interventional radiology during the 1998 nationwide survey on the exposure of the public by radio-diagnostics in Switzerland [1,36]. The RLs were derived from the average doses using a 1.5 multiplying factor [37].
In early 2000 the Swiss Federal Office of Public Health, in collaboration with the University Institute of Applied Radia-tion Physics, set up a working group on the optimisaRadia-tion of radiation protection in the case of dose-intensive X-ray examinations. The aim of the studies conducted by this working group is to increase the awareness of the phy-sicians, the radiographers and the medical physicists to radiation hazards in dose-intensive examinations, in order to improve the optimisation of the radiological technique. In 2002, the working group launched a study to investigate the situation of fluoroscopy in Switzerland. The aim of this study was twofold: (1) to investigate the technique used to perform 12 common types of examinations involving fluoroscopy in hospitals and clinics performing the bulk of the dose-intensive examinations in Switzerland and (2) to collect dosimetric data in order to establish RL values for the 12 types of examinations investigated. This paper describes the method, presents the results of the investigation and comments on the implementation of the proposed RL values in the case of interventional radiology.
Methods
The investigation lasted 2 years and covered five radiology and nine cardiology departments in nine public hospitals and private clinics, and focused on 12 types of examina-tions (6 diagnostic and 6 interventional) after a discussion with the practitioners of the participating centres. These 12 types of examinations, which will be denoted EX01 to EX12, are presented with a short description in Table1.
The radiology departments belong to the five Swiss university hospitals, whereas the nine cardiology
depart-ments represent 36% of the cardiology practice in the Swiss hospitals and clinics. The selection of the departments was based on the results of the 1998 nationwide survey of the exposure of the Swiss population to medical X-rays [1], which covered university hospitals, regional hospitals and clinics as well as private practices. In the case of interventional radiology, the bulk of the examinations are performed in university hospitals (80% on average for the types of examinations considered in this study). For diagnostic radiology the fraction of the total number of examinations performed in university hospitals is lower (on average 51% for the angiographies and 23% for the barium-based examinations explored here).
Each centre was asked to register 20 examinations for each of the 12 types. Four centres provided data for two combined examinations: a procedure including coronary angiography and percutaneous coronary intervention (PCI) and another including electrophysiology and thermo-ablation. These two procedures will be denoted EX13 and EX14. For each examination, the centres were requested to fill in out a questionnaire containing various information (fluoroscopy time, number of analogue images and digital frames, dose-area product and difficulty of the case) on the patient undergoing this examination (age, gender, height and weight) and on the practitioner
performing the examination (medical specialty, number of years of experience and number of examinations already performed). The paper questionnaire approach proved to be time costly, and an automatic registration would be of great help in future surveys.
In addition to the data collected concerning the exam-inations, the 27 fluoroscopy units used in the healthcare-providing centres were investigated. First, the DAP meters of the fluoroscopy units were checked using an external reference DAP meter put on top of the measuring device of the fluoroscopy unit. Each DAP meter was checked twice: before the registration of the protocols and at the end of the study. The variations between the measure-ments were lower than 10%. Apart from two cases where the indication of the local DAP meter was a factor of two higher than the reference instrument, all the DAP meters gave doses within the limits set by the Swiss Ordinance on X-ray Units (±30%).
Unlike the American RAD-IR study [18–20] where the fluoroscopy units were similar (Siemens, with Cu filtra-tion), a large variability in the brands and the technical specifications of the fluoroscopy units used in the participating centres was registered in our case. The units are often programmed according to the anatomical region under investigation and operate under different modes for
Table 1 The 12 types of examinations investigated
Code Type of examination Description
Diagnostic
EX01 Barium meal Investigation of the upper GI tract (oesophagus and stomach)
EX02 Lower limb and iliac angiography Investigation of the morphology of abdominal aorta, the departure of renal arteries
and the arteries vascularising the lower limbs for the detection of aneurisms and stenoses of the diagnose of arterioscleroses
EX03 Cerebral angiography Investigation of head and brain arteries (selective, four vessels)
EX04 Barium enema Investigation of colon using a contrast medium
EX05 Coronary angiography Examination of coronary arteries
EX06 Electrophysiology Percutanuous transluminal examination of cardiac potentials
Interventional
EX07 Hepatic embolisation Hepatic embolisation (e.g., using Lipiodol) through the hepatic arteries, aiming at
treating a haemorrhage, a tumour or an arterio-venous shunt
EX08 Biliary drainage and stent insertion Percutaneous transhepatic drain insertion in one of the biliary tracts
EX09 Cerebral embolisation Therapeutic obstruction (coiling) during the treatment of arterio-venous
malformation (MAV), of arterio-venous fistulas (FAV), intra-cranial aneurisms, tumours or hemorrhagic lesions
EX10 Iliac dilatation and stent insertion Improvement of lower limbs perfusion
EX11 Percutaneous coronary intervention Balloon-dilatation of one or several coronary segments followed or not by stenting
EX12 Cardiac thermo ablation Local thermoablation using a catheter with a radiofrequency source of the region
of the heart responsible for arrhythmias Diagnostic + interventional
EX13 Coronary angiography (EX05) + percutaneous coronary intervention (EX11)
Descriptions of EX05 and EX11 above EX14 Electrophysiology (EX06) + cardiac thermo
ablation (EX12)
the same irradiation geometry. The knowledge of the parameters used for the various categories of examinations was judged necessary. The units were therefore character-ised in terms of the image quality, and the patient dose associated to the various modes used. The assessment of the image quality consisted in establishing the spatial resolution limit at the middle of a Leeds TOR(CDR) Test Object [38]. The dose measurements were performed using an 11-cm3ionisation chamber connected to a Radcal 3036 dosemeter and a 20-cm-thick PMMA phantom.
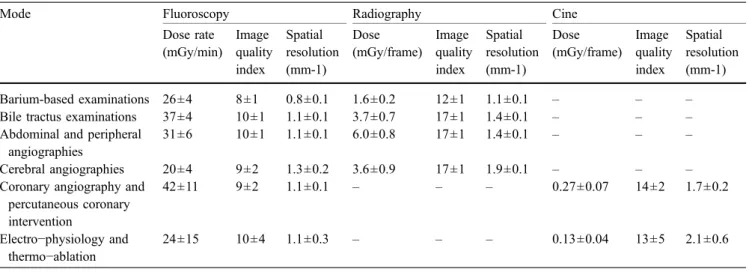
The characteristics of the fluoroscopy units (dose rate, dose per frame, image quality index and spatial resolution) were established for three imaging modes (radiography, fluoroscopy and cine), various diameters (or magnifications) of the image intensifier and various imaging frequencies and for six categories of examinations: (1) barium-based examinations, (2) bile tractus examinations, (3) abdominal and peripheral angiographies, (4) cerebral angiographies, (5) coronary angiography and percutaneous coronary interven-tion and (6) electro-physiology and thermo-ablainterven-tion. A summary of the results of this characterisation is given in Table 2. The average values of the dose rates in the fluoroscopy mode for the various categories range from 20 mGy/min for cerebral angiographies to 42 mGy/min for coronary angiography and percutaneous coronary interven-tion. The dose per image in the radiography mode ranges on average from 1.6 mGy for barium-based examinations to 6 mGy for abdominal and peripheral angiographies. The category“coronary angiography and percutaneous coronary intervention” is a factor of 2 higher than the category “electro-physiology and thermo-ablation” in terms of both the dose rate (fluoroscopy) and dose per image (cine mode). It should be mentioned that all units involved in digestive investigations (barium-based) were relatively old systems (15 to 10 years) working in a continuous fluoroscopy mode, and all units dealing with cerebral investigations (diagnostic and therapeutic) were modern
systems (5 years to less than 6 months) equipped with copper filters and working in pulse mode. For all other examinations, the units did not have a copper filter, but used a pulse mode (2 to 10 years old).
The variation of the dose rate for the same irradiation geometry was found to be of the order of a factor of 3 for the best detection at low contrast. A significant decrease of the dose rate was registered (a factor of 2.5–3 for a 20-cm PPMA slab) when adding a Cu filtration.
In order to establish reference levels, the third-quartile method is adopted in this work. It prescribes the use as a RL of a dose value corresponding to 75% of the dose distribution established by a dosimetric survey. This method requires a statistically significant set of data. In our case, the number of DAP values collected per type of examination was relatively low, ranging from 20 to 184. For this reason, an overall data analysis, pooling all the examinations registered, was preferred. The hypothesis adopted is that in relative values the distribution of the parameters of interest such as the DAP for the pooled examinations is not different from that obtained for one specific examination, which will be checked statistically using the Kolmogorov-Smirnov test. For each type of examination, the fluoroscopy time (T), the number of frames (N) and the DAP were divided by the geometric mean values related to this examinations. Then the distributions of these relative values were established in a logarithmic scale and used to determine the RL values using the 75th-percentile method. The use of the geometric mean and the log scale is justified by the fact that skewed distributions often closely fit the log-normal distribution and are related to multiplicative effects [39]. The factors influencing the parameters of interest such as the DAP (e.g., patient thickness) are of a multiplicative nature. Marshall et al. [9] have already shown that logarithmic transformation of the DAP distributions for interventional procedures produces reasonably normal distributions.
Table 2 Average values and standard deviations related to the dose rate, the image quality index and the spatial resolution associated with the 27 fluoroscopy units investigated in this study and used for the various categories of examinations involving fluoroscopy
Mode Fluoroscopy Radiography Cine
Dose rate (mGy/min) Image quality index Spatial resolution (mm-1) Dose (mGy/frame) Image quality index Spatial resolution (mm-1) Dose (mGy/frame) Image quality index Spatial resolution (mm-1) Barium-based examinations 26±4 8±1 0.8±0.1 1.6±0.2 12±1 1.1±0.1 – – –
Bile tractus examinations 37±4 10±1 1.1±0.1 3.7±0.7 17±1 1.4±0.1 – – –
Abdominal and peripheral angiographies
31±6 10±1 1.1±0.1 6.0±0.8 17±1 1.4±0.1 – – –
Cerebral angiographies 20±4 9±2 1.3±0.2 3.6±0.9 17±1 1.9±0.1 – – –
Coronary angiography and percutaneous coronary intervention 42±11 9±2 1.1±0.1 – – – 0.27±0.07 14±2 1.7±0.2 Electro−physiology and thermo−ablation 24±15 10±4 1.1±0.3 – – – 0.13±0.04 13±5 2.1±0.6
Results
During this study, 1,000 examinations were registered. This is a good response rate since it represents 70% of the 1,440 registrations ideally expected and corresponds to an average of 77 examinations per centre and 83 examinations per type. The age distributions of the patients for the various types of examinations showed a 14- to 28-year shift
to higher ages with regard to the age profile of the general population (average ages of 53 to 67 against an average age of 39, respectively).
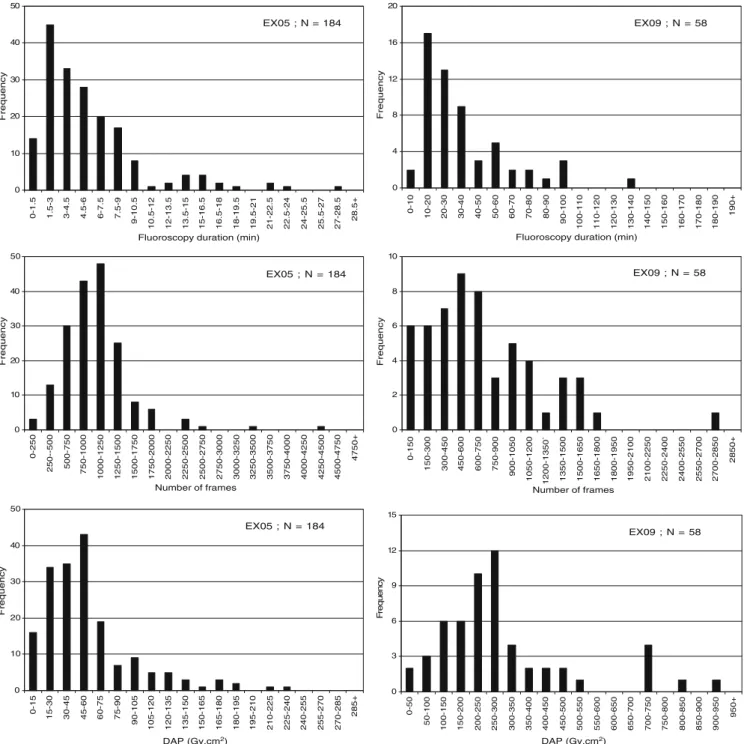
The first step in order to establish RLs was to plot the distributions of the fluoroscopy time (T), the number of frames (N) and the DAP for all types of examinations considered. Figure1gives an illustration of such distribu-tions for one diagnostic (coronary angiography-EX05) and
EX05 ; N = 184 0 10 20 30 40 50 0-1.5 1.5-3 3-4.5 4.5-6 6-7.5 7.5-9 9-10.5 10.5-12 12-13.5 13.5-15 15-16.5 16.5-18 18-19.5 19.5-21 21-22.5 22.5-24 24-25.5 25.5-27 27-28.5 28.5+
Fluoroscopy duration (min)
Frequency EX09 ; N = 58 0 4 8 12 16 20 0-10 10-20 20-30 30-40 40-50 50-60 60-70 70-80 80-90 90-100 100-110 110-120 120-130 130-140 140-150 150-160 160-170 170-180 180-190 190+
Fluoroscopy duration (min)
Frequency EX05 ; N = 184 0 10 20 30 40 50 0-250 250--500 500-750 750-1000 1000-1250 1250-1500 1500-1750 1750-2000 2000-2250 2250-2500 2500-2750 2750-3000 3000-3250 3250-3500 3500-3750 3750-4000 4000-4250 4250-4500 4500-4750 4750+ Number of frames Frequency EX09 ; N = 58 0 2 4 6 8 10 0-150 150-300 300-450 450-600 600-750 750-900 900-1050 1050-1200 1200-1350` 1350-1500 1500-1650 1650-1800 1800-1950 1950-2100 2100-2250 2250-2400 2400-2550 2550-2700 2700-2850 2850+ Number of frames Frequency EX05 ; N = 184 0 10 20 30 40 50 0-15 15-30 30-45 45-60 60-75 75-90 90-105 105-120 120-135 135-150 150-165 165-180 180-195 195-210 210-225 225-240 240-255 255-270 270-285 285+
DAP (Gy.cm2) DAP (Gy.cm2)
Frequency EX09 ; N = 58 0 3 6 9 12 15 0-50 50-100 100-150 150-200 200-250 250-300 300-350 350-400 400-450 450-500 500-550 550-600 600-650 650-700 700-750 750-800 800-850 850-900 900-950 950+ Fr e q u e n c y
Fig. 1 Distribution of the fluoroscopy time, the number of frames and the DAP for coronary angiography (EX05) and cerebral embolisation (EX09)
one interventional (cerebral embolisation-EX09) examina-tion. The mean values and the ranges associated with the distributions of T, N and the DAP for all the 14 types of examinations addressed in this study are shown in Table3.
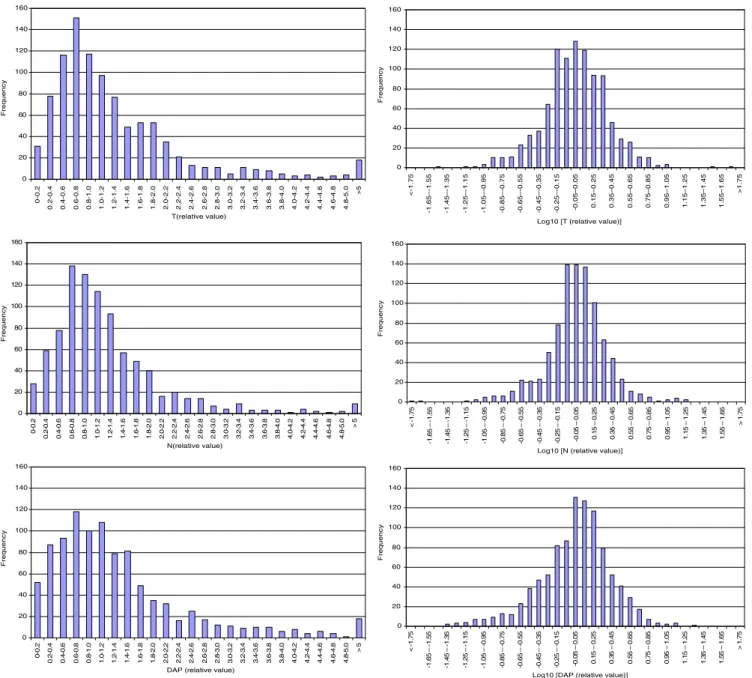
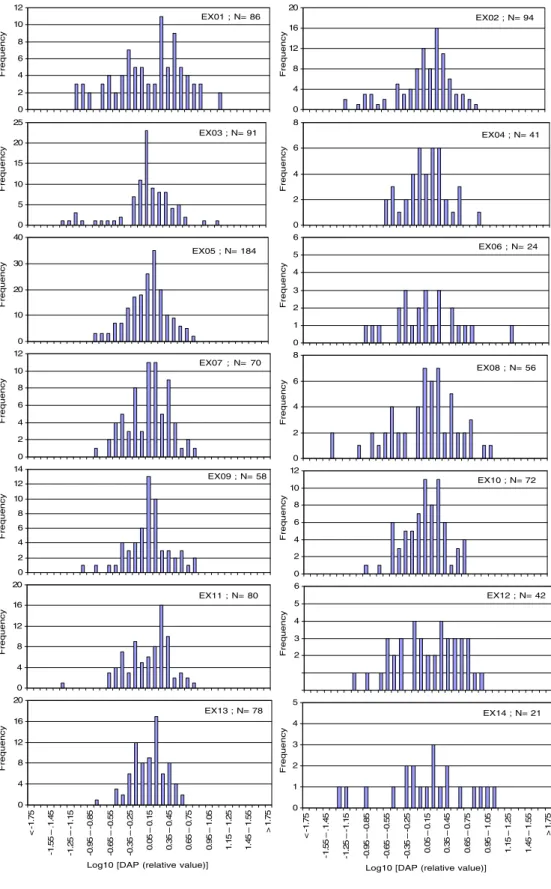
The T, N and DAP distributions for the pooled patients are shown in Fig. 2, while Fig. 3 presents the DAP distributions specific to each of the 14 types of examina-tions for the purpose of comparison.
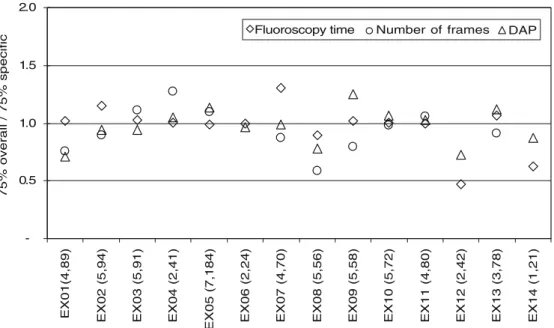
From Fig. 2, the 75% values were established. They were found to be equal to the geometric mean value multiplied by a factor 1.70 for the fluoroscopy time, 1.47 for the number of frames and 1.72 for the DAP. The factors established here are used to determine the 75% values in terms of T, N and DAP for the 14 types of examinations considered. The 75% values established from the overall distribution (whole dataset) are compared to the 75% values established from the distributions specific to each type of examination (Fig.4). The 75% values established from the overall distribution, in terms of T, N and DAP, are rounded and proposed as reference levels (RL) for the 14 types of examinations considered in this study. These RLs are shown in Table4.
Discussion
The distributions shown in Fig.1(linear scale) are skewed distributions characterised by an asymmetric shape: a main peak, a tail and a few extreme values. They are typical of what is expected for examinations involving fluoroscopy.
Table 3 reveals interesting features about the use of fluoroscopy in Switzerland. For barium meal (EX01) and barium enema (EX04) examinations, fluoroscopy times higher than 20 min are registered in some cases. Moreover, more than 100 frames are acquired in some barium meal procedures. This leads to DAPs as high as 400 Gy cm2. This
seems too high for this kind of diagnostic examination when compared to the data published in the literature, notably the UK data [6], with an average DAP of 10.3 and 23.5 vs. 67 and 114 Gy cm2in this work for barium meal and barium enema, respectively. However, the high values registered for this examination may be explained by several factors. Firstly, the definition of barium meal is quite loose and may refer to examinations covering very different areas of the digestive tract. Moreover, this type of examination is often performed on old units without Cu filtration. It is often carried out by junior radiologists with little training who lack experience on how to use the unit properly and to optimise parameters such as the frame rate and the collimation.
Concerning lower limb angiographies (EX02), although the average fluoroscopy time is about 7 min, some extreme values higher than 20 min of fluoroscopy (up to 46 min) are registered, which may be related to difficult cases. DAPs as high as several hundred Gy cm2with an average of about 180 are involved in this type of examination, for which RL values of 33 Gy cm2[6] and 85 Gy cm2[8] are reported in the UK and Germany, respectively. This examination includes iliac angiography and can involve a wide range of vessels. It may or may not follow a CT or an MRI procedure and thus corresponds to a wide range of selectivity of the examination. The definition given in the questionnaire for this type of examination may appear not specific enough. It should be noted that this type of examination may be replaced in the future by CT angiography [40,41].
Similarly, cerebral angiographies (EX03) are character-ised by an average fluoroscopy time of 13 min, but much higher values have been found. The associated DAP can be up to 1,000 Gy cm2with an average of 121 Gy cm2. For this type of examination, Brambilla et al. [17] reported a range of DAPs from 19 to 401 Gy cm2, with an average of 158 Gy cm2. A great variability is found for this type of procedure performed mainly at university hospitals.
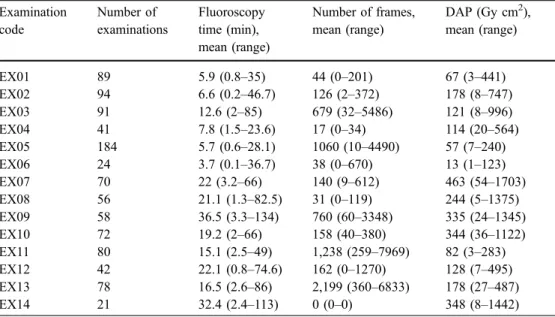
Table 3 Mean values and ranges of the fluoroscopy time, number of frames and DAP for the various types of examinations
Examination code Number of examinations Fluoroscopy time (min), mean (range) Number of frames, mean (range) DAP (Gy cm2), mean (range) EX01 89 5.9 (0.8–35) 44 (0–201) 67 (3–441) EX02 94 6.6 (0.2–46.7) 126 (2–372) 178 (8–747) EX03 91 12.6 (2–85) 679 (32–5486) 121 (8–996) EX04 41 7.8 (1.5–23.6) 17 (0–34) 114 (20–564) EX05 184 5.7 (0.6–28.1) 1060 (10–4490) 57 (7–240) EX06 24 3.7 (0.1–36.7) 38 (0–670) 13 (1–123) EX07 70 22 (3.2–66) 140 (9–612) 463 (54–1703) EX08 56 21.1 (1.3–82.5) 31 (0–119) 244 (5–1375) EX09 58 36.5 (3.3–134) 760 (60–3348) 335 (24–1345) EX10 72 19.2 (2–66) 158 (40–380) 344 (36–1122) EX11 80 15.1 (2.5–49) 1,238 (259–7969) 82 (3–283) EX12 42 22.1 (0.8–74.6) 162 (0–1270) 128 (7–495) EX13 78 16.5 (2.6–86) 2,199 (360–6833) 178 (27–487) EX14 21 32.4 (2.4–113) 0 (0–0) 348 (8–1442)
Although a specific protocol was sent to the participants, some of them have obviously provided data concerning selective cerebral angiographies. The fluoroscopy times may seem quite long (85 min fluoroscopy in one case), but cerebral angiography is a complex procedure with signif-icant implications on the quality of life of the patient who usually is in a critical state. This examination is usually performed by senior radiologists and hence the high doses are due less to a lack of training than to the complexity of the case. In the future, the use of CT and MRI for this kind
of investigation will reduce the collective dose associated with this type of fluoroscopy examination.
Coronary angiography (EX05) and percutaneous coro-nary intervention (EX11) and the procedure combining the two (EX13) are characterised by a great dispersion of the number of frames with high average values of 1,000– 2,000. The associated DAPs range from 57 to 178 Gy cm2. This is comparable with the average values published in the literature and compiled by Maeder et al. [42]: 6.2–109 Gy cm2 for coronary angiography and 6.7–163 Gy cm2 for percutaneous coronary intervention.
0 20 40 60 80 100 120 140 160 0-0.2 0.2-0.4 0.4-0.6 0.6-0.8 0.8-1.0 1.0-1.2 1.2-1.4 1.4-1.6 1.6-1.8 1.8-2.0 2.0-2.2 2.2-2.4 2.4-2.6 2.6-2.8 2.8-3.0 3.0-3.2 3.2-3.4 3.4-3.6 3.6-3.8 3.8-4.0 4.0-4.2 4.2-4.4 4.4-4.6 4.6-4.8 4.8-5.0 >5 T(relative value) Frequency 0 20 40 60 80 100 120 140 160 <-1.75 -1.65–-1.55 -1.45–-1.35 -1.25–-1.15 -1.05–-0.95 -0.85–-0.75 -0.65–-0.55 -0.45–-0.35 -0.25–-0.15 -0.05–0.05 0.15–0.25 0.35–0.45 0.55–0.65 0.75–0.85 0.95–1.05 1.15–1.25 1.35–1.45 1.55–1.65 >1.75
Log10 [T (relative value)]
Frequency 0 20 40 60 80 100 120 140 160 0-0 .2 0. 2-0 .4 0. 4-0 .6 0. 6-0 .8 0. 8-1 .0 1. 0-1 .2 1. 2-1 .4 1. 4-1 .6 1. 6-1 .8 1. 8-2 .0 2. 0-2 .2 2. 2-2 .4 2. 4-2 .6 2. 6-2 .8 2. 8-3 .0 3. 0-3 .2 3. 2-3 .4 3. 4-3 .6 3. 6-3 .8 3. 8-4 .0 4. 0-4 .2 4. 2-4 .4 4. 4-4 .6 4. 6-4 .8 4. 8-5 .0 >5 N(relative value) Frequency 0 20 40 60 80 100 120 140 160 <-1 .7 5 -1 .6 5 – -1 .5 5 -1 .4 5 – -1 .3 5 -1 .2 5 – -1 .1 5 -1 .0 5 – -0 .9 5 -0 .8 5 – -0 .7 5 -0 .6 5 – -0 .5 5 -0 .4 5 – -0 .3 5 -0 .2 5 – -0 .1 5 -0 .0 5 – 0 .0 5 0 .1 5–0 .2 5 0 .3 5–0 .4 5 0. 5 5 – 0 .6 5 0. 7 5 – 0 .8 5 0. 9 5 – 1 .0 5 1. 1 5 – 1 .2 5 1. 3 5 – 1 .4 5 1. 5 5 – 1 .6 5 >1 .7 5
Log10 [N (relative value)]
Frequency 0 20 40 60 80 100 120 140 160 0-0 .2 0. 2-0 .4 0. 4-0 .6 0. 6-0 .8 0. 8-1 .0 1. 0-1 .2 1. 2-1 .4 1. 4-1 .6 1. 6-1 .8 1. 8-2 .0 2. 0-2 .2 2. 2-2 .4 2. 4-2 .6 2. 6-2 .8 2. 8-3 .0 3. 0-3 .2 3. 2-3 .4 3. 4-3 .6 3. 6-3 .8 3. 8-4 .0 4. 0-4 .2 4. 2-4 .4 4. 4-4 .6 4. 6-4 .8 4. 8-5 .0 >5
DAP (relative value)
Frequency 0 20 40 60 80 100 120 140 160 <-1 .7 5 -1 .6 5 – -1 .5 5 -1 .4 5 – -1 .3 5 -1 .2 5 – -1 .1 5 -1 .0 5 – -0 .9 5 -0 .8 5 – -0 .7 5 -0 .6 5 – -0 .5 5 -0 .4 5 – -0 .3 5 -0 .2 5 – -0 .1 5 -0 .0 5 – 0. 05 0. 1 5 – 0 .2 5 0. 3 5 – 0 .4 5 0. 5 5 – 0 .6 5 0 .7 5–0 .8 5 0 .9 5–1 .0 5 1 .1 5–1 .2 5 1 .3 5–1 .4 5 1. 5 5 – 1 .6 5 >1 .7 5
Log10 [DAP (relative value)]
Frequency
Fig. 2 Distribution of the fluoroscopy time, the number of frames and the DAP in relative values (the absolute value is divided by the geometric mean for the given type examination) in linear (left) and
logarithmic (right) scales. Theses distributions are associated with 995 examinations (14 types)
Regarding electrophysiological study (EX06), thermo-ablation (EX12) and the procedure combining the two (EX14), they are characterised by almost no frame acquisition. Two of the three centres that provided data
for these types of examinations used fluoroscopy exclu-sively. Thermo-ablation involves a fluoroscopy time six times higher than electrophysiological study on average. The DAPs involved are quite high in some cases (up to
EX02 ; N= 94 EX04 ; N= 41 0 4 8 12 16 20 Frequency EX01 ; N= 86 0 2 4 6 8 10 12 Frequency EX03 ; N= 91 0 5 10 15 20 25 Frequency 0 2 4 6 8 Frequency EX05 ; N= 184 0 10 20 30 40 Frequency EX06 ; N= 24 0 1 2 3 4 5 6 Frequency EX07 ; N= 70 0 2 4 6 8 10 12 Frequency EX08 ; N= 56 0 2 4 6 8 Frequency EX09 ; N= 58 0 2 4 6 8 10 12 14 Frequency EX10 ; N= 72 0 2 4 6 8 10 12 Frequency EX11 ; N= 80 0 4 8 12 16 20 Frequency EX12 ; N= 42 2 3 4 5 6 Frequency EX13 ; N= 78 0 4 8 12 16 20 <-1 .7 5 -1 .5 5 – .1 .4 5 -1 .2 5 – -1 .1 5 -0 .9 5 – -0 .8 5 -0 .6 5 – -0 .5 5 -0 .3 5 – -0 .2 5 0 .0 5–0 .1 5 0 .3 5–0 .4 5 0. 65 – 0 .7 5 0. 95 – 1 .0 5 1. 15 – 1 .2 5 1. 45 – 1 .5 5 >1 .7 5
Log10 [DAP (relative value)]
Frequency EX14 ; N= 21 0 1 2 3 4 5 < -1. 75 -1 .5 5 – .1 .4 5 -1 .2 5 – -1 .1 5 -0 .9 5 – -0 .8 5 -0 .6 5 – -0 .5 5 -0 .3 5 – -0 .2 5 0. 05 – 0 .1 5 0. 35 – 0 .4 5 0. 65 – 0 .7 5 0. 95 – 1 .0 5 1. 15 – 1 .2 5 1. 45 – 1 .5 5 >1 .7 5
Log10 [DAP (relative value)]
Frequency
Fig. 3 Distributions of the DAP in relative values (the absolute value is divided by the geo-metric mean for the given type examination) in logarithmic scale for each of the 14 types of examinations
about 500 Gy cm2), with average values of 13 and 128 Gy cm2 for electrophysiology and thermo-ablation, respec-tively. In the UK average values of 17.1 and 33.1 Gy cm2 are reported by NRPB [6] for these types of examinations, respectively, whereas McFadden et al. reported an average DAP of 123 Gy cm2and a maximum value of 430 Gy cm2 for RF ablation [28].
Hepatic embolisation (EX07) and bilary drainage (EX08) use on average the same fluoroscopy time, but on average the former requires 4.5 times more frames than the latter. The DAPs registered are on average 463 and 244 Gy cm2, respectively. These types of examinations are
performed on units without Cu filtration. Miller et al. [18] reported average DAPs of 282 and 70.6 Gy cm2for hepatic embolisation and bilary drainage, respectively, which is about a factor of 2 lower than our values. It is worth mentioning that for hepatic embolisation the average T and N in this study are 22 min and 140 frames, whereas Miller et al. reported 16.8 min and 216 frames, respectively. The lower value for the DAP is due to the fact that in the RAD-IR study the fluoroscopy units were used with Cu filtration. It appears from Table3that a fluoroscopy time about three times higher is required for cerebral embolisation (EX09-interventional) than for cerebral angiography
(EX03diag -0.5 1.0 1.5 2.0
EX01(4,89) EX02 (5,94) EX03 (5,91) EX04 (2,41)
EX05 (7,184) EX06 (2,24) EX07 (4,70) EX08 (5,56) EX09 (5,58) EX10 (5,72) EX11 (4,80) EX12 (2,42) EX13 (3,78) EX14 (1,21)
75% overall / 75% specific
Fluoroscopy time Number of frames DAP
Fig. 4 Ratio of the 75% values of the fluoroscopy time, the number of frames and the DAP for the various types of exam-inations, established in two ways: from the distribution re-lated to the whole set of data (overall) and from the distribu-tion related to the type of examination (specific). The number of centres involved and the number of examinations registered are given between brackets on the x axis
Table 4 Reference levels (RL) for the 14 types of examinations considered
Examination code
Type of examination T(min) Number of
frames
DAP (Gy cm2) Diagnostic
EX01 Barium meal 7 40 60
EX02 Lower limb and iliac angiography 8 150 210
EX03 Cerebral angiography 15 480 125
EX04 Barium enema 10 25 150
EX05 Coronary angiography 7 1,400 80
EX06 Electrophysiology 1 480 10
Interventional
EX07 Hepatic embolisation 30 160 620
EX08 Biliary drainage and stent insertion 25 30 240
EX09 Cerebral embolisation 50 800 440
EX10 Iliac dilatation and stent insertion 25 200 460
EX11 Percutaneous coronary intervention 20 1,500 110
EX12 Cardiac thermo-ablation 20 800 140
Combined
EX13 Coronary angiography + percutaneous coronary
intervention
20 2,800 260
nostic). The average DAP related to cerebral embolisation is 335 Gy cm2, but higher values up to 1,345 Gy cm2 are registered. Cerebral embolisations are performed in three specialised centres on modern units with Cu filtration; they still deliver high doses due to the complexity of the procedure. The data published in the literature are compar-able to the figures established in the work. Brambilla et al. [17] reported an average DAP of 329 Gy cm2 and a maximum of 1,221 Gy cm2for this type of examination. On the other hand, Miller et al. [18] reported an average value of 320 Gy cm2and a maximum of 1,351 Gy cm2.
Similarly, the mean fluoroscopy times for iliac dilatation and stent insertion (EX10-interventional) differ by a factor of three from lower limb angiography (EX2-diagnostic). For iliac dilatation and stent insertion, a large variability of the field area is registered, depending on the localisation of the lesion. The DAP related to iliac dilatation and stent insertion is 344 Gy cm2 on average, with a maximum of 1,122 Gy
cm2. Miller et al. [18] reported an average DAP of 203 Gy cm2and a maximum of 886 Gy cm2. The DAPs registered in the RAD-IR are therefore 70% lower on average than the data established in this work; also the fluoroscopy times are comparable and the number of frames is lower in our case: on average 19.2 min and 158 frames in this investigation vs. 17.4 min and 227 frames in the RAD-IR survey. This is due to the use of Cu filtration in the latter case.
Figure2shows that the distributions of the fluoroscopy time, the number of frames and the DAP are slightly different, but with similar shape. The full width at half maximum related to the distribution on a logarithmic scale gives a good indication of the data variability. The shape of the distribution of the pooled examinations (Fig. 2) is similar to the distributions related to specific examinations (Fig.3), and this holds for the T and N distributions, too. This similarity was confirmed by the Kolmogorov-Smirnov test (a P-value between 12.4% and 62% for ten
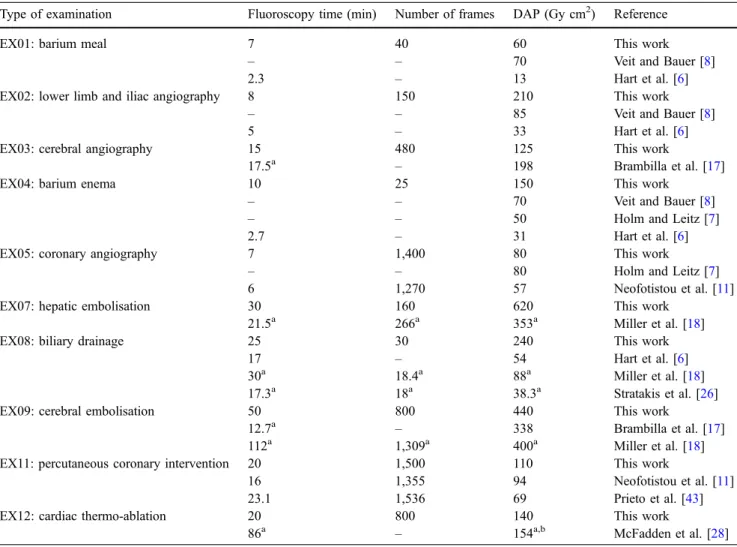
spe-Table 5 RL comparisons with values published in the literature
Type of examination Fluoroscopy time (min) Number of frames DAP (Gy cm2) Reference
EX01: barium meal 7 40 60 This work
– – 70 Veit and Bauer [8]
2.3 – 13 Hart et al. [6]
EX02: lower limb and iliac angiography 8 150 210 This work
– – 85 Veit and Bauer [8]
5 – 33 Hart et al. [6]
EX03: cerebral angiography 15 480 125 This work
17.5a – 198 Brambilla et al. [17]
EX04: barium enema 10 25 150 This work
– – 70 Veit and Bauer [8]
– – 50 Holm and Leitz [7]
2.7 – 31 Hart et al. [6]
EX05: coronary angiography 7 1,400 80 This work
– – 80 Holm and Leitz [7]
6 1,270 57 Neofotistou et al. [11]
EX07: hepatic embolisation 30 160 620 This work
21.5a 266a 353a Miller et al. [18]
EX08: biliary drainage 25 30 240 This work
17 – 54 Hart et al. [6]
30a 18.4a 88a Miller et al. [18]
17.3a 18a 38.3a Stratakis et al. [26]
EX09: cerebral embolisation 50 800 440 This work
12.7a – 338 Brambilla et al. [17]
112a 1,309a 400a Miller et al. [18]
EX11: percutaneous coronary intervention 20 1,500 110 This work
16 1,355 94 Neofotistou et al. [11]
23.1 1,536 69 Prieto et al. [43]
EX12: cardiac thermo-ablation 20 800 140 This work
86a – 154a,b McFadden et al. [28]
a
Established from the mean value
bThe authors proposed three RLs of 100, 300 and 550 Gy cm2to provide an indication of the risk of the patient suffering transient erythema, main erythema and moist desquamation, respectively
cific distributions, between 1.7% and 4.2% for three specific distributions and 0.77% for one specific distribution).
The set of RLs proposed in this study are compared to data published in the literature for ten types of examinations as shown in Table5. In some cases the RL was established by multiplying the published mean value by a factor as described above. Table 5 reveals significant differences with the UK data, which are noticeably low. The RLs established in this work are higher than the values proposed in Germany for barium meal and enema and for lower limb angiography. But our data compare well with the RLs published by Brambilla et al. [17], Neofotistou et al. [11], Miller et al. [18], McFadden et al. [28] and Prieto et al. [43].
Conclusion
This study allowed the collection of useful data concerning 1,000 examinations corresponding to 14 types: six diag-nostic, six interventional and two combined. A large variability of the dose was registered related to several factors such as the degree of complexity of the examina-tion, the experience of the practitioner and differences in the definition of the examination and in the technique used. The results of this investigation indicate that interven-tional procedures deliver on average doses three times higher than diagnostic examinations. The dosimetric data base set up in this work allowed the establishment of national RL values for the 14 types of examinations investigated. The data collected (T, N and DAP) were divided by the mean value for the given type of exami-nation. The distribution of the whole set of relative values was then used to deduce the RL using the third-quartile method. The RLs for T range from 1 min for electrophys-iology to 50 min for cerebral embolisation, thus covering one order of magnitude. The RLs for N range from 25
frames for barium enema to 2,800 frames for the combined procedure coronary angiography + percutaneous coronary intervention, i.e., more than two orders of magnitude. Concerning the DAP, the RLs range from 10 Gy cm2 for electrophysiology to 620 Gy cm2for hepatic embolisation, i.e., a difference of a factor of 40.
The RL concept cannot be applied to a specific examination of one patient for the types of examinations considered here, but it is highly recommended to perform a check, for instance, after every 20 examinations, to see if on average the RL is exceeded systematically or not, and to take the appropriate measures if necessary. Moreover, in order to prevent skin injuries, the entrance surface doses should be monitored either by direct measurements or by converting the DAP using appropriate conversion factors published in the literature, and patients who have under-gone examinations with an entrance skin dose above 1 Gy, particularly children, should be followed up.
The 75th-percentile values established in this work were found to be higher than the RLs recommended in Germany and the UK. This might be due to the fact that the survey covered university hospitals mainly, where the proportion of“heavy” cases might be relatively high and where there is a high number of junior radiologists undergoing their training. These high dose values should prompt a discussion between the participating radiologists concern-ing the specifications of the units, the choice of the protocols and technical parameters and the training of the staff. In particular, the use of Cu filtration should be discussed within the community of radiologists.
Acknowledgments This research project was funded by the Swiss Federal Office of Public Health (contract no. 99.000.729). The authors are grateful to all the radiologists, cardiologists, medical physicists and radiographers who collaborated with us or provided assistance in the participating hospitals and clinics during this survey.
References
1. Aroua A, Burnand B, Decka I, Vader JP, Valley JF (2002) Nation-wide survey on radiation doses in diagnostic and inter-ventional radiology in Switzerland in 1998. Health Phys 83(1):46–55 2. International Commission on
Radiologi-cal Protection (2000) Avoidance of radiation injuries from medical interven-tional procedures. ICRP Publication 85
3. European Union (1997) On health protection of individuals against the dangers of ionising radiation in relation to medical exposure, Council Directive 97/43/Euratom, Official J Eur Commun L 180:22–27
4. International Commission on Radio-logical Protection (2001) Diagnostic reference levels in medical imaging. ICRP Committee 3, (draft)
5. European Commission (1999) Guidance on diagnostic reference levels (DRLs) for medical exposures. Radiat Protect 109
6. Hart D, Hiller MC, Wall BF (2002) Doses to patients from medical X-ray examinations in the UK-2000 Review. Report NRPB-W14. National Radio-logical Protection Board, Didcot 7. Holm LE, Leitz W (2002) The Swedish
Radiation Protection Authority’s regu-lations and general advice on diagnostic standard doses and reference levels within medical X-ray diagnostics. SSI FS 2002:2 Statens Strålskyddsinstitut Stockholm
8. Veit R, Bauer B (2003) Introduction of diagnostic reference levels into diag-nostic radiology in Germany. Internal report. Federal Office for Radiological Protection, Salzgitter
9. Marshall NW, Chapple CL, Kotre CJ (2000) Diagnostic reference levels in interventional radiology. Phys Med Biol 45:3833–3846
10. Van de Putte S, Verhaegen F, Taeymans Y, Thierens H (2000) Correlation of patient skin doses in cardiac interven-tional radiology with dose-area product. Br J Radiol 73:504–513 11. Neofotistou V, Vano E, Padovani R,
Kotre J, Dowling A, Toivonen M, Kottou S, Tsapaki V, Willis S, Bernardi G, Faulkner K (2003) Preliminary reference levels in interventional car-diology. Eur Radiol 13:2259–2263 12. Martin CJ (2004) A review of factors
affecting patient doses for barium enemas and meals. Br J Radiol 77:864–868
13. Ben Salem D, Martin D, Aho LS, Walker PM, Lalande A, Brunotte F, Krause D, Ricolfi F (2004) Analysis of variation in delivered dose in diagnostic and therapeutic cerebral angiography. (in French). J Neuroradiol 31:379–383 14. Bor D, Sancak T, Olgar T, Elcim Y,
Adanali A, Sanlidilek U, Akyar S (2004) Comparison of effective doses obtained from dose-area product and air kerma measurements in interventional radiology. Br J Radiol 77:315–322 15. Delichas MG, Psarrakos K, Giannoglou
G, Molyvda-Athanasopoulou E, Hatziioannou K, Papanastassiou E (2005) Skin doses to patients under-going coronary angiography in a Greek hospital. Radiat Prot Dosim 113 (4):449–452
16. Persliden J (2005) Patient and staff doses in interventional X-ray proce-dures in Sweden. Radiat Prot Dosim 114(1–3):150–157
17. Brambilla M, Marano G, Dominietto M, Cotroneo AR, Carriero A (2004) Patient radiation doses and reference levels in interventional radiology Radiol Med 107:408–418
18. Miller DL, Balter S, Cole PE, Lu HT, Schuler BA, Geisinger M, Berenstein A, Albert R, Georgia JD, Noonan PT, Cardella JF, St. George J, Russell EJ, Malisch TW, Vogelzang RL, Miller GL III, Anderson J (2003) Radiation doses in interventional radiology procedures: The RAD-IR study. Part I: overall measures of dose. J Vasc Interv Radiol 14:711–727
19. Miller DL, Balter S, Cole PE, Lu HT, Berenstein A, Albert R, Schuler BA, Georgia JD, Noonan PT, Russell EJ, Malisch TW, Vogelzang RL, Geisinger M, Cardella JF, St George J, Miller GL III, Anderson J (2003) Radiation doses in interventional radiology procedures: The RAD-IR study. Part II: skin dose. J Vasc Interv Radiol 14:977–990 20. Balter S, Schuler BA, Miller DL, Cole
PE, Lu HT, Berenstein A, Albert R, Georgia JD, Noonan PT, Russell EJ, Malisch TW, Vogelzang RL, Geisinger M, Cardella JF, St. George J, Miller GL III, Anderson J (2004) Radiation doses in interventional radiology procedures: The RAD-IR study. Part III: dosimetric performance of the interventional fluo-roscopy units. J Vasc Interv Radiol 15:919-926
21. Davies AG, Cowen AR, Kengyelics SM, Moore J, Pepper C, Cowan C, Sivanathan MU (2006) X-ray dose reduction in fluoroscopically guided electrophysiology procedures. Pacing Clin Electrophysiol 29(3):262–271 22. Perisinakis K, Raissaki M, Damilakis J,
Stratakis J, Neratzoulakis J,
Gourtsoyiannis N (2006) Fluoroscopy-controlled voiding cystourethrography in infants and children: are the radia-tion risks trivial? Eur Radiol 16 (4):846–851
23. Peterzol A, Quai E, Padovani R, Bernardi G, Kotre CJ, Dowling A (2005) Reference levels in PTCA as a function of procedure complexity. Radiat Prot Dosim 117(1–3):54–58 24. Dragusin O, Desmet W, Heidbuchel H,
Padovani R, Bosmans H (2005) Radi-ation dose levels during interventional cardiology procedures in a tertiary care hospital. Radiat Prot Dosim
117(1–3):231–235
25. Goni H, Tsalafoutas IA, Tzortzis G, Pappas P, Bouzas N, Loulakas J, Georgiou A, Georgiou E, Yakoumakis EN (2005) Radiation doses to patients from digital substraction angiography. Radiat Prot Dosim 117(1–3):251–255 26. Geijer H, Persliden J (2004) Radiation
exposure and patient experience during percutaneous coronary intervention using radial and femoral artery access. Eur Radiol 14(9):1674–1680
27. Stratakis J, Damilakis J, Hatzidakis A, Perisinakis K, Gourtsoyiannis N (2006) Radiation dose and risk from fluoros-copically guided percutaneous transhe-patic biliary procedures. J Vasc Interv Radiol 17(1):77–84
28. McFadden SL, Mooney RB, Shepherd PH (2002) X-ray dose and associated risks from radiofrequency catheter ablation procedures. Br J Radiol 75:253–265
29. Chu RY, Thomas G, Maqbool F (2006) Skin entrance radiation dose in an interventional radiology procedure. Health Physics 91(1):41–46
30. Hansson B, Karambatsakidou A (2000) Relationships between entrance skin dose, effective dose and dose area product for patients in diagnostic and interventional procedures. Radiat Prot Dosim 90(1–2):141–144
31. Karambatsakidou A, Tornvall P, Saleh N, Chouliaras T, Löfberg P-O, Fransson A (2005) Skin dose alarm levels in cardiac angiography proce-dures: is a single DAP value sufficient? Br J Radiol 78:803–809
32. Chida K, Saito H, Otani H, Kohzuki M, Takahashi S, Yamada S, Shirato K, Zuguchi M (2006) Relationship be-tween fluoroscopic time, dose-area product, body weight, and maximum radiation skin dose in cardiac interven-tional procedures. Am J Roentgenol 186(3):774–778
33. Vano E, Gonzalez L, Ten JE, Fernandez JM, Guibelalde E, Macaya C (2001) Skin dose and dose-area product values for interventional cardiology proce-dures. Br J Radiol 74:48–55 34. Office fédéral de la santé publique.
Division de radioprotection. Niveaux de référence diagnostiques (NRD) pour les examens de radiographie. Directive R-08-04. Etablie le 7 avril 2004. Accessible en ligne sur:http://www. bag.admin.ch/strahlen/lois/pdf/ R-08-04-mf.pdf
35. Accessible on:http://www.bag.admin. ch/strahlen/lois/pdf/NRDCalc1.2.xls
36. Aroua A, Decka I, Burnand B, Vader JP, Valley JF (2002) Dosimetric aspects of a national survey of diagnostic and interventional radiology in Switzerland. Med Phys 29(10):2247–2259
37. Aroua A, Besançon A, Buchillier-Decka I, Trueb P, Valley JF, Verdun FR, Zeller W (2004) Adult reference levels in diagnostic and interventional radiol-ogy for temporary use in Switzerland. Radiat Prot Dosim 111(3):289–295 38. Llorca AL, Guibelalde E, Vañó N, Ruiz
MJ (1993) Analysis of image quality parameters using a combination of an ANSI type phantom and the Leeds TOR(CDR) Test object in simulations of simple examinations. Radiat Prot Dosim 49:47–49
39. Limpert E, Stahel WA, Abbt M (2001) Log-normal distributions across the sciences: keys and clues. Bioscience 51(5):341–352
40. Kock M, Adriaensen M, Pattynama P, Van Sambeek M, Van Urk H, Stijnen T, Hunink M (2005) DSA versus multi-detector row CT angiography in pe-ripheral arterial disease: randomized controlled trial. Radiology
237:727–737
41. Fraioli F, Catalano C, Napoli A, Francone M, Venditti F, Danti M, Pediconi F, Passariello R (2006) Low-dose multidetector-row CT angiogra-phy of the infra-renal aorta and lower extremity vessels: image quality and diagnostic accuracy in comparison with standard DSA. Eur Radiol
16(1):137–146
42. Maeder M, Verdun FR, Stauffer JC, Ammann P, Rickli H (2005) Radiation exposure and radiation protection in interventional cardiology.
Kardiovaskuläre Medizin 8:124–132 43. Prieto C, Vano E, Fernandez JM, Galvan
C, Sabate M, Gonzalez L, Martinez D (2006) Six years experience in intracor-onary brachytherapy procedures: patient doses from fluoroscopy. Br J Radiol DOI10.1259/bjr/75766147. Published online before print June 22