HAL Id: hal-02367578
https://hal.archives-ouvertes.fr/hal-02367578
Submitted on 16 May 2020
HAL is a multi-disciplinary open access
archive for the deposit and dissemination of
sci-entific research documents, whether they are
pub-lished or not. The documents may come from
teaching and research institutions in France or
abroad, or from public or private research centers.
L’archive ouverte pluridisciplinaire HAL, est
destinée au dépôt et à la diffusion de documents
scientifiques de niveau recherche, publiés ou non,
émanant des établissements d’enseignement et de
recherche français ou étrangers, des laboratoires
publics ou privés.
Mediterranean basins
Yves Tramblay, L. Mimeau, F. Vinet, Eric Sauquet, Luc Neppel
To cite this version:
Yves Tramblay, L. Mimeau, F. Vinet, Eric Sauquet, Luc Neppel. Detection and attribution of flood
trends in Mediterranean basins. Hydrology and Earth System Sciences, European Geosciences Union,
2019, 23, pp.4419-4431. �10.5194/hess-23-4419-2019�. �hal-02367578�
https://doi.org/10.5194/hess-23-4419-2019 © Author(s) 2019. This work is distributed under the Creative Commons Attribution 4.0 License.
Detection and attribution of flood trends in Mediterranean basins
Yves Tramblay1, Louise Mimeau1, Luc Neppel1, Freddy Vinet2, and Eric Sauquet3
1HSM (Univ. Montpellier, CNRS, IRD), 300 Av. du Professeur Emile Jeanbrau, 34090 Montpellier, France 2GRED (Univ. Paul Valéry, IRD), 2 rue du Pr Henri Serres, 34000 Montpellier, France
3IRSTEA, UR RiverLy, Centre de Lyon-Villeurbanne, 5 rue de la Doua CS 20244, 69625 Villeurbanne, France
Correspondence: Yves Tramblay (yves.tramblay@ird.fr) Received: 14 June 2019 – Discussion started: 17 June 2019
Revised: 23 September 2019 – Accepted: 6 October 2019 – Published: 30 October 2019
Abstract. Floods have strong impacts in the Mediterranean region and there are concerns about a possible increase in their intensity due to climate change. In this study, a large database of 171 basins located in southern France with daily discharge data with a median record length of 45 years is considered to analyze flood trends and their drivers. In ad-dition to discharge data, outputs of precipitation, tempera-ture, evapotranspiration from the SAFRAN reanalysis and soil moisture computed with the ISBA land surface model are also analyzed. The evolution of land cover in these basins is analyzed using the CORINE database. The trends in floods above the 95th and 99th percentiles are detected by the Mann–Kendall test and quantile regression techniques. The results show that despite the increase in extreme precipita-tion reported by previous studies, there is no general ten-dency towards more severe floods. Only for a few basins is the intensity of the most extreme floods showing signifi-cant upward trends. On the contrary, most trends are towards fewer annual flood occurrences above both the 95th and 99th percentiles for the majority of basins. The decrease in soil moisture seems to be an important driver for these trends, since in most basins increased temperature and evapotran-spiration associated with a precipitation decrease are leading to a reduction in soil moisture. These results imply that the observed increase in the vulnerability to these flood events in recent decades is mostly caused by human factors such as increased urbanization and population growth rather than climatic factors.
1 Introduction
A number of studies have now established that extreme pre-cipitation could increase due to climate change, particularly in the Mediterranean (Westra et al., 2013; Polade et al., 2017; Ribes et al., 2019; Tramblay and Somot, 2018). Changes in extreme rainfall would be caused by an increase in the pre-cipitable water content in the atmosphere, related to increas-ing temperatures, accordincreas-ing to the principle of Clausius– Clapeyron thermodynamics (Drobinki et al., 2016; Pfahl et al., 2017). Nevertheless, this relationship has a high variabil-ity in space, related to temperatures and available humidvariabil-ity (Wasko et al., 2016). Several studies observed an increase in the number of dry days associated with increased rainfall intensities, suggesting that dry periods in these areas would become longer, but that precipitation could be more extreme when they occur (Paxian et al., 2015; Polade et al., 2017). Nevertheless, the increase in extreme rainfall would not off-set the decrease in precipitation totals, as the drop in cumula-tive rainfall associated with the decrease in the frequency of low to moderate rainfall is expected to predominate over the gains resulting from the intensification of extreme precipita-tion (Polade et al., 2014).
Besides changes in precipitation, an increase in rainfall in-tensity does not necessarily imply an increase in flood risk (Ivancic and Shaw, 2015; Woldemeskel and Sharma, 2016). Indeed, for a given rainfall accumulation, the runoff coef-ficient can be very variable in time and space in differ-ent basins due to complex interactions between precipitation and infiltration processes on hillslopes, which can strongly modulate flood magnitude (Woldemeskel and Sharma, 2016; Wasko and Sharma, 2017; Bennett et al., 2018). Most global studies on flood trends indicate a decrease in flood
inten-sity (Do et al., 2017; Wasko and Sharma, 2017; Sharma et al., 2018). Yet, these trends are highly variable in space for different regions of the globe (Yin et al., 2018; Najibi and Devineni, 2018). The attribution of these trends is rather un-certain, while Yin et al. (2018) relate an increase in floods with increased temperatures; Najibi and Devineni (2018) and Hodgkins et al. (2018) conclude that trends in the flood frequency and duration can be mostly attributed to long-term climate variability. Nonetheless, as noted by Whit-field (2012), flood-generating processes do not take place at the global but rather a relatively local scale, making general-izations about flooding in future climates difficult and uncer-tain. For Mediterranean basins, Blöschl et al. (2017) indicate later winter floods and Mangini et al. (2018) noted a tendency towards increasing flood magnitude and decreasing flood fre-quency. These finding are consistent with trends detected by Mediero et al. (2014) in Spain and Giuntoli et al. (2012) for the south of France.
While much work has been done to estimate future cli-matic conditions, changes in hydrological variables, includ-ing surface conditions, can also strongly modulate climatic trends (Knighton et al., 2017). In particular, it is known that in many catchments the initial soil moisture conditions prior to flood events play a key role in flood generation (Brocca et al., 2008; Tramblay et al., 2010; Raynaud et al., 2015; Woldemeskel and Sharma, 2016; Wasko and Sharma, 2017; Uber et al., 2018; Wasko and Nathan, 2019), and its temporal change has not been much analyzed up to now. Between two episodes of rain, the base flow of the perennial rivers origi-nates from the draining of the water contained in the soils and for some basins from the aquifers. The capacity of the soil to contain water and restore it to generate runoff depends on its characteristics (e.g., texture, structure, porosity) but also on the amount of water it already contains at the beginning of a rain episode. Thus, a quasi-saturated soil will not be able to store a lot of water, which, being unable to infiltrate the soil, will contribute directly to runoff. In most cases, there is a nonlinear relationship between the flow rate and the ini-tial saturation state of the soil, usually with a threshold value of moisture above which a rapid flow response to a rainy episode is observed (Norbiato et al., 2008; Viglione et al., 2009; Penna et al., 2011). Difference in soil types could in-duce different relationships between floods and initial condi-tions (Grillakis et al., 2016; Camarasa-Belmonte, 2016). For intermittent (seasonal runoff only) and ephemeral streams (runoff only after a rain event), the impact of antecedent soil moisture is more complex and strongly dependent on the soil type and geological context (in the presence of karst in par-ticular). In smaller basins, the impact of initial soil moisture content is usually not significant and it increases with catch-ment size (Zhang et al., 2011).
For some Mediterranean basins, the increase in heavy rain-fall associated with a reduced number of rainy days could de-crease the soil water content and therefore inde-crease infiltra-tion capacity, hence reducing runoff. On the other hand, more
intense rains in urbanized, impervious areas or on bare soils that are subject to crusting effects could increase runoff and therefore the magnitude of floods. It is therefore necessary to use hydrological or surface models capable of representing these processes. Using the ISBA land surface scheme with different downscaling methods, Quintana-Seguí et al. (2011) found a future increase in floods corresponding to a 10-year return level in southern French basins, but with different magnitudes depending on the basins. Camici et al. (2017), in a study on the impacts of climate change on floods in cen-tral Italy, noted a greater sensitivity of basins with perme-able soils to changing climatic conditions. Similarly, Piras et al. (2016) in Sardinia found that impermeable and flat sub-basins are predicted to experience more intense flood events in future scenarios, while more permeable and steep sub-catchments will have an opposite tendency. However, there are systematic differences between projections of changes in flood hazards in southern Europe (Italy, Greece, Iberian Peninsula) in most European and global studies using large-scale hydrological models (Kundzewicz et al., 2017). Indeed, some studies point towards an increase in southern Europe (Quintana-Seguí et al., 2011; Alfieri et al., 2015) while oth-ers suggests a decrease (Donnelly et al., 2017; Thober et al., 2018). This is due to different GCM, RCM, scenario and downscaling approaches but also the use of large-scale hydrological model usually not calibrated and validated for all basins. This type of global (or large-scale) hydrological model (e.g., LISFLOOD, VIC, HYPE) is usually not adapted to small river basins less than 500 km2, which is the typical catchment size found in the Mediterranean region.
Prior to making future projections on flood hazard, there is a need to understand the main drivers of changes for floods and the links between floods and climate character-istics (Merz et al., 2014). Indeed, understanding the potential flood drivers and their changes may be more relevant than predictions of uncertain flood changes as noted by Blöschl et al. (2015). The objective of this study is to analyze trends in flood characteristics for a large sample of French Mediter-ranean basins and to relate these trends to climate and land use dynamics. This is done using statistical tests for the de-tection of trends and quantile regression models to relate high discharge quantiles to different climatic drivers.
2 Data
A total of 171 basins located in southern France were se-lected with a minimum of 20 years of daily discharge data. The selection of basins is based on the availability of long time series of daily discharge, and the selected basins have no significant human influence on flow, according to a previous database assembled by Sauquet and Catalogne (2011) and Snelder et al. (2013). The median record length is 45 years and 56 stations have more than 50 years of data; more than 100 stations have a complete record, with less than
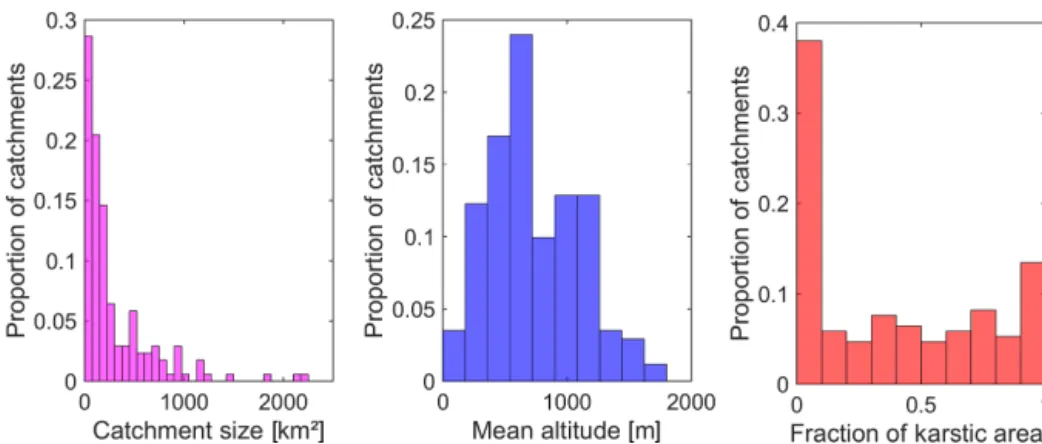
5 % missing data, between 1970 and 2010. All the catch-ments selected have a Mediterranean climate, with a pre-cipitation deficit during summer when the low flows are recorded. These basins are experiencing flash flood events caused by intense rainfall events, corresponding to the only region in France where rainfall can exceed 200 mm d−1(http: //pluiesextremes.meteo.fr, last access: 26 October 2019) with the maximum occurrence between September and Novem-ber. Most basins have a catchment area lower than 500 km2 and located below 1000 m (Fig. 1). The proportion of karstic areas for each basin has been obtained from the BDLISA database (available here: https://bdlisa.eaufrance.fr/, last ac-cess: 26 October 2019), which provides a delineation of karst systems in France (Schomburgk et al., 2016). For 66 basins, more than 50 % of their catchment areas consist of carbona-ceous superficial formations, indicative of karstic areas. This means that the rainfall–runoff relationship in this type of basin can be strongly modulated by the presence of karst (Jourde et al., 2007).
In addition to daily discharge data, different variables have been retrieved from the SAFRAN-ISBA-MODCOU (SIM) hydro-meteorological model (Habets et al., 2008). SIM is based on the SAFRAN reanalysis over France (Quintana-Seguí et al., 2008), which is based on observed data, and provides rainfall, snowfall, temperature and reference evap-otranspiration for an 8 km × 8 km grid over France at the daily time step from 1958 until present. The SAFRAN re-analysis is used to force the ISBA land surface scheme of Météo-France (Habets et al., 2008), to provide among other variables the actual evapotranspiration and the surface and root zone soil moisture at the same spatial and temporal res-olution than ISBA. Tramblay et al. (2010) have shown that the soil moisture from the root zone simulated by ISBA is an appropriate indicator of soil moisture prior to flood events in French Mediterranean catchments. The catchment boundaries of the 171 basins selected have been extracted from the HydroSheds database (https://hydrosheds.org/, last access: 26 October 2019) providing flow accumulation and flow direction maps at the 15 arcsec resolution. Then the to-tal precipitation, rainfall, air temperature, actual and refer-ence evapotranspiration from SAFRAN and the surface and root zone soil moisture from ISBA have been extracted and averaged over every catchment.
The evolution of land cover between 1990 and 2018 in the 171 basins was analyzed using the Corine Landcover inven-tory (CLC1990 and CLC 2018). Corine Landcover provides an inventory of 44 classes over the European region (Büt-tner et al., 2002). CLC1990 and CLC2018 are respectively based on Landsat-5 (50 m spatial resolution) and Sentinel-2 (10 m spatial resolution) satellite images. A limitation of the CLC inventory lies in the difference of accuracy between the CLC1990 and CLC2018 products, which may introduce an uncertainty in the estimation of the evolution of the land cover in the studied basins.
3 Methods
Two approaches are considered to evaluate trends. The first approach, presented in Sect. 3.1 thereafter, relies on the Mann–Kendall (MK) test (Mann, 1945) applied to the an-nual number of flood events above two different percentiles, the 95th and the 99th computed on the whole time series and also on the magnitude of these events. Using two dif-ferent thresholds, which are commonly used for the analysis of floods, allows the trends on moderate (above the 95th per-centile) and more severe (above the 99th perper-centile) flood events to be considered separately.
The second approach presented in Sect. 3.2 is based on quantile regression (Koenker and Basset, 1978) to estimate the temporal trend magnitude in the 95th and 99th percentiles of daily runoff in all stations. The quantile regression method is also used to relate the change in runoff quantiles to changes in climate characteristics, hence providing a way to attribute the observed changes to their potential drivers.
Hydrological years are considered, starting 1 September and ending 31 August of the next calendar year. Years with more than 5 % missing days are removed. For the first ap-proach based on event characteristics, a de-clustering is re-quired so that consecutive daily threshold exceedances that belong to the same flood event are not included in the flood sample. A minimum of 2 d between two flood events is se-lected since it is the average duration of rainstorms in the region (Tramblay et al., 2013). This means, if for two con-secutive days the runoff is exceeding the threshold, only the maximum value is retained. Moreover, different values be-tween 1 and 5 d to separate the events have been tested and did not change the trend results.
3.1 Test for trends and regional significance
The Mann–Kendall test (Mann, 1945) is used for the trend detection. Several studies have noted that the presence of se-rial correlation may affect the results of trend analysis by in-creasing the variance of the test statistic (Khaliq et al., 2009; Renard et al., 2008). To overcome this limitation, Hamed and Rao (1998) proposed a corrected MK test statistic consider-ing an effective sample size that reflects the effect of serial correlation. This correction was applied in the present study. In addition to the MK test, the method of Sen (1968) is con-sidered to estimate the magnitude of trends. In the present study, trends are considered significant at the 10 % level; however, sensitivity tests performed for p ≤ 0.05, p ≤ 0.01 revealed very similar spatial trend patterns.
The significance level αlocalfor a statistical test is related
to a single test and is no longer valid when multiple tests are conducted (Wilks, 2016). When the number of tests being conducted increases, more significant values will be found. The goal of the false discovery rate (FDR) procedure intro-duced by Benjamini and Hochberg (1995) is to identify a set of at-site significance tests by controlling the expected
Figure 1. Catchment size, mean altitude and fraction of karstic areas.
proportion of falsely rejected null hypotheses that are ac-tually true. Renard et al. (2008), Khaliq et al. (2009) or Wilks (2016) demonstrated that the original FDR is robust to cross-correlations between locations and can work with any statistical test for which one can generate a p value. This FDR method is applied to the MK test results to check if the trends are regionally significant. The detected trends are gionally significant if at least one local null hypothesis is re-jected according to the global (or regional) significance level, αglobal (Wilks, 2016). For consistency with the local trend
analysis, the global significance level is also set to 10 % in the FDR procedure.
3.2 Quantile regression
As a complementary approach to detect trends in quantiles but also to investigate the relationship between floods and explanatory covariates, the quantile regression (Koenker and Basset, 1978) method is applied. Quantile regression could be seen as the extension of the ordinary least square (OLS) regression (Koenker and Machado, 1999; Villarini and Slater, 2017). In OLS, the conditional mean of the response variable is modeled with respect to one or more predictors and the sum of squared errors is minimized. For quantile regression, a conditional quantile of the response variable is modeled as a function of predictor(s), and an asymmetrically weighted sum of absolute errors is minimized to estimate the slope and intercept terms. In the present work, only linear relationships are considered with one single covariate at a time, while more complex forms of dependences could also be considered in quantile regression. The approach has been previously used to detect trends in extreme precipitation or floods by Vil-larini and Slater (2017), Yin et al. (2018) and Wasko and Nathan (2019).
Koenker and Machado (1999) introduced the R1 goodness-of-fit measure for quantile regression models. As for the R2in the case of OLS, R1lies between 0 and 1. Un-like R2, which measures the relative success of two models for the conditional mean function in terms of residual
vari-ance, R1measures the relative success of the corresponding quantile regression models for a specific quantile, by com-parison with a restricted model (with slope = 0), in terms of a weighted sum of absolute residuals (see Koenker and Machado, 1999). Consequently, R1constitutes only a local measure of goodness of fit for a particular quantile rather than a global measure over the entire conditional distribution, like R2. This measure can help to discriminate between different models using different covariates (e.g., precipitation or tem-perature). Higher R1values indicate that the model fits better to observations. In this study, this criterion is used to identify the best covariates that could explain the temporal variations in high runoff quantiles.
4 Results
4.1 Climatic and land cover trends
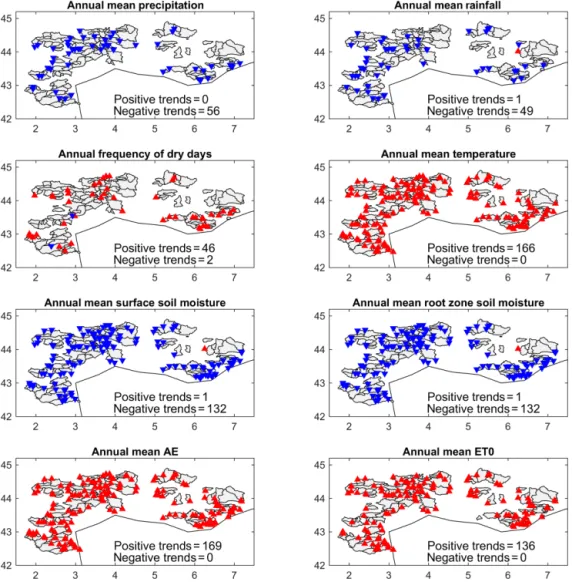
The climate trends have been analyzed for the whole period of available SAFRAN records, between 1958 and 2018. For each basin, the annual trends in precipitation, rainfall, tem-perature, soil moisture, actual and reference evapotranspira-tion have been analyzed with the Mann–Kendall test. From Fig. 2 and Table 1, a significant decrease in annual rainfall in 56 basins, an average of −20 %, accompanied by an in-crease in the frequency of dry days (with precipitation be-low 1 mm) for 46 basins can be seen. The snowfall is also decreasing in the same proportions (not shown). The sole ex-ception where an increase in rainfall is found is for the Asse River at Beyne-Chabrières on the western foothills of the Alps. This station has long time series spanning from 1983 to 2009, where a +15 % trend in annual rainfall is detected over the whole record. Yet, the detection of this trend might be an artifact since there are several consecutive wet years between 1992 and 2000. This trend in rainfall can also be seen for the soil moisture trends. Associated with the precip-itation decrease, positive temperature trends are observed for almost all basins, with an average increase of +0.5◦C dur-ing the time period 1958–2015. Consequently, widespread
Figure 2. Significant annual trends at the 10 % level (Mann–Kendall test) between 1958 and 2018 in precipitation, rainfall, frequency of dry days (with precipitation below 1 mm), temperature, soil moisture, actual evapotranspiration (AE) and reference evapotranspiration (ET0).
increasing trends in reference and actual evapotranspiration rates over all basins are observed, similarly to in Vicente-Serrano et al. (2014) in Spain or Rivoire et al. (2019) for the whole Mediterranean region. The combined decrease in pre-cipitation with increased evapotranspiration yields a decrease in soil moisture for the surface and the root zone layers. Yet, it must be stressed here that the soil moisture in the present study is not observed but simulated from the ISBA land sur-face model. However, the detected trends are in accordance with previous studies over southern France such as Vidal et al. (2012) or Dayon et al. (2018).
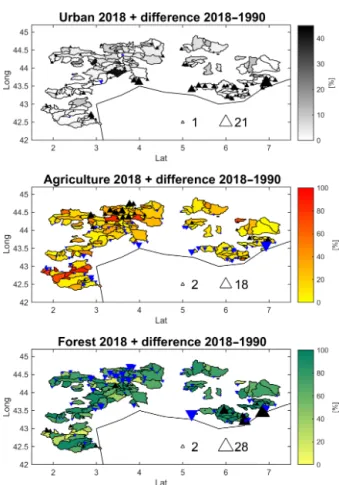
With regard to land cover (Fig. 3), most basins have low urban areas (below 10 %) and the basins with the highest coverage are found mostly in the southeast. An increase in urban areas of up to +20 % of total catchment surface can be seen between 1990 and 2018, mostly for basins located close to the Mediterranean coast and in particular those in the Provence-Alpes-Côte-d’Azur region. The class representing
discontinuous urban fabric represents 73 % of urbanized ar-eas and incrar-eased by +36 % between 1990 and 2018. The increase in urbanized areas could have a strong impact on runoff generation, in particular for small basins, with the in-crease in impervious surfaces favoring surface runoff. In con-trast, the agricultural and forest land cover can reach 100 % of the basin surface, in particular in the western Tarn re-gions for agriculture. We can notice a reduction in forest cover in the Northern Cévennes areas associated with an in-crease in agricultural surfaces. When looking in detail at the original classification, for some catchments of size 500 km2 or less, the percentage of vineyards could exceed 70 % of the total catchment areas, particularly for basins located in the Occitanie region. For almost all basins, the percentage of vineyards has decreased between 1990 and 2018. The other dominant land use classes related to agriculture are pastures (27.8 % of all catchments), complex cultivation pat-terns (21.9 %) and land principally occupied by agriculture
Table 1. Summary of the trend detection on different variables: number of positive and negative trends significant at the 10 % level and regional significance.
Variable Positive Negative Regional
trends trends significance
Climatic Mean precipitation 0 56 Yes (28 basins)
variables Mean rainfall 1 49 Yes (20 basins)
Frequency of dry days 46 2 Yes (9 basins)
Mean temperature 166 0 Yes (165 basins)
Mean surface soil moisture 1 132 Yes (129 basins) Mean root zone soil moisture 1 132 Yes (129 basins) Mean actual evapotranspiration 169 0 Yes (169 basins) Mean reference evapotranspiration 136 0 Yes (131 basins) Flood events Number of floods above the 95th percentile 0 67 Yes (40 basins)
Number of floods above the 99th percentile 1 45 Yes (7 basins) Flood magnitudes above the 95th percentile 4 3 No
Flood magnitudes above the 99th percentile 16 5 No
Climatic variables Cumulative precipitation during floods above the 95th percentile 36 6 Yes (16 basins) associated with Cumulative precipitation during floods above the 99th percentile 34 3 Yes (5 basins) flood events Antecedent wetness conditions for floods above the 95th percentile 10 40 Yes (11 basins)
Antecedent wetness conditions for floods above the 95th percentile 6 24 Yes (14 basins)
Figure 3. Urban, agricultural and forest cover by catchment from the CORINE database for the year 2018 and differences between 1990 and 2018 (upward black triangles indicate an increase, and downward blue triangles a decrease; the triangle sizes are propor-tional to the absolute changes between 1990 and 2018).
with significant areas of natural vegetation (27.7 %). Forested areas are mostly represented by broad-leaved forest (35 %), coniferous forest (19 %) and mixed forest (14.4 %) classes. It must be noted that the land cover change analysis is ham-pered by the short duration of the land use maps available, 28 years between 1990 and 2018, and different sensors dur-ing this period possibly lead to the different attributions to some land use classes.
4.2 Flood trends
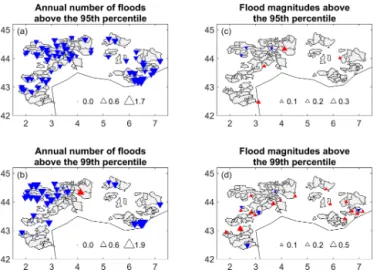
To analyze flood trends, all flood events above the 95th or 99th percentiles of daily runoff computed on the whole time series are extracted. As noted in the method section, a declus-tering approach has been implemented to avoid introducing an autocorrelation signal in the samples due to several con-secutive threshold exceedances belonging to the same event. The trend MK test is applied to the number of annual ex-ceedances above these two thresholds and also on the mag-nitude of the threshold exceedances. From Fig. 4 a general tendency towards a decrease in the annual number of flood events above the 95th percentile can be seen, which is sig-nificant in 67 catchments, and to a lesser extent also in the number of events above the 99th percentile in 45 catch-ments. These trends are regionally significant according to the FDR procedure and particularly over the northern ridge of the Cévennes mountainous areas. According to the Sen slope method to estimate the decrease in the annual number of events above the 95th percentile, for most basins the trends are ranging between −0.5 and −1 event per decade. For the most extreme cases the trends can reach up to −2.5 events per decade. Since for all catchments the number of events
Figure 4. Significant trends at the 10 % level (Mann–Kendall test) in the annual number of flood events above the 95th and 99th percentiles (a, b) and in the magnitude of these threshold ex-ceedances (c, d). Blue triangles indicate a decrease and red triangles an increase. The size of the triangles indicates the relative changes.
above the 95th percentile per year is 4.5 on average (min = 2, max = 6, after de-clustering), the magnitude of these trends can be considered moderate. For the 99th percentile the mag-nitude of trends are similar, with a maximum decrease of −1.4 events per decade, and for most stations on average −0.4 events per decade (with an average annual number of 1.6 events above the 99th percentile, after de-clustering). In addition to the trends in the annual number of events, there is also a weak signal of an increase in the magnitude of floods, in particular above the 99th percentile for 16 stations, yet these trends are not regionally significant.
Besides this event-based analysis, the temporal trends in the 95th and 99th percentiles of the daily runoff time se-ries have been investigated using quantile regression. The ap-proach is complementary but different to the testing of trends on the annual occurrence and the magnitude of the events, since quantile regression allows the possible changes on the quantiles of daily runoff time series to be evaluated. This analysis reveals that for a majority of catchments, a decreas-ing trend in these two percentiles is detected. The procedure is to apply a quantile regression of the percentile of interest with time as a covariate, and to validate if the slope of the quantile regression model is significantly different than zero at the 10 % level, a bootstrap resampling approach (Efron, 1979) has been considered. For the 95th percentile, a de-creasing trend is found in 147 stations and an increase is found in only 12 stations. For the 99th percentile, 89 sta-tions with negative trends and 15 with increasing trends are found. The relative changes in the 95th and 99th percentiles are ranging for most stations between 0 and −0.5 as shown in Fig. 5. The number of detected trends with quantile re-gression for the 95th and 99th percentiles is larger than the number of trends detected with the MK test. However, for
Figure 5. Histogram of the relative changes in the 95th and 99th percentiles estimated from the quantile regression models, with time as covariate (with a slope significantly different than zero at the 10 % level).
many basins the trends in the 95th and 99th percentiles are of small magnitude, and only for the largest trends does the MK test also detect significant changes in the annual number of events above these thresholds.
In an attempt to relate the detected trends to catchment characteristics, the Student t test has been used to compare the catchment descriptors between the group of basins with or without trends. The catchments where decreasing trends in flood occurrence are detected tend to be larger catchments (mean size of 369 km2vs. 253 km2for the catchments with no significant trends), with a lower proportion of karstic ar-eas (33 % vs. 41 %) and urban arar-eas (1.7 % vs. 3.79 %). Also, more decreasing trends are detected in agricultural catch-ments than in forested areas. Yet, no clear link can be found between land cover changes and flood trends, probably due to the short duration of the land cover dataset available. The only exception is trends in urbanization, with a lower in-crease in urbanization (+0.77 % average inin-crease in urban areas) in catchments where floods are decreasing by compar-ison with catchments with no flood trends (+1.41 % aver-age increase in urban areas). It must be noted that there is a strong spatial variability of the observed trends highlighting the complex interplays between the different catchment char-acteristics, as similarly noted by Snelder et al. (2013) over France. For example, the magnitude of the detected trends is not correlated with the different catchment properties. This implies that it would be very challenging to propose a ty-pology of basins with similar changes in floods according to catchment properties.
4.3 Changes in event precipitation and antecedent soil moisture conditions
For each event, the cumulative catchment precipitation av-erage is computed as the sum of nonzero consecutive rainy days, on a time window up to 10 d prior to the flood event.
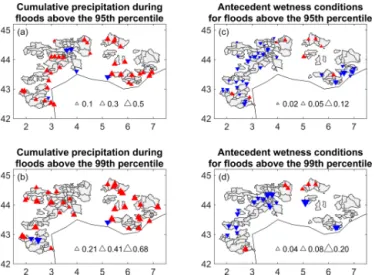
Figure 6. Significant trends at the 10 % level (Mann–Kendall test) in cumulative precipitation during flood events above the 95th and 99th percentile (a, b) and in the soil moisture initial condi-tions (c, d). Blue triangles indicate a decrease and red triangles an increase. The size of the triangles indicates the relative changes.
The antecedent soil moisture is taken as the root zone soil moisture corresponding to the day prior to the start of the rainfall event. Figure 6 show the Mann–Kendall test results for these two indicators for floods above the 95th and the 99th percentiles. An increase in precipitation associated with floods using both thresholds is observed (for 34 catchments for the 95th percentile and 36 catchments for the 99th per-centile), associated with a decrease in antecedent soil mois-ture conditions prior to floods in up to 40 catchments for floods above the 95th percentile. There is a correlation be-tween the reduction in antecedent soil moisture prior to flood events and the decrease in the annual number of flood events above the 95th percentile (r = 0.44), and also to a lesser extent for the number of floods above the 99th percentile (r = 0.34). Consequently, as observed in Australia by Wasko and Nathan (2019), it can be hypothesized that the decrease in antecedent soil moisture is an important driver leading to the reduction in the annual number of floods, despite the in-crease in event precipitation already pointed out by several studies in this region (Tramblay et al., 2013; Ribes et al., 2019; Blanchet et al., 2018). Indeed, for 12 catchments an in-crease in event rainfall is detected when for the same catch-ments a decrease in the annual number of events above the 95th percentile is also observed. It is also the case for 11 catchments for the events above the 99th percentile, with an increase in event rainfall accompanied by a decrease in the annual number of events. However, as shown before, the in-creased event precipitation for several basins is probably the cause of higher flood magnitudes for the most severe events (above the 99th percentile).
4.4 Explanatory covariates for high runoff quantiles To test the influence of different covariates on the variation of the 95th and 99th percentile values, quantile regression mod-els using time, temperature, soil moisture from the root zone, actual evapotranspiration (AE), reference evapotranspiration (ET0) and precipitation have been compared. The goal here is not to select the best covariates for each station but to iden-tify relevant covariates at the regional scale. Since climatic covariates could influence the hydrological response at dif-ferent timescales (Mediero et al., 2014; Villarini and Slater, 2017; Wasko and Nathan, 2019), three different aggregation periods to compute moving averages have been compared. On the event scale, the different covariates have been aver-aged with a 3 d time lag preceding each event. At the monthly timescale representing the seasonal variability, the covariates have been averaged for the 30 d preceding the events. For the annual timescale the covariates have been averaged for 365 d preceding the events. At the event scale, the precipita-tion represents the intensity of rainfall during the event rather than the preceding soil moisture. On the other timescales, for the monthly and annual aggregation periods the precipitation is here a proxy for soil moisture and its long-term variabil-ity. To test which covariate provides the best reproduction of the observed 95th and 99th percentiles of the daily discharge time series, the R1 metric is computed, for each covariate, between the quantile regression model built with the covari-ate and a constrained model with a constant slope (0).
The results are plotted in Fig. 7. A similar pattern can be seen for both percentiles, with decreasing R1 values for longer time aggregation periods for the covariates. On the event scale, both precipitation and soil moisture are outper-forming other covariates, including time. The same results are found for the annual timescale, yet with a different in-terpretation because annual precipitation is representing the average level of soil moisture storage rather than event rain-fall. The link observed between the 95th and 99th percentiles with annual precipitation or soil moisture is an indication that the long-term decrease observed for these two variables (Fig. 2) could be the cause of the observed decrease in the fre-quency of floods above these two percentiles. At the monthly timescale, the cumulative precipitation plays the most impor-tant role when the effects of soil moisture, actual evapotran-spiration and temperature are similar. For almost all covari-ates, there is an improvement by comparison to the quantile regression model using time only.
Overall, the R1 coefficients are decreasing with increas-ing slopes and basin mean elevation. However, these two variables are correlated (r = 0.61). This is an indication that antecedent soil moisture condition may have a lower influ-ence on flood generation in mountainous areas, probably due to shallower soils and steeper slopes. For event-based soil moisture and precipitation, there is an inverse relationship with basin size: for small basins (less than 500 km2) event soil moisture and precipitation are good predictors for the
Figure 7. Distribution of the R1coefficients for different covariates for the 95th or 99th percentiles of daily runoff, averaged at (a, b) the event scale (3 d), (c, d) the monthly scale, and (e, f) the annual timescale.
time variations of the 95th and the 99th percentiles, with R1 values up to 0.6, while for larger basins the R1 values are much lower, reaching a maximum of 0.2 for some basins. When averaged at the monthly or annual time step, the re-lation is opposite, with a larger influence of soil moisture and antecedent precipitation for larger basins with higher R1 coefficients. This finding is fully consistent with results
ob-tained for different regions of the globe (Zhang et al., 2011; Ivancic and Shaw, 2015; Woldemeskel and Sharma, 2016; Wasko and Sharma, 2017), highlighting the buffering effects of large basins with the capacity to store more water than smaller basins.
5 Conclusions
The results obtained in the present study show that despite the increase in extreme precipitation events reported by pre-vious studies over the same domain (Ribes et al., 2019) there is not a general increase in flood occurrence. Only for a few basins is the intensity of the most extreme floods show-ing significant upward trends. On the contrary, a global ten-dency towards fewer annual flood occurrences is observed for events of moderate intensity, i.e., those above the 95th percentile. The same signal, with a lower magnitude, is also seen for higher floods above the 99th percentile. Overall, there are much more trends detected for the annual occur-rence of floods than for their intensity. It should also be em-phasized that the magnitude of these trends remains moder-ate, and consequently these trends are only noticeable over long time periods. The decrease in soil moisture seems to be an important driver for these detected changes, and indeed in all basins an increase in temperature and evapotranspira-tion associated with a decrease in precipitaevapotranspira-tion is leading to a reduction in soil moisture over time. For several basins, the soil moisture decrease can offset the increase in ex-treme precipitation and generate less frequent floods. These changes are mostly observed for larger agricultural basins, with low urbanization and karstic areas. Wasko and Sharma et al. (2017) previously noted the importance of catchment size for the influence of soil moisture on flood runoff due to higher potential of soil moisture storage. The trends de-tected in the present work are consistent with those found in other Mediterranean regions such as Spain (Mediero et al., 2014) and Australia (Wasko and Nathan, 2019). An impor-tant finding of the present work is that with the same large-scale climatic drivers (in terms of temperature, evapotranspi-ration and precipitation) the flood trends in the basins can be different. This shows the importance of basins characteris-tics to buffer climatic variability. Indeed, even if similar pat-terns of changes in the 95th and 99th percentiles are found, the analysis of individual catchments is revealing spatial dif-ferences even for neighboring basins caused by different to-pography, soil and land cover combinations. This is a factual demonstration of the commentary of Whitfield (2012), who stated that it would be very difficult, if not scientifically irrel-evant, to make general statements about the plausible future evolution of flood risk.
These results, which show a lack of a generalized upward trend in floods, should be put into perspective with the ob-served increase in the vulnerability to these episodes. Indeed many reports such as Llasat et al. (2013) indicate an increase in the number of floods inducing damages between 1981 and 2010 in southern France and northern Spain, which they at-tribute to an increased vulnerability and land use changes. In the French Mediterranean regions, 66 % of the total cost of flood damage is concentrated in private properties in France (Vinet, 2011), and the total assets lost due to floods are ris-ing, as they are in many other regions (CCR, 2018; Paprotny
et al., 2018). The areas close to the Mediterranean have seen a population increase and an extension of urbanized ar-eas, driven in part but not solely by the increase in touris-tic activities (Vinet, 2011; Vinet and De Richemond, 2017). Bouwer (2011) concluded after a review of 22 disaster loss studies “that there are no trends in flood losses, corrected for changes (increases) in population and capital at risk, which could be attributed to anthropogenic climate change”. There-fore, it can be concluded that, at least for southern France, as noted previously by Neppel et al. (2003), the increasing cost of damages caused by floods is rather due to the increase in socio-economic vulnerability rather than a climate change signal towards an increase in the severity of floods. Nonethe-less, the evolution of flood frequency and intensity is a key question for risk prevention. Flood-related mortality in the Mediterranean basin is conditioned both by hazard drivers (e.g., rainfall intensity, discharge) but also by social drivers (e.g., behaviors, characteristics of buildings) as shown in dif-ferent studies (Ruin et al., 2008; Vinet, 2011; Boudou et al., 2016). Deeper knowledge in rainfall and flood trends must be crossed with exposure (e.g., population in flood prone zones) and vulnerability data (e.g., eldering of population in the fu-ture) to anticipate evolution in human mortality in relation to flash floods in the Mediterranean basin (Petrucci et al., 2019). As pointed out in previous research projects (Merz et al., 2014; Meyer et al., 2013) there is a need to integrate climate change scenarios with socio-economic change sce-narios to better quantify changes in flood risk. To achieve this task, it is necessary to develop databases on vulnerability and exposure to be analyzed in conjunction with hydrometeoro-logical data (Saint-Martin et al., 2018).
Data availability. The dataset compiled in this work are made available to the research community upon request.
Author contributions. YT performed the analysis and wrote the pa-per. LM extracted the basin attributes and performed analyses. LN and FV contributed to the writing. ES contributed to the database collection and to the writing.
Competing interests. The authors declare that they have no conflict of interest.
Special issue statement. This article is part of the spe-cial issue “Hydrological cycle in the Mediterranean (ACP/AMT/GMD/HESS/NHESS/OS inter-journal SI)”. It is not associated with a conference.
Acknowledgements. This work is a contribution to the HYdrolog-ical cycle in The Mediterranean EXperiment (HyMeX) program, through INSU-MISTRALS support.
Review statement. This paper was edited by Eric Martin and re-viewed by Patrick Arnaud and one anonymous referee.
References
Alfieri, L., Burek, P., Feyen, L., and Forzieri, G.: Global warming increases the frequency of river floods in Europe, Hydrol. Earth Syst. Sci., 19, 2247–2260, https://doi.org/10.5194/hess-19-2247-2015, 2015.
Benjamini, Y. and Hochberg, Y.: Controlling the false discovery rate: A practical and powerful approach to multiple testing, J. Roy. Stat. Soc. B, 57, 289–300, 1995.
Bennett B., Leonard, M., Deng Y., and Westra, S.: An empirical investigation into the effect of antecedent precipitation on flood volume, J. Hydrol., 567, 435–445, 2018.
Blanchet, J., Molinié, G., and Touati, J.: Spatial analysis of trend in extreme daily rainfall in southern France, Clim Dynam., 51, 799–812, 2018.
Blöschl, G., Gaál, L., Hall, J., Kiss, A., Komma, J., Nester, T., Para-jka, J., Perdigão, R. A., Plavcová, L., Rogger, M., Salinas, J. L., and Viglione, A.: Increasing river floods: fiction or reality?, WIREs Water, 2, 329–344, 2015.
Blöschl, G., Hall, J., Parajka, J., Perdigão, R. A., Merz, B., Arheimer, B., Aronica, G. T., Bilibashi, A., Bonacci, O., Borga,M., ˇCanjevac, I., Castellarin, A., Chirico, G. B., Claps, P., Fiala, K., Frolova, N., Gorbachova, L., Gül, A., Han-naford, J., Harrigan, S., Kireeva, M., Kiss, A., Kjeldsen, T. R., Kohnová,S., Koskela, J. J., Ledvinka, O., Macdonald, N., Mavrova-Guirguinova, M., Mediero, L., Merz, R., Molnar, P., Montanari,A., Murphy, C., Osuch, M., Ovcharuk, V., Radevski, I., Rogger,M., Salinas, J. L., Sauquet, E., Šraj, M., Szolgay, J., Viglione, A., Volpi, E., Wilson, D., Zaimi, K., and Živkovi´c, N.: Changing climate shifts timing of European floods, Science, 357, 588–590, 2017.
Boudou, M., Lang, M., Vinet, F., and Cœur, D.: Comparative hazard analysis of processes leading to remarkable flash floods (France, 1930–1999), J. Hydrol., 541, 533–552, 2016.
Bouwer, L. M.: Have disaster losses increased due to anthropogenic climate change?, B. Am. Meteorol. Soc., 92, 39–46, 2011. Brocca, L., Melone, F., and Moramarco, T.: On the estimation of
antecedent wetness conditions in rainfall–runoff modelling, Hy-drol. Process., 22, 629–642, 2008.
Büttner, G., Feranec, F., and Jaffrain, G.: Corine land cover up-date 2000. Technical report, European Environment Agency, Copen-hagen, Denmark, 2002.
Camarasa-Belmonte, A. M.: Flash floods in Mediterranean ephemeral streams in Valencia Region, J. Hydrol., 541, 99–115, 2016.
Camici, S., Brocca, L., and Moramarco, T.: Accuracy versus vari-ability of climate projections for flood assessment in central Italy, Climatic Change, 141, 273–286, 2017.
CCR: Conséquences du changement climatique sur les coûts des catastrophes naturelles en France à Horizon 2050, available at: https://catastrophes-naturelles.ccr.fr/-/consequences-du- changement-climatique-sur-le-cout-des-catastrophes-naturelles-en-france-a-horizon-2050 (last access: 26 October 2019), 2018.
Dayon, G., Boé, J., Martin, E., and Gailhard, J.: Impacts of climate change on the hydrological cycle over France and associated un-certainties, C. R. Geosci., 350, 141–153, 2018.
Do, H. X., Westra, S., and Leonard, M.: A global-scale investigation of trends in annual maximum streamflow, J. Hydrol., 552, 28–43, 2017.
Donnelly, C., Greuell, W., Andersson, J., Gerten, D., Pisacane, G., Roudier, P., and Ludwig, F.: Impacts of climate change on Eu-ropean hydrology at 1.5, 2 and 3 degrees mean global warming above preindustrial level, Climatic Change, 19, 1–14, 2017. Drobinski, P., Alonzo, B., Bastin, S., Silva, N. D., and
Muller, C.: Scaling of precipitation extremes with temper-ature in the French Mediterranean region: what explains-the hook shape?, J. Geophys. Res.-Atmos., 121, 3100–3119, https://doi.org/10.1002/2015JD023497, 2016
Efron, B.: Bootstrap Methods: Another Look at the Jackknife, Ann. Stat., 7, 1–26, 1979.
Giuntoli, I., Renard, B., and Lang, M.: Floods in France, in:Changes in flood risk in Europe, edited by: Kundzewicz, Z. W., IAHS and CRC/Balkema, Wallingford, UK, IAHS Special Publ., 10, 212– 224, 2012.
Grillakis, M. G., Koutroulis, A. G., Komma, J., Tsanis, I. K., Wag-ner, W., and Blöschl, G.: Initial soil moisture effects on flash flood generation – A comparison between basins of contrasting hydro-climatic conditions, J. Hydrol., 541, 206–217, 2016. Habets, F., Boone, A., Champeaux, J.-L., Etchevers, P.,
Franchis-teguy, L., Leblois, E., Ledoux, E., Le Moigne, P., Martin, E., Morel, S., Noilhan, J., Quintana-Segui, P., Rousset-Regimbeau, F., and Viennot, P.: The SAFRAN-ISBA-MODCOU hydrome-teorological model applied over France, J. Geophys. Res., 113, D06113, https://doi.org/10.1029/2007JD008548, 2008. Hamed, K. H. and Rao, A. R.: A modified Mann-Kendall trend test
for autocorrelated data, J. Hydrol., 204, 182–196, 1998. Hodgkins, G. A., Whitfield, P. H., Burn, D. H., Hannaford, J.,
Re-nard, B., Stahl, K., Fleig, A. K., Madsen, H., Mediero, L., Ko-rhonen, J., Murphy, C., and Wilson, D.: Climate-driven variabil-ity in the occurrence of major floods across North America and Europe, J. Hydrol., 552, 704–717, 2017.
Ivancic, T. J. and Shaw S. B.: Examining why trends in very heavy precipitation should not be mistaken for trends in very high river discharge, Climatic Change, 133, 681–693, 2015.
Jourde, H., Roesch, A., Guinot, V., and Bailly-Comte, V.: Dynam-ics and contribution of karst groundwater to surface flow during Mediterranean flood, Environ. Geol., 51, 725–730, 2007. Khaliq, M. N., Ouarda, T. B. M. J., Gachon, P., Sushama, L., and
St-Hilaire, A.: Identification of hydrological trends in the presence of serial and cross correlations: A review of selected methods and their application to annual flow regimes of Canadian rivers, J. Hydrol., 368, 117–130, 2009.
Knighton, J. O., DeGaetano, A., and Walter, M. T.: Hydrologic state influence on riverine flood discharge for a small temperate wa-tershed (Fall Creek, United States): negative feedbacks on the effects of climate change, J. Hydrometeorol., 18, 431–449, 2017. Koenker, R. and Basset, B. G.: Regression quantiles, Econometrica,
46, 33–50, 1978.
Koenker, R. and Machado J. A. F.: Goodness-of-fit and related in-ference processes for quantile regression, J. Am. Stat. Assoc., 94, 1296–1310, 1999.
Kundzewicz, Z. W., Krysanova, V., Dankers, R., Hirabayashi, Y., Kanae, S., Hattermann, F. F., Huang, S., Milly, P. C. D., Stof-fel, M., Driessen, P. P. J., Matczak, P., Quevauviller, P., and Schellnhuber, H.-J.: Differences in flood hazard projections in Europe – their causes and consequences for decision making, Hydrolog. Sci. J., 62, 1–14, 2017.
Llasat, M. C., Llasat-Botija, M., Petrucci, O., Pasqua, A. A., Rosselló, J., Vinet, F., and Boissier, L.: Towards a database on societal impact of Mediterranean floods within the framework of the HYMEX project, Nat. Hazards Earth Syst. Sci., 13, 1337– 1350, https://doi.org/10.5194/nhess-13-1337-2013, 2013. Mangini, W., Viglione, A., Hall, J., Hundecha, Y., Ceola, S.,
Mon-tanari, A., Rogger, M., Salinas, J. L., Borzì, I., and Parajka, J.: Detection of trends in magnitude and frequency of flood peaks across Europe, Hydrolog. Sci. J., 63, 493–512, 2018.
Mann, H. B.: Nonparametric tests against trend, Econometrica, 13, 245–259, 1945.
Mediero, L., Santillán, D., Garrote, L., and Granados, A.: Detection and attribution of trends in magnitude, frequency and timing of floods in Spain, J. Hydrol., 517, 1072–1088, 2014.
Merz, B., Aerts, J., Arnbjerg-Nielsen, K., Baldi, M., Becker, A., Bichet, A., Blöschl, G., Bouwer, L. M., Brauer, A., Cioffi, F., Delgado, J. M., Gocht, M., Guzzetti, F., Harrigan, S., Hirschboeck, K., Kilsby, C., Kron, W., Kwon, H.-H., Lall, U., Merz, R., Nissen, K., Salvatti, P., Swierczynski, T., Ulbrich, U., Viglione, A., Ward, P. J., Weiler, M., Wilhelm, B., and Nied, M.: Floods and climate: emerging perspectives for flood risk assess-ment and manageassess-ment, Nat. Hazards Earth Syst. Sci., 14, 1921– 1942, https://doi.org/10.5194/nhess-14-1921-2014, 2014. Meyer, V., Becker, N., Markantonis, V., Schwarze, R., van den
Bergh, J. C. J. M., Bouwer, L. M., Bubeck, P., Ciavola, P., Genovese, E., Green, C., Hallegatte, S., Kreibich, H., Lequeux, Q., Logar, I., Papyrakis, E., Pfurtscheller, C., Poussin, J., Przy-luski, V., Thieken, A. H., and Viavattene, C.: Review article: Assessing the costs of natural hazards – state of the art and knowledge gaps, Nat. Hazards Earth Syst. Sci., 13, 1351–1373, https://doi.org/10.5194/nhess-13-1351-2013, 2013.
Najibi, N. and Devineni, N.: Recent trends in the frequency and duration of global floods, Earth Syst. Dynam., 9, 757–783, https://doi.org/10.5194/esd-9-757-2018, 2018.
Neppel L., Bouvier C., Desbordes M., and Vinet F.: A possible ori-gin for the increase in floods in the Mediterranean region, Rev. Sci. Eau, 16, 389–494, 2003.
Norbiato, D., Borga, M., Esposti, S.D., Gaume, E., and Anquetin, S.: Flash flood warning based on rainfall thresholds and soil moisture conditions: An assessment for gauged and ungauged basins, J. Hydrol., 362, 274–290, 2008.
Paprotny, D., Sebastian, A., Morales-Nápoles, O., and Jonkman, S. N.: Trends in flood losses in Europe over the past 150 years, Nat. Commun., 9, 1985, https://doi.org/10.1038/s41467-018-04253-1, 2018.
Paxian, A., Hertig, E., Seubert, S., Vogt, G., Jacobeit, J., and Paeth, H.: Present-day and future mediterranean precipitation extreme-sassessed by different statistical approaches, Clim. Dynam., 44, 845–860, https://doi.org/10.1007/s00382-014-2428-6, 2015 Penna, D., Tromp-van Meerveld, H. J., Gobbi, A., Borga,
M., and Dalla Fontana, G.: The influence of soil mois-ture on threshold runoff generation processes in an alpine
headwater catchment, Hydrol. Earth Syst. Sci., 15, 689–702, https://doi.org/10.5194/hess-15-689-2011, 2011.
Petrucci, O., Papagiannaki, K., Aceto, L., Boissier, L., Kotroni,V., Grimalt, M., Llasat, M. C., Llasat-Botija, M., Rosselló, J.,Pasqua, A. A., and Vinet, F.: MEFF: The database of MEditer-ranean Flood Fatalities (1980 to 2015), J. Flood Risk Manage., 12, e12461, https://doi.org/10.1111/jfr3.12461, 2019.
Pfahl, S., O’Gorman, P. A., and Fischer, E. M.: Under-standing the regional pattern of projected future chan-gesin extreme precipitation, Nat. Clim. Change, 7, 423–427, https://doi.org/10.1038/nclimate3287, 2017.
Piras, M., Mascaro, G., Deidda, R., and Vivoni, E. R.: Impacts of climate change on precipitation and discharge extremes through the use of statistical downscaling approaches in a Mediterranean basin, Sci. Total Environ., 543, 952–964, 2016.
Polade, S. D., Pierce, D. W., Cayan, D. R., Gershunov, A., and Dettinger, M. D.: The key role of dry days in changing re-gional climate and precipitation regimes, Sci. Rep., 4, 4364, https://doi.org/10.1038/srep04364, 2014.
Polade, S. D., Gershunov, A., Cayan, D. R., Dettinger, M. D., and Pierce, D. W.: Precipitation in a warming world: As-sessing projected hydro-climate changes in California and other Mediterranean climate regions, Sci. Rep., 7, 10783, https://doi.org/10.1038/s41598-017-11285-y, 2017.
Quintana-Seguí, P., Le Moigne, P., Durand, Y., Martin, E., Habets, F., Baillon, M., Canellas, C., Franchisteguy, L., and Morel, S.: Analysis of Near-Surface Atmospheric Variables: Validation of the SAFRAN Analysis over France, J. Appl. Meteorol. Clim., 47, 92–107, 2008.
Quintana-Seguí, P., Habets, F., and Martin, E.: Comparison of past and future Mediterranean high and low extremes of precipita-tion and river flow projected using different statistical down-scaling methods, Nat. Hazards Earth Syst. Sci., 11, 1411–1432, https://doi.org/10.5194/nhess-11-1411-2011, 2011.
Raynaud, D., Thielen, J., Salamon, P., Burek, P., Anquetin, S., and Alfieri, L.: A dynamic runoff coefficient to improve flash flood early warning in Europe: validation on the 2013 Central Euro-pean floods in Germany, Meteorol. Appl., 22, 410–418, 2015. Renard, B., Lang, M., Bois, P., Dupeyrat, A., Mestre, O., Niel,
H.,Sauquet, E., Prudhomme, C., Parey, S., Paquet, E., Neppel, L., and Gailhard, J.: Regional methods for trend detection: as-sessingfield significance and regional consistency, Water Resour. Res., 44, W08419, https://doi.org/10.1029/2007WR006268, 2008.
Ribes, A., Soulivanh, T., Vautard, R., Dubuisson, B., Somot, S., Colin, J., Planton, S., and Soubeyroux, J.-M.: Observed increase in extreme daily rainfall in the French Mediterranean, Clim. Dy-nam., 52, 1095–1114, 2019.
Rivoire, P., Tramblay, Y., Neppel, L., Hertig, E., and Vicente-Serrano, S. M.: Impact of the dry-day definition on Mediter-ranean extreme dry-spell analysis, Nat. Hazards Earth Syst. Sci., 19, 1629–1638, https://doi.org/10.5194/nhess-19-1629-2019, 2019.
Ruin, I., Creutin, J.-D., Anquetin, S., and Lutoff, C.: Human ex-posure to flash-floods – Relation between flood parameters and human vulnerability during a storm of September 2002 in south-ern France, J. Hydrol., 361, 199–213, 2008.
Saint-Martin, C., Javelle, P., and Vinet, F.: DamaGIS: a multisource geodatabase for collection of flood-related damage data, Earth
Syst. Sci. Data, 10, 1019–1029, https://doi.org/10.5194/essd-10-1019-2018, 2018.
Sauquet, E. and Catalogne, C.: Comparison of catchment group-ing methods for flow duration curve estimation at ungauged sites in France, Hydrol. Earth Syst. Sci., 15, 2421–2435, https://doi.org/10.5194/hess-15-2421-2011, 2011.
Schomburgk, S., Allier, D., and Seguin, J. J.: The new aquifer Reference system BDLISA in France and the representation of karst units: challenges of small-scale mapping, in: Grundwasser – Mensch – Ökosysteme. 25. Tagung des Fachsektion Hydroge-ologie in der DGGV 2016, Karlsruher Institut für TechnHydroge-ologie (KIT), 13–17 April 2016, Karlsruhe, Germany, KIT Scientific Publishing, ISBN: 978-3-7315-0475-7, 2016.
Sen, P. K.: Estimates of the regression coefficient based on Kendall’s tau, J. Am. Stat. Assoc., 63, 1379–1389, 1968 Sharma, A., Wasko, C., and Lettenmaier, D. P.: If precipitation
ex-tremes are increasing, why aren’t floods?, Water Resour. Res., 54, 8545–8551, 2017.
Snelder, T. H., Datry, T., Lamouroux, N., Larned, S. T., Sauquet, E., Pella, H., and Catalogne, C.: Regionalization of patterns of flow intermittence from gauging station records, Hydrol. Earth Syst. Sci., 17, 2685–2699, https://doi.org/10.5194/hess-17-2685-2013, 2013.
Thober, S., Kumar, R., Wanders, N., Marx, A., Pan, M., Rakovec,O., Samaniego, L., Sheffield, J., Wood, E. F., and Zink, M.: Multi-model ensemble projections of European river floods and high flows at 1.5, 2, and 3 degree global warming, Environ. Res. Lett., 13, 1–22, 2018.
Tramblay, Y. and Somot, S.: Future evolution of extreme precipita-tion in the Mediterranean, Climatic Change, 151, 289–302, 2018. Tramblay, Y., Bouvier, C., Martin, C., Didon-Lescot, J. F., Todor-ovik, D., and Domergue, J. M.: Assessment of initial soil mois-ture conditions for event-based rainfall-runoff modelling, J. Hy-drol., 387, 176–187, 2010.
Tramblay, Y., Neppel, L., Carreau, J., and Najib, K.: Non-stationaryfrequency analysis of heavy rainfall events in southern France, Hydrolog. Sci. J., 58, 1–15, 2013.
Uber, M., Vandervaere, J.-P., Zin, I., Braud, I., Heistermann, M., Legoût, C., Molinié, G., and Nord, G.: How does initial soil moisture influence the hydrological response? A case study from southern France, Hydrol. Earth Syst. Sci., 22, 6127–6146, https://doi.org/10.5194/hess-22-6127-2018, 2018.
Vicente-Serrano, S. M., Azorin-Molina, C., Sanchez-Lorenzo, A., Revuelto, J., López-Moreno, J. I., González-Hidalgo, J. C., and Espejo, F.: Reference evapotranspiration variability and trends in Spain, 1961–2011, Global Planet. Change, 121, 26–40, 2014. Vidal, P., Martin, E., Kitova, N., Najac, J., and Soubeyroux,
J.-M.: Evolution of spatio-temporal drought characteristics: valida-tion, projections and effect of adaptation scenarios, Hydrol. Earth Syst. Sci., 16, 2935–2955, https://doi.org/10.5194/hess-16-2935-2012, 2012.
Viglione, A., Merz, R., and Blöschl, G.: On the role of the runoff coefficient in the mapping of rainfall to flood return periods, Hy-drol. Earth Syst. Sci., 13, 577–593, https://doi.org/10.5194/hess-13-577-2009, 2009.
Villarini G. and Slater L.: Examination of Changes in Annual Maximum Gauge Height in the Continental United States Using Quantile Regression, J. Hydrol. Eng., 23, 6017010, https://doi.org/10.1061/(ASCE)HE.1943-5584.0001620, 2017. Vinet, F.: Flood Risk Assessment and Management in France. The
Case of Mediterranean Basins, Flood Prevention and Remedia-tion, WIT Press, Southampton, UK, 105–132, 2011.
Vinet, F. and de Richemond, N. M.: Changes in Flood Risk: Retro-spective and ProRetro-spective Approach, chap. 14, in: Floods 1: risk knowledge, edited by: Vinet, F., ISTE edition, London, UK, 311– 323, 2017.
Wasko, C. and Nathan, R.: Influence of changes in rainfall and soil moisture on trends in flooding, J. Hydrol., 575, 432–441, 2019. Wasko, C. and Sharma, A.: Global assessment of flood and
storm extremes with increased temperatures, Sci. Rep., 7, 7945, https://doi.org/10.1038/s41598-017-08481-1, 2017.
Wasko, C., Parinussa, R. M., and Sharma, A.: A quasi-global as-sessment of changes in remotely sensed rainfall extremes with temperature, Geophys. Res. Lett., 43, 12659–12668, 2016. Westra, S., Alexander, L. V., and Zwiers, F. W.: Global increasing
trends in annual maximum daily precipitation, J. Climate, 26, 3904–3918, 2013
Whitfield, P.: Changing floods in future climates, J. Flood Risk Manage, 5, 336–365, 2012.
Wilks, D. S.: The stippling shows statistically significant grid points: how research results are routinely overstated and over in-terpreted, and what to do about it, B. Am. Meteorol. Soc., 97, 2263–2273, 2016.
Woldemeskel, F. and Sharma, A.: Should flood regimes change in a warming climate? The role of antecedent moisture conditions, Geophys. Res. Lett., 43, 7556–7563, https://doi.org/10.1002/2016GL069448, 2016.
Yin, J., Gentine, P., Zhou, S., Sullivan, S. C., Wang, R., Zhang, Y., and Guo, S.: Large increase in global storm runoff extremes driven by climate and anthropogenic changes, Nat. Commun., 9, 4389, https://doi.org/10.1038/s41467-018-06765-2, 2018. Zhang, Y., Wei, H., and Nearing, M. A.: Effects of antecedent soil
moisture on runoff modeling in small semiarid watersheds of southeastern Arizona, Hydrol. Earth Syst. Sci., 15, 3171–3179, https://doi.org/10.5194/hess-15-3171-2011, 2011.