HAL Id: tel-02085886
https://pastel.archives-ouvertes.fr/tel-02085886
Submitted on 31 Mar 2019HAL is a multi-disciplinary open access archive for the deposit and dissemination of sci-entific research documents, whether they are pub-lished or not. The documents may come from teaching and research institutions in France or abroad, or from public or private research centers.
L’archive ouverte pluridisciplinaire HAL, est destinée au dépôt et à la diffusion de documents scientifiques de niveau recherche, publiés ou non, émanant des établissements d’enseignement et de recherche français ou étrangers, des laboratoires publics ou privés.
d’image tomographique scanner
Clara Jaquet
To cite this version:
Clara Jaquet. Vers la simulation de perfusion du myocarde à partir d’image tomographique scanner. Traitement des images [eess.IV]. Université Paris-Est, 2018. Français. �NNT : 2018PESC1117�. �tel-02085886�
Clara Jaquet
Thesis co-directors
Hugues Talbot, Laurent Najman Thesis co-supervisors
Charles Taylor, Leo Grady, Michiel Schaap, Irène Vignon-Clementel
PhD in Computing science Defense on December 18th 2018
Université Paris Est École Doctorale MSTIC
Jury
Irène VIGNON-CLEMENTEL INRIA President
Hervé DELINGETTE INRIA Reviewer
Frans VAN DE VOSSE TU Eindhoven Reviewer
Recent advances in medical image computing have allowed auto-mated systems to closely assist physicians in patient therapy. Com-putational and personalized patient models benefit diagnosis, prog-nosis and treatment planning, with a decreased risk for the patient, as well as potentially lower cost. HeartFlow Inc. is a successful ex-ample of a company providing such a service in the cardiovascular context. Based on patient-specific vascular model extracted from X-ray CT images, they identify functionally significant disease in large coronary arteries. Their combined anatomical and functional analy-sis is nonetheless limited by the image resolution. At the downstream scale, a functional exam called Myocardium Perfusion Imaging (MPI) highlights myocardium regions with blood flow deficit. However, MPI does not functionally relate perfusion to the upstream coronary disease.
The goal of our project is to build the functional bridge between coronary and myocardium, by extrapolating the functional analysis from large coronary toward the capillary bed. This objective requires extension from the coronary model down to the microvasculature combined with a functional analysis leading to the myocardium com-partment.
We expand a tree generation method subjected to functional princi-ples, named Constrained Constructive Optimization, to generate mul-tiple competing vascular trees. The algorithm simulates angiogenesis under vascular volume minimization with flow-related and geomet-rical constraints, adapting the simultaneous tree growths to patient priors. This method provides a hybrid imabased and synthetic ge-ometric model, starting from segmented epicardium coronary down to synthetic arterioles, filling the left ventricle myocardium.
We then build a multiscale functional analysis pipeline to allow blood flow simulation from the coronaries to the myocardium. This is achieved with a 1D coronary model compatible with the hybrid vasculature, and a spatial blood flow distribution analysis of the ter-minal segments. The latter is performed using a similar nomenclature to MPI, to enable patient-specific comparison with functional ground-truth data.
We connected the vascular anatomy to blood flow distribution in the myocardium on several patient datasets. This multiscale frame-work points out several leads to refine the vascular netframe-work genera-tion and fluid simulagenera-tion methods. This patient-specific anatomical and functional extrapolation is a first gateway toward myocardium perfusion from X-ray CT data. Building such personalized
vascular complex physio-pathology, and, finally, improve the patient care.
Keywords:
patient specific modeling - cardiac vascular network generation - func-tional analysis - coronary arteries - myocardium perfusion
De nos jours, les progrès de l’informatisation de l’imagerie médi-cale assistent au plus près les médecins dans leur soin au patient. Des modèles personnalisés computationnels sont utilisés pour le diagnos-tique, prognostique et plannification du traitement, en diminuant les risques pour le patient, et potentiellement les frais médicaux.
Heartflow est l’exemple même d’une compagnie qui réussit ce ser-vice dans le domaine cardiovasculaire. À partir d’un modèle extrait d’images tomographiques rayons X, les lésions avec impact fonction-nel sont identifiées dans les artères coronaires. Cette analyse qui com-bine l’anatomie à la fonction est néanmoins limitée par la résolution de l’image. En aval de ces larges vaisseaux, un examen fonctionnel dé-nommé Imagerie de Perfusion du Myocarde (IPM) met en évidence les régions du myocarde affectées par un déficit de flux sanguin. Ce-pendant, l’IPM n’établie pas de relation fonctionnelle avec les larges vaisseaux coronaires lésés en amont.
L’objectif de ce projet est de construire la connection fonctionnelle entre les coronaires et le myocarde, en extrapolant l’analyse fonction-nelle depuis les larges vaisseaux vers le lit capillaire. À cette fin, il faut étendre le modèle vasculaire jusqu’aux microvaisseaux, et mener une analyse fonctionnelle en direction du compartement myocardique.
Nous étendons une méthode de génération d’arbre vasculaire ba-sée sur la satisfaction de principes fonctionnels, nommée Constrained Constructive Optimization (Optimization Constructive sous Contraintes), pour qu’elle s’applique à de multiples arbres vasculaires en compéti-tion. L’algorithme simule l’angiogénese avec minimisation du volume vasculaire sous contraintes de flux et de géométrie adaptant la crois-sance simultanée des arbres aux caractéristiques du patient. Cette mé-thode fournit un modèle hybride composé de coronaires épicardiales extraites d’images et de vaisseaux synthétiques jusqu’aux artérioles, emplissant le ventricule gauche du myocarde.
Puis, nous construisons un pipeline d’analyse fonctionnelle multi-échelle pour étendre la simulation de flux depuis les coronaires vers le myocarde. Cela consiste en un modèle de flux coronaire 1D com-patible avec la vasculature hybride, et l’analyse de la distribution spa-tiale des flux provenant des segments terminaux. Cette dernière est réalisée dans une nomenclature similaire à celle de l’IPM pour per-mettre la comparaison avec des données de vérité terrain fonction-nelles.
Nous avons relié l’anatomie du réseau vasculaire à la distribution de flux dans le myocarde pour plusieurs patients. Cette analyse multi-échelle permet d’identifier des pistes pour affiner les méthodes de
mique et fonctionnelle personnalisée est une première passerelle pour la simulation de perfusion du myocarde à partir d’imagerie tomogra-phique scanner. La construction d’un tel modèle computationnel per-sonnalisé pourrait aider à la compréhension de la physio-pathologie cardiovasculaire complexe et, enfin, à la santé du patient.
Mots clefs :
modèle personnalisé du patient - génération de réseau vasculaire car-diaque - analyse fonctionnelle - artères coronaires - perfusion du myo-carde
De nos jours, les progrès de l’informatisation de l’imagerie médi-cale assistent au plus près les médecins dans leur soin au patient. Les avancées de l’imagerie médicale permettent d’acquérir divers si-gnaux avec une large gamme de résolution spatiale et temporelle. Par ailleurs, des phénomènes physiologiques tel que l’hémodynamique par exemple, sont à présent simulés à l’aide de modèle numériques génériques. En personnalisant ces simulations à l’aide d’images ana-tomiques ou fonctionelles du patient, on peut ainsi construire des modèles personnalisés computationnels. Ceux-ci sont utilisés pour le diagnostique, le prognostique et la planification du traitement. Ils améliorent ainsi l’accompagnement thérapeutique du patient en di-minuant les risques, et potentiellement les frais médicaux.
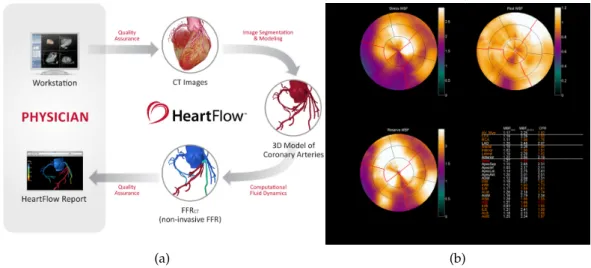
Heartflow est l’exemple même d’une compagnie qui réussit ce ser-vice dans le domaine cardiovasculaire. L’entreprise propose une solu-tion non invasive pour le diagnostique des lésions dans les vaisseaux coronaires : FFRct, illustrée en figure 1a. La géométrie des artères
co-ronaires du patient est extraite à partir d’une image tomographique du coeur par rayons X. Dans ce modèle anatomique personnalisé, le flux sanguin est simulé. Ainsi, ce processus identifie les lésions qui impactent la fonction de transport du sang dans les artères coronaires. Cette analyse, qui combine l’anatomie à la fonction, est néanmoins li-mitée par la résolution de l’image.
En aval de ces larges vaisseaux, un examen fonctionnel dénommé Imagerie de Perfusion du Myocarde (IPM) permet de quantifier le sang transporté dans le tissu musculaire du coeur. Le résultat est pro-duit sous forme d’une cartographie polaire du myocarde, illustré en figure 1b. Cet examen consiste à détecter la distribution d’un agent
de contraste dans le tissu, en soumettant le patient à des conditions de repos et de stress. La comparaison de ces deux situations met en évidence les régions du myocarde affectées par un déficit de flux san-guin. Cependant, l’IPM n’établit pas de relation fonctionnelle avec les larges vaisseaux coronaires lésés en amont.
L’objectif de ce projet est de construire la connection fonctionnelle entre les coronaires et le myocarde, en extrapolant l’analyse hémody-namique depuis les larges vaisseaux vers le lit capillaire. À cette fin, il faut étendre le réseau vasculaire du patient jusqu’aux microvais-seaux, et mener une analyse fonctionnelle en direction du comparti-ment myocardique. Sachant que l’examen IPM ne fournit une vérité terrain que pour le ventricule gauche du myocarde, nous concentrons
Figure 1 – Illustration de deux examens pour le diagnostique de patholo-gies coronariennes. (a) FFRct, processus de l’outil diagnostique.
(b): IMP par examen water-PET, exemple de résultat de patient malade. Haut : stress (gauche) et repos (droite). Bas : ratio des re-sultats stress et repos, dit réserve. Dans cet exemple, on observe une section sur la gauche particulièrement déficitaire.
notre travail sur cette seule chambre cardiaque.
Plusieurs méthodes pour générer des réseaux vasculaires en terri-toire contraint existent, mais aucune n’a été appliquée pour l’exten-sion de coronaires spécifiques d’un patient. Dans cet objectif, nous nous sommes intéréssés à une méthode nommée Constrained Construc-tive Optimization (Optimisation ConstrucConstruc-tive sous Contraintes). Celle-ci consiste à simuler l’angiogénèse, la croissance du réseau vasculaire concomitante du tissu perfusé. Cette méthode repose sur la satisfac-tion de plusieurs principes foncsatisfac-tionnels. Notamment, elle considère une distribution homogène des flux dans le territoire perfusé, et elle minimise l’énergie du réseau vasculaire, symbolisée par son volume total. De plus, elle garantit la satisfaction de lois hémodynamiques à l’échelle d’une bifurcation et de l’arbre entier. Cet algorithme de gé-nération d’un arbre vasculaire a évolué : initialement en 2D, puis en 3D, ensuite impliquant une croissance par étape, et enfin adapté à la forme concave du ventricule, cf figure 2. Cependant, cette méthode
ne génère qu’un seul arbre vasculaire dans un territoire simulé. Inspirée de la CCO, nous proposons donc une méthode innovante afin de générer plusieurs arbres vasculaires, et respecter les caractéris-tiques du patient : CCO Forest. Dans cette méthode, la croissance si-multanée, et donc compétitive, des arbres vasculaires est guidée par le flux associé à chaque arbre. Nous avons établi une preuve de concept en territoire simulé 2D, présentée en figure3. Elle démontre que le
(a) (b) (c) (d)
Figure 2 – Evolution de l’algorithme CCO : visuel des résultats de (a) CCO en 2D [85],(b) CCO en 3D [54], (c) CCO avec croissance par étape
[55], (d) CCO non convexe pour le ventricule [86]
(a) (b) (c)
Figure 3 – Illustration de la preuve de concept de CCO Forest en territoires simulés non convexes, avec divers flux q, pour deux arbres (celui du haut : "h", celui du bas : "b"). (a) : qh = qb. (b) : qh = 2qb.
(c) : qh = 9qb. Le dégradé de couleurs représente la distance à
la concavité centrale.
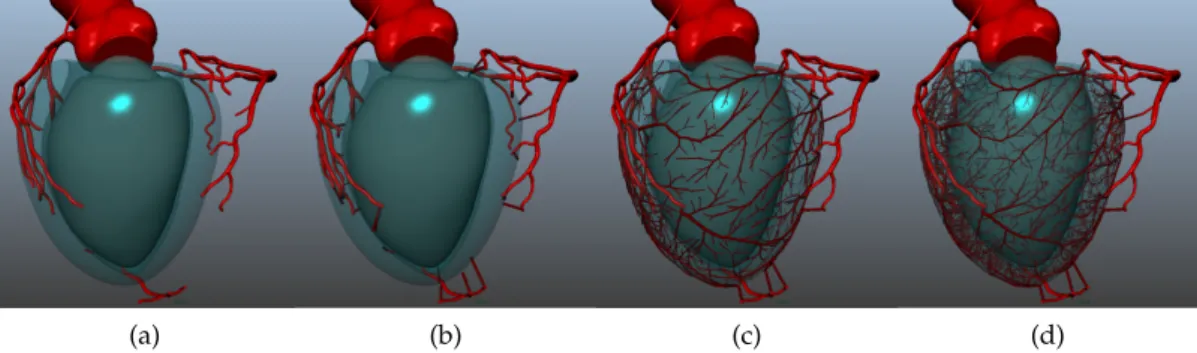
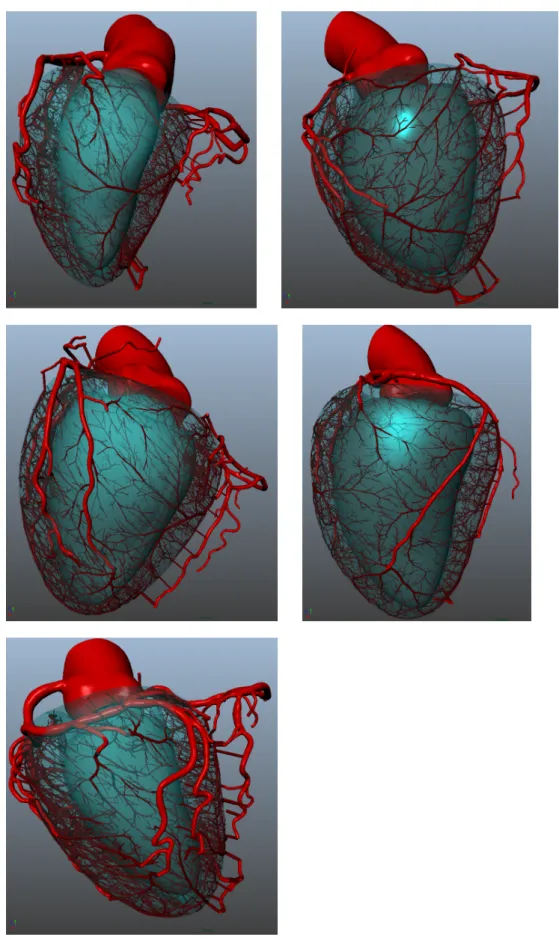
Afin de personnaliser cette méthode pour les données de patients, nous utilisons la segmentation des gros vaisseaux et du ventricule, ex-traits de la tomographie rayons X. Nous distribuons des arbres vascu-laires synthétiques à chaque extrémité et le long du réseau segmenté, selon un modèle statistique issu de la littérature. Nous associons à chacun des arbres un flux proportionel à son diamètre. Nous initia-lisons chaque arbre avec un premier segment qui le relie à la sur-face du ventricule. Puis, nous effectuons une croissance de la forêt d’arbres vasculaires en deux étapes : d’abord sur la surface du ventri-cule, et ensuite dans son volume entier. Afin d’obtenir une cohérence avec le réseau segmenté, lors de la croissance des arbres nous appli-quons des contraintes géométriques angulaires, et rejetons tout seg-ment intersectant les vaisseaux pré-existants. La méthode est illustrée dans la figure 4. Elle produit un modèle hybride composé des
coro-naires extraites d’images et de segments synthétiques jusqu’aux arté-rioles, emplissant le ventricule gauche du myocarde. Nous avons ap-pliqué CCO Forest sur 6 patients, produisant un réseau vasculaire de
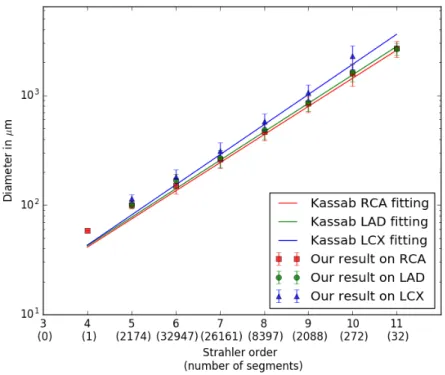
et répétabilité. Les caractéristiques morphométriques des réseaux hy-brides obtenus montrent un bonne corrélation avec les statistiques de la littérature.
(a) (b) (c) (d)
Figure 4 – Illustration de CCO Forest sur un patient.(a): éléments initiaux fournis à l’algorithme.(b): distribution du premier segment de chaque arbre connectant à la surface du ventricule. (c) : crois-sance en surface, jusqu’à obtenir 1000 segments terminaux.(d): croissance dans le volume, atteignant 6000 segments terminaux.
Afin d’analyser les propriétés fonctionnelles des réseaux générés, et de permettre la comparaison avec la vérité terrain, nous construi-sons un pipeline d’analyse fonctionnelle multi-échelle qui étend la simulation de flux depuis les coronaires vers le myocarde. Celui-ci se compose de trois outils.
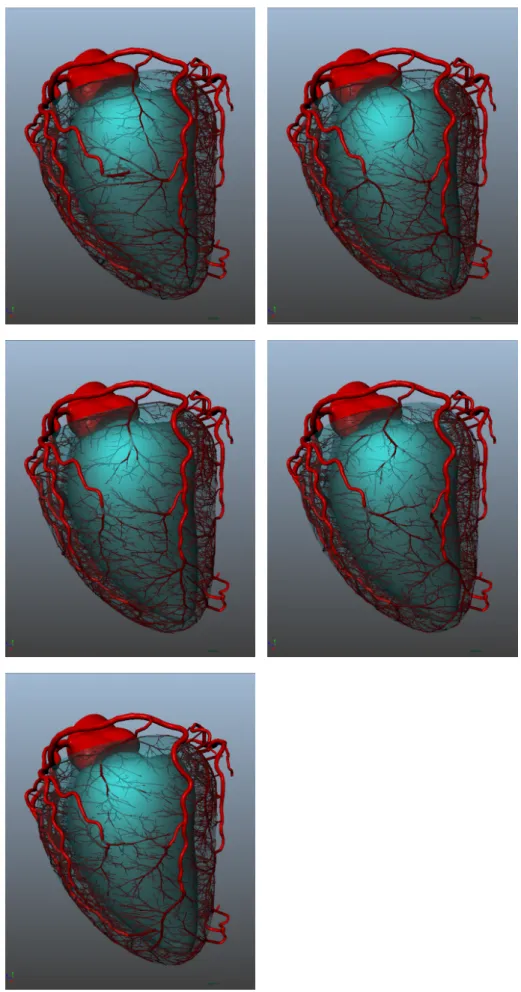
(a) (b)
Figure 5 – Visualisation des résultats des deux premières étapes du pipe-line d’analyse fonctionnelle.(a)Simulation des pressions dans le réseau hybride avec notre modèle 1D Navier-Stokes. (b) Distri-bution des flux des segments terminaux dans le myocarde.
Tout d’abord, nous simulons le flux sanguin dans le réseau hy-bride à l’aide d’un modèle de flux artériel 1D résolvant le système d’équations de Navier-Stokes. Ce modèle est construit pour simuler
au flux non turbulent, en régime constant. Les conditions aux limites imposent une pression aortique de référence à l’entrée des coronaires, et des flux déterminés aux segments terminaux, qui sont actualisés au fur et à mesure des itérations. La résolution du système fournit les champs de pression et de flux dans l’ensemble du réseau vasculaire. La figure5aillustre les pressions obtenues sur l’exemple d’un patient
en condition de repos.
Puis, nous analysons la distribution spatiale des flux aux segments terminaux. Pour cela nous divisons le myocarde en une multitude de sous-volumes, et comptabilisons les flux des segments terminaux dans chacun d’entre eux. Cette estimation des flux à l’échelle du myo-carde est illustrée en figure 5b. Elle permet d’étudier les intervalles
de distribution de flux à l’échelle globale et locale, pour les comparer à ceux de la littérature.
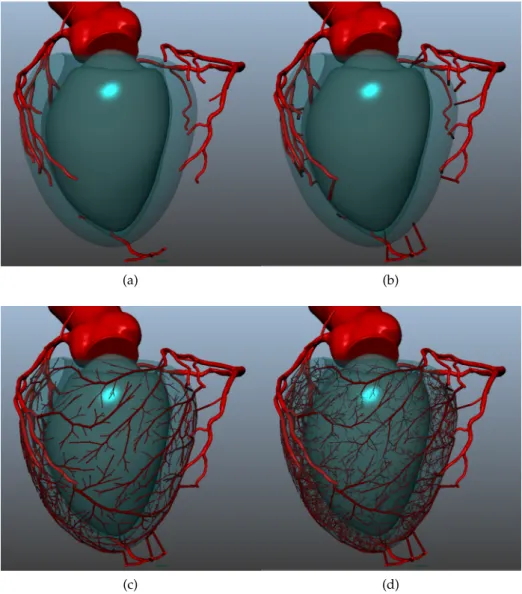
Enfin, nous transposons cette distribution de flux dans le format de cartographie polaire similaire à l’IPM, visible en figure 6. À cette
fin, nous décomposons le ventricule en 17 régions, selon un système de coordonnées polaires correspondant à la nomenclature de la lit-térature. Les flux associés à ces régions sont ensuite projetés sur la cartographie 2D représentant le ventricule. Cette représentation per-met une comparaison qualitative et quantitative avec les données de vérité terrain IMP.
(a) (b) (c)
Figure 6 – Conversion vers le format de cartographie polaire IPM. (a) Dé-composition du myocarde en 17 régions selon la nomenclature de référence. Les ellipsoïdes rouges définissent les axes du sys-tème de coordonnée polaires.(b)et(c)Projection de la distribu-tion des flux aux segments terminaux de chaque région dans la cartographie 2D. Résultat en condition de repos(b), et de stress
(c).
Nous avons appliqué ce pipeline sur 4 réseaux hybrides de patients peu symptomatiques. Les valeurs de flux, pressions et résistances dans les vaisseaux sont cohérentes avec la littérature. Cependant la distribution des flux à l’échelle du myocarde présente une
avec les données de vérité terrain. Le pipeline met donc en évidence les caractéristiques à améliorer.
Nous avons relié l’anatomie du réseau vasculaire à la distribution de flux dans le myocarde pour plusieurs patients. Cette analyse multi-échelle permet d’identifier des pistes pour affiner les méthodes de génération vasculaire et de simulation de flux.
Des améliorations indépendantes, à chaque étape du processus, peuvent désormais être mises en place et leur impact analysé sur l’en-semble de la chaîne. Notamment, pour la génération du réseau vascu-laire, le nombre de segments terminaux et leur distribution en surface ou dans le volume peuvent être étudiés pour identifier un paramé-trage spécifique du patient. De plus, l’extrapolation des flux vers le myocarde pourrait être simulée avec un modèle plus représentatif de la physiologie : un modèle poreux correspondant au lit capillaire du myocarde, couplé au modèle de flux dans les vaisseaux. Également, la résolution et palette de couleurs de la cartographie polaire seront améliorées pour affiner la comparaison qualitative avec les données de vérité terrain. Par ailleurs, la validation de ce processus devra être effectuée sur un plus grand panel de patients. Ce panel inclura des données avec une unique lésion aiguë du coronaire dont les consé-quences sur la perfusion du myocarde seront clairement identifiées dans les données IPM.
Cette extrapolation anatomique et fonctionnelle personnalisée est une première passerelle pour la simulation de perfusion du myocarde à partir d’imagerie tomographique scanner. La construction d’un tel modèle computationnel personnalisé fournirait de nombreuses pers-pectives. En particulier, ce modèle permettrait d’affiner les simula-tions de flux menées dans les larges coronaires pour FFRct, en four-nissant des conditions aux limites plus proches des caractéristiques du patient. De plus, la résolution de problèmes inverses via ce modèle améliorerait la planification du traitement. Ce modèle pourrait être élargi au ventricule droit et à l’ensemble des chambres cardiaques, pour produire une analyse plus complète du système. Dans une même approche, cette extrapolation anatomique et fonctionnelle pourrait être appliquée à d’autres organes. De tels modèles computationnels personnalisés bénéficieraient à la compréhension de physio-pathologies complexes et, enfin, à la santé du patient.
Parts of this project have appeared in the following publications.
a b s t r a c t p r e s e n t e d i n i n t e r nat i o na l c o n f e r e n c e
Clara Jaquet, Laurent Najman, Hugues Talbot, Leo Grady, Hyung Jin Kim, Irene Vignon-Clementel, and Charles J Taylor. « Hybrid image-based and synthetic geometric models for patient-specific sim-ulation of coronary blood flow from the large arteries to the my-ocardium. » In: World Conference of Biomechanics (2018)
i n t e r nat i o na l j o u r na l
To appear: Clara Jaquet, Laurent Najman, Hugues Talbot, Leo J Grady, Michiel Schaap, Buzzy Spain, Hyun Jin Kim, Irene Vignon-Clementel, and Charles A Taylor. « Generation of patient-specific car-diac vascular networks: a hybrid image-based and synthetic geomet-ric model. » In: IEEE Transactions on Biomedical Engineering (2018) pat e n t s
Leo Grady, Michiel Schaap, Charles A Taylor, and Clara Jaquet. Systems and methods for predicting perfusion deficits from physiological, anatomical, and patient characteristics. US Patent App. 15/088,733. 2016
Clara Jaquet, Michiel Schaap, Ying Bai, Leo Grady, and Charles A Taylor. Systems and methods for determining and visualizing a functional relationship between a vascular network and perfused tissue. US Patent App. 15/088,512. 2016
As my thesis directors, I would like to thank Laurent Najman and Hugues Talbot. I benefited tremendously from your wealth of ex-pertise as I have learned a vast amount through every good or bad working days. Through our collaboration I also acquired skills in patience and conflict resolution, which I am certain, will pave the grounds for my future endeavors. Thank you for your patience and your involvement all throughout these years.
With regard to sponsoring this research project I would like to thank HeartFlow. In particular I would like to express my deep grati-tude to the representatives who lay their trust in me for this topic, and advised me during this PhD: Charles Taylor, Leo Grady and Michiel Schaap. This work also involved many people within the company, I would like to thank specially Jin, Buzzy, Matthew, Karl, who closely contributed to the project. Also, a special mention for Kelly, Leslie, Laurence, Jean-Luc and Arnaud for providing ´smiling´support with data, tools and engineering processes. Thank you all for welcoming me during my visits and making me feel part of the company.
Irene Vignon-Clementel joined the project bringing in her skills and also a great support helping me to understand a field I was unfamiliar with. A warm thanks for your rigorous pedagogy and your continu-ous guidance. It was an honor to have you at the Presidence of the jury. Also, for his enthusiasm and passionate work a great thanks to Lazaros Papamanolis. I hope you learned at least as much as I did during our collaboration.
Thank you to Paul Knaapen and Roel Driessen for providing per-fusion data, and welcoming me at VU Medical Center. A special gratitude to Roel for the in-depth introduction to the clinical aspects of perfusion imaging.
I would like to thank Hervé Delingette and Frans Van De Vosse for their constructive and detailed review of my manuscript. Thank you to Patrick Clarysse for examining and sharing his skills while analyz-ing this research. Thank you to all three for your positive interest into this project.
This PhD would not have been successful without a warm personal support.
To my brothers in arms of the LIGM & ESIEE, we’ve been through so much all together! Thank you for bearing my moods, and comfort-ing me with tea-times, sweets, cheese or just spirit. It was indeed a pleasure to share the extra-work time with you all.
dent feelings all along those years. My fencing dream team: Mathilde, Celia, Tutu, and my Fée Clochette, nothing can defeat your positive energy. Geographically distant but supporting in spirit, thank you to Lisa, Yasemin, Fred and Quynh-Anh.
Finally I would like to thank my whole family for their care and support. Thank you to my grand-parents for their curiosity and ad-vice. Thank you Dad for encouraging me in superior studies, and your help to find the adequate words when it becomes important. Thank you Mum for pushing me further, with your joyful energy, and dealing with my americano-german accent. Thank you Victoire for your daily challenging scientific question, you did indeed prepare me for the defense! Thank you Pierre for watching over all of us.
I was lucky to have you all accompany me through all these years, and I look forward to the future steps...
Introduction 1
Personalized computational patient . . . 3
Coronary artery disease . . . 4
Perfusion . . . 5 Objective . . . 8 i va s c u l a r m o d e l g e n e r at i o n 11 1 c o n t e x t 13 1.1 Cardiovascular anatomy . . . 13 1.1.1 Heart anatomy . . . 13 1.1.2 Coronary tree . . . 14
1.2 State of the art . . . 16
1.2.1 Model derived from anatomical data . . . 17
1.2.2 Model constructed from functional principles . 19 1.2.3 Objective . . . 20 2 m e t h o d s 21 2.1 Assumptions . . . 21 2.2 CCO algorithm . . . 22 2.2.1 Tree growth . . . 22 2.2.2 Territory specificity . . . 23
2.3 CCO Forest: Extension of CCO to multiple trees . . . . 24
2.3.1 Forest initialization . . . 24
2.3.2 Forest growth . . . 25
2.4 CCO forest adapted to patient data . . . 26
2.4.1 Patient priors . . . 28
2.4.2 Patient-specific constraints . . . 30
3 r e s u lt s o n pat i e n t s 35 3.1 Data . . . 35
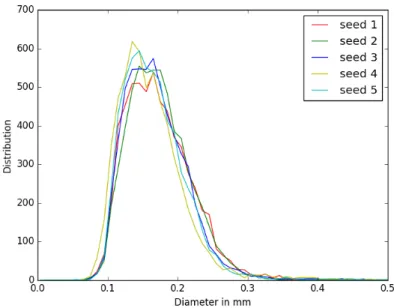
3.2 Testing algorithm repeatability . . . 36
3.3 Testing algorithm robustness . . . 38
3.4 Summary of the results . . . 47
4 a lt e r nat i v e m e t h o d o f va s c u l a r m o d e l g e n e r a -t i o n 49 4.1 Algorithm alternative . . . 49
4.2 Comparing RB algorithm results with PB results . . . . 49
5 d i s c u s s i o n 53 5.1 Perspective of improvements . . . 53 5.2 Limits of validation . . . 55 ii f u n c t i o na l a na ly s i s 57 6 c o n t e x t 59 6.1 Cardiovascular function . . . 59 xix
6.1.1 Cardiac cycle . . . 59
6.1.2 Coronary function . . . 60
6.1.3 Cardiovascular complexity . . . 60
6.2 Heart modeling: state of the art . . . 63
6.2.1 Existing models . . . 63
6.2.2 Coupled perfusion and coronary models . . . . 66
6.3 Objective . . . 67
6.3.1 Myocardium perfusion imaging data . . . 67
7 c f d i n c o r o na r i e s 71 7.1 Assumptions . . . 71
7.2 Model . . . 72
7.2.1 Boundary conditions . . . 73
7.2.2 Algorithm for the 1D model . . . 73
8 f u n c t i o na l a na ly s i s p i p e l i n e 77 8.1 Vessel flow . . . 77
8.2 Vessel pressure . . . 77
8.2.1 Study per element . . . 77
8.2.2 Study along segment order . . . 78
8.2.3 Study along vessel path . . . 79
8.3 Resistance . . . 83
8.4 Shear rate . . . 84
8.5 Terminal segment flows . . . 84
8.5.1 Relative distribution . . . 85
8.5.2 Distribution in myocardium . . . 85
8.5.3 Comparison with perfusion exams . . . 89
9 d i s c u s s i o n 95 9.1 Improvement and validation of the pipeline tools . . . 95
9.2 Validation of the personalized computational model ex-trapolation . . . 96
Conclusion 99 Achievements . . . 101
Framework : independent refinements . . . 101
Validation using the framework . . . 103
Perspectives . . . 104 iii a p p e n d i x 109 10 c c o i m p l e m e n tat i o n r e p o r t 111 11 c o n v e r g e n c e p r o c e s s 129 12 m o r p h o m e t r y s t u d y o n e p i c a r d i a l n e t w o r k s 131 13 m o r p h o m e t r y s t u d y o f e p i c a r d i a l c o r o na r i e s 133 14 va s c u l a r m o d e l r e s u lt s o n a d d i t i o na l d ata s e t 169 15 p o r o u s m o d e l, coupled with vascular cfd 177 15.1 Porous model equations . . . 177
15.2 Coupling . . . 179
15.2.2 Iterations . . . 181
15.2.3 Test results on simplified geometry . . . 181
15.2.4 Preliminary result on patient data . . . 187
15.2.5 Future work . . . 188
16 c o n t r i b u t i o n s 191
16.1 Personal contributions . . . 191
16.2 Contributions of collaborators . . . 191
p e r s o na l i z e d c o m p u tat i o na l pat i e n t
Nowadays, computer science assists physicians in many aspects of patient care.
Medical informations have become mostly digitized: anatomical and physiological parameters are stored in medical record, tracked by sensors via monitoring, or imaging techniques. Technology progress has enabled the acquisition of various signals from genetics to phe-notype expression, and digitize them. Such acquired signals can be very rich in content, from scalar value to multiple dimension matri-ces, thus computer science also provides tools to organize and classify them. These tools can sometimes help physicians to confront the pa-tient information with generic statistical models, in order to detect discrepancies.
In parallel, development has also occurred in the modeling field, to describe and simulate function of living organism at all scales: from the atomic to the whole body scale via molecular interaction, cellular metabolism, and organ systems. These models are derived from biology, physics, chemistry and mathematical laws describing a functional process, that have been theoretically and experimentally validated on many occurrences.
These two fields, digitized patient and functional modeling, have naturally converged to patient-specific modeling.
Medical imaging has shown spectacular progress in the last decades. It provides now a huge panel of spatial and time resolution, from cellular to macroscopique scale. Combined with extensive models of physiology, medical imaging provides powerful instruments: per-sonalized computational patient models, as termed in particular by Nicolas Ayache [5]. These instruments are defined by a generic com-putational model adapted to patient characteristics acquired from anatomical or functional imaging. These models provide quantifi-cation useful for diagnostic, predict pathological evolution or therapy effect, conduct treatment planning and even intervention assistance (with robotization, virtual or augmented reality). They allow to sim-ulate, learn and predict via less invasive exams, to improve patient care.
The personalized computational patient model has taken the re-search world by storm, connecting clinical, industrial and academia with many collaborations. Current organ related projects mostly
cus on brain and cardiovascular diseases. National and international organization like the Brain initiative (USA, starting in 2013), human brain Project (Europe, starting in 2013) bring researchers together from public and private fields to cooperate. Similarly in cardiovas-cular, the euHeart project set up by the European Commission from 2008to 2012, with 16 partners, involving in particular Philips, has con-tributed to better healthcare, device innovation, and the Virtual Phys-iological Human environment. Now the Living Heart project leaded by Dassault, with close to 100 partners, is currently investigating sev-eral possibilities for patient specific modeling, pushing forward its use in all medical aspects.
HeartFlow Inc is a successful pioneer in medical service provided from personalized computational patient modeling. They propose a non-invasive solution for coronary artery disease diagnostic, which is detailed in the next section. With more than 10 000 patients having so far benefited from HeartFlow’s analysis, the company is revolu-tionizing cardiovascular clinical care. Accounting for more than 150 patents and publications, the company looks forward to improving patient care with innovative techniques. HeartFlow sponsored this academical research project, and invited the VU Medical Center car-diology team to join it as a clinical partner. On the academic side, this project assembled researchers from Laboratoire d’Informatique Gaspard Monge (LIGM) at Université Paris Est and REO team of IN-RIA. The LIGM A3SI team contributed with skills in image analysis, image processing and optimization while the REO project-team of IN-RIA provided expertise in numerical simulation of biological flows and cardiac electrophysiology.
c o r o na r y a r t e r y d i s e a s e
Coronary heart disease (CHD) is the leading cause of death world-wide, affecting millions of people in both developed and developing countries. It is caused by atherosclerosis: build up of fats, cholesterol and other substances in the coronary artery walls, resulting in waxy plaques. If these lesions restrict blood flow, this can lead to ischemia, which damages the heart muscle.
Biomedical research has brought up several kinds of therapy to prevent or cure CHD. According to a severity triage, the patient can be treated with drug medical therapy, implanted stent, or bypass surgery, as shown inFigure 7.
Risk to the patient and costs increase at each of these steps. Hence assessment of disease severity is a crucial parameter to to provide the best care to the patient. This triage can be established from different exams, which can be divided into two groups. One group of exams focuses exclusively on the anatomy (e.g. are there significant
steno-Figure 7 – Treatments for coronary artery disease according to severity.
sis that may benefit from stenting?), while other modalities focus on physiology and function (i.e. are there regions of myocardial muscle tissue under-perfused as a result of these stenoses? is flow obstructed inside coronaries?).In the functional group, Fractional Flow Reserve (FFR) is a gold standard exam to measure pressure in the vessel be-fore and after the lesion using a pressure sensor catheter during an invasive coronary exam [78], [29].
HeartFlow has developed the first non invasive cardiac exam bridg-ing anatomy and physiology fields: FFRct, standbridg-ing for "FFR esti-mated from Computed Tomography". The process is presented in figure 8. It relies on X-Ray CT, an exam to acquire a 3D
anatomi-cal image. The acquisition is achieved following standard protocol defined by the Society of Cardiovascular CT [2]. In the produced car-diac image, vessels are detected and segmented with a proprietary process to build a 3D model of the arteries. The model accuracy is highly relevant thus it is verified by experts after automatic computa-tion. The personalized 3D model is then used to simulate blood flow and calculate blood pressure, in order to assess global disease severity and detect hemodynamically significant lesions on the coronary tree [97]. Hence FFRct links both anatomical and functional analysis of the coronaries. However this exam does not provide the relationship between vessel disease and the affected myocardium territory.
c a r d i a c p e r f u s i o n
Myocardium Perfusion Imaging (MPI) provides local information about the amount of oxygenated blood transported to the myocardium. The comparison between rest and stress conditions highlights the re-gions with a perfusion deficit. Contrast attenuation maps are created which are overlaid on the left ventricle representation, and possibly correlated with coronary images. Physicians use this type of exam to estimate blood transport from the coronary compartment to the
my-Figure 8 – FFRct: process of the diagnosis tool
ocardium. Depending on the MPI modality, the myocardial blood flow (MBF) measure can be qualitative: with only a visual analy-sis; semi-quantitative: using the relative difference between rest and stress; or quantitative: by providing the absolute MBF value. The two latter measures have the advantage of minimizing the subjective influ-ence of the analyst. However, the absolute MBF can only be obtained from dynamic acquisition.
Cardiac perfusion modalities
Four major modalities currently exist in MPI, relying on different physical principles.
Single Photon Emission Computed Tomography (SPECT) measures a radioisotope contrast agent concentration via the detection of single photon emission resulting from the radioisotope desintegration. It is the most commonly used in clinic. It provides qualitative and semi-quantitative measures [73]. For research purpose images are acquired dynamically in order to obtain quantitative measures. Because of its lowest resolution, SPECT demonstrates lower sensitivity and speci-ficity than other MPI modalities.
Positron Emission Tomographie (PET) measures radiotracer con-centration by detecting an indirectly produced correlated pair of pho-ton. This modality is routinely used to provide qualitative and semi-quantitative measures [104], but can additionally provides absolute MBF when acquired dynamically. This modality necessitates a high equipment cost for the radiotracer production.
Cardiac Magnetic Resonance Imaging (CMR) measures molecular relaxation time shortening under nuclear magnetization, which is pro-portional to the concentration of contrast agent. This modality is mainly interpreted with visual analysis for clinical purpose [73]. The
measure of absolute MBF is currently only performed in research [104] due to relatively complex post processing steps.
CT Perfusion (PCT) measures the X-Ray attenuation of an injected contrast agent. Because of radiation exposure, it is mostly applied as a static imaging process on patients, consequently providing only qualitative and semi-quantitative measures [104].
The typical output of MPI is a 2D representation of the myocardium perfusion decomposed into 13 or 17 regions, called a polar map. Based on statistical distributions, these regions correspond to coro-nary vessel territory, that help identify the main diseased vessels.
Several work have associated MPI to coronary anatomical imaging in order to relate vessel disease to perfusion defect [13], [27]. However they only provide a spatial relationship and requires to double the number of exam for the patient. Thus all MPI modalities share the similar limitations:
— In clinical practice no quantitative measure is provided, only the relative perfusion between territories is assessed, which makes analysis dependent on the identification of normal perfusion regions. Without an absolute MBF measure, there is no blood transport quantification available in this exam: only quantifica-tion in the myocardium compartment.
— The correspondence established between obstructive coronary artery lesions and myocardial regions with a perfusion defect is only a spatial one derived from group statistics and is not patient-specific.
— There is a gap between the visible vascular anatomy and my-ocardium flow distribution. In this gap physicians are mak-ing assumptions about the vessels that are too small to image, the microvasculature distribution and how blood is transported through the vascular system.
— The most common perfusion tests are expensive and require injection of a radioactive contrast agent that increases a patient’s radiation exposure.
Consequently, MPI is not able to functionally relate myocardium perfusion to obstructive disease in the large coronary arteries. This prevents accurate identification of the vessels that may benefit from revascularization therapies such as coronary stenting or coronary artery bypass grafting.
However, Lo et al. have shared some evidence [26] demonstrating MPI information can beneficial to blood flow modeling in diseased coronaries. This work-in-progress illustrates the value of the func-tional relationship between coronary and myocardium compartments. Extending the functional coronary information from FFRct with in-formation on patient specific myocardium perfusion would enable practitioners to accurately assess the perfusion system and quantify
it. Such a tool would relate lesions directly with the impacted myocar-dial tissue and thereby overcome the above-mentioned downsides of MPI. Moreover, in contrast with other perfusion techniques, no addi-tional perfusion exam would be needed.
o b j e c t i v e
The goal of this project is to extend the functional analysis of FFRct from the coronaries to the myocardium compartment. This requires the extension of the coronary model to microvasculature scale com-bined with a functional analysis leading to the myocardium. As in MPI, this blood flow simulation will focus on the left ventricle my-ocardium.
Extend the coronary model to microvasculature scale
HeartFlow’s coronary tree model provides the main vessels and sub-branches. This coronary tree should be extended to arteriole ves-sels in order to populate the left myocardium compartment. The space filling coronary model has to respect anatomical and physio-logical constraints of the patient. It can potentially be modeled as an optimization problem with topological requirements and an energy formulation.
Functional analysis pipeline
A set of instruments to analyze the blood transport function of the generated vascular model needs to be produced. This pipeline re-lies on hemodynamics law applied to the patient-specific vasculature, for two physiological conditions: rest and stress. It should provide a blood flow distribution analysis within the left myocardium, and should enable comparison with MPI ground-truth data.
This manuscript is divided in two parts.
The first one focuses on the vascular network generation. The first chapter introduces the cardiovascular anatomy and provides a review of vascular generation model that can be found in the literature. We propose a method for patient-specific vascular network generation in chapter 2. The third chapter analyzes morphometry of the re-sults obtained when applying this method to a set of patients. In the fourth chapter we compare our proposal with an algorithmic al-ternative, then we discuss perspectives and validation in the chapter 5.
The second part of this work provides a functional analysis of the generated vasculature. We introduce the cardiovascular function and blood flow modeling state of the art in the chapter 6. In the next
chapter, we propose a method for vessel blood flow modeling com-patible with our vascular model. Chapter 8 provides the combination of functional analysis tools to assess blood flow distribution in the vessels and the myocardium. We discuss this pipeline in chapter 9.
Finally we summarize our contributions, discuss limitation, valida-tion and perspectives in the conclusion.
VA S C U L A R M O D E L G E N E R AT I O N
In this part we present the vascular model generation work. In the first chapter we introduce the context of this topic, cardiovascular anatomy, and current state of the art. Then in a second chapter we describe our method to gener-ate patient-specific vascular network. In the third chap-ter we present the results obtained for several patients. The fourth chapter compares results of the current method with an alternative form of the algorithm. And finally in the fifth chapter we discuss perspectives and validation.
1
C O N T E X T
1.1 cardiovascular anatomy 1.1.1 Heart anatomy
The human heart is a muscular organ that pumps blood via the cir-culatory system throughout the body. It is composed of 4 chambers, presented inFigure 9.
Figure 9 – Heart anatomy, figure from WebMD [106]
— The atria, two superior chambers, receive the blood from veins: — The right atrium receives blood returning from the body via
the superior and inferior vena cavae.
— The left atrium receives the oxygenated blood via the pul-monary veins.
— The ventricles, two inferior chambers, which receive blood from each respective atrium via valves, and propel it out of the heart. — The right ventricle pumps blood through the pulmonary
artery to the lungs for oxygenation.
— The left ventricle pumps oxygenated blood via the aorta throughout the body.
The walls of the heart chambers are primarily composed of cardiac muscle. The myocardium is a single unit functional cardiac muscle, whose cells all contract simultaneously. The two ventricles form a myocardium, and the two atria form a second one. In this project, we will focus on the ventricle myocardium (referred in this paper as myocardium).
The heart wall is defined by 3 layers, see figure10.
— The epicardium covers the surface of the heart, it functions as a protective layer.
— The myocardium (or mid-layer) is the muscular wall of the heart consisting of cardiac muscle cells wrapping around the myocardium in a spiral.
— The endocardium covers the inner surface of the heart, it delin-eates the blood pools of each ventricle.
The whole heart is enclosed in a pericardial sac containing serous fluid, that minimizes friction during heart contractions. The largest coronaries lay within this pericardial cavity along the epicardium.
Figure 10 – Heart wall (figure from Weinhaus [8])
1.1.2 Coronary tree
As with all organs, the heart requires a blood supply. The aorta gives rise to arteries, which bring blood to the myocardium.
Epicardial arteries, referring to arteries on the heart surface, are called coronaries because of their (upside down) crown shape. Small arteries arise from these epicardium vessels to perforate the myocardium wall, bringing blood to muscle cells toward the endocardium, cf Fig-ure 11 (a). The arteries subdivide into arterioles (100–300 µm diame-ter), that keep subdividing themselves, becoming thinner and thinner to end as millions of capillaries (5–10 µm diameter).
(a) (b)
Figure 11 – Coronary anatomy. (a) The whole coronary artery tree: from epicardial vessels to arterioles. (b) Main coronary arteries aris-ing from aorta: RCA, LAD and LCX. Figure from Texas Heart Institute [1].
Coronary arteries are presented in figure Figure 11 (b), they arise on aorta from two origin points called ostia.
— One ostium is located on the right side of the aorta, above the right ventricle. It corresponds to the origin of the Right
Coro-nary Artery (RCA). This main vessel runs on the right side of the myocardium, and often reaches the posterior side of the left myocardium.
— One ostium is located superior to the left ventricle on the aorta, corresponding to the Left Main root (LM). This coronary is di-vided into two main segments : Left Anterior Descending (LAD) and Left Circumflex (LCX). Both theses main vessels run on the left side of the myocardium.
Biologically, coronary tree dominance is defined according to the main artery innervated by the atrioventricular node. This establishes the major difference in anatomic structures [30] :
— A right dominant coronary tree presents a major RCA vessel to supply the posterior side of the myocardium. Approximately 70% of people have a right dominant coronary tree.
— A left dominant coronary tree has a major LCX vessel to sup-ply the posterior side, it is presented in approximately 20% of people.
— A co-dominant coronary tree, existing in 10% of people, is equiv-alently blood supplied by both RCA and LCX.
1.1.2.1 Detailed coronary organization
Originally, detailed coronary anatomy studies were conducted ex vivo through vascular casting and histology on sectioned myocardium tissues. Because of ethical constraints relating to such protocol, coro-nary anatomy has first been mainly studied on pigs [59], [105], [60], [101]. Kassab’s work [59] is a major reference providing the first, still most complete statistical data of the entire porcine coronary vascula-ture. However the information for vessels below 0.4 mm in diameter are independents from their parents: the histological study does not enable to connect micro-vasculature to the larger diameter arteries. A few studies on human coronaries were conducted on small amount of post mortem data [113], but only focused on epicardial vessels [65].
In addition of statistical analysis, these studies enabled to observe a physiological principle of minimum work previously defined by Murray [74]. This principle applies on bifurcation level to relate par-ent and children radii with a power law. Zhou et al. have generalized this principle to tree scale, and validated it on Kassab’s statistical data [114]. From this study they provide a stem-crown scaling rela-tionship connecting stem diameter and subtree volume with a power law. Later on, Kassab et al. [57] show that this principle applies in other vascular and pulmonary trees, to minimize both cost of the tree structure construction, and fluid conduction. At the micro-vascular scale, the histology studies highlighted capillary organization follows myocytes (muscular cells) orientation.
In the last decades, progress in imaging technologies have enabled to provide whole heart visualization, with semi or fully automatic
measurements of the extracted coronary model. X-ray angiography (on human [25], or dogs [95]), and CT ([111]) allow the analysis of large to small coronaries. With a higher irradiation level, micro-CT enables the visualization of smaller vessels down to a few microme-ter in diamemicrome-ter, to visualize whole rats coronary network [37]. And recently, an ex-vivo protocol, cryomicrotome fluorescence imaging provides complete arterial coronary vasculature. It is applied on dog and pig hearts [40], [81], and on a single human dataset, by Rivolo et al. [81].
These imaging studies have confirmed the previously evoked stem-crown relationship. Van Horssen et al. [39] even described a func-tional stem-crown relationship, relating stem flow to the crown vol-ume, and demonstrated how the scaling laws vary depending on depth of the coronary tree. In addition, with the continuity of the extracted structures (from macro to micro vessels) and their location within the myocardium, Van Horssen et al. [100] highlighted a coro-nary structure depending on myocardium layer destination. They demonstrate that the endocardium is perfused by a small subset of penetrating arteries.
1.1.2.2 Vascular classification
To analyze the whole coronary vasculature, several classification methods have been established, which assign a generation between ostium and capillary vessels to each segment.
The major classification system was defined by Strahler [94]. It originally comes from geographical studies ([41]): it has been used then for bronchial tree, pulmonary arteries and veins by Horsfield [38]. Several Strahler classification methods have been proposed with evolution:
— The first method assigns order starting from the leaves (0), and increase order at each bifurcation.
— In the second Strahler method, a constraint is added. If gener-ation 3 meets genergener-ation 2, parent vessel remains genergener-ation 3 (instead of 4), so method handles asymmetry.
— The third method is called Diameter Defined Strahler Order (DD Strahler), and was created by Kassab [59]. It reproduces Strahler’s system, but uses radii intervals to determine the gen-eration. It defines 11 radius ranges, from generation 1, corre-sponding to pre-capillaries (about 10 µm in diameter) to gener-ation 11, corresponding to largest epicardial coronaries (around 3 mmin diameter).
1.2 state of the art
In the last two decades, advances in the medical imaging field have enabled detailed in vivo studies of the human coronary arteries in
health and disease [3]. However the resolution limitations of available noninvasive medical imaging devices (CT, MRI, etc) have prevented the detection of vessels below the epicardial level. At present only ex-vivo acquisition protocols such as using cryomicrotomes have made it possible to segment the microvasculature [32], a procedure that cannot be applied on a living human heart. Consequently computer generated vascular models have been proposed to simulate and study the flow distribution down to the microvasculature level.
Vascular model generation methods can be classified in two cate-gories: either derived from anatomical data or built from functional principles.
1.2.1 Model derived from anatomical data
Many generated models are derived from anatomical data. They use the Strahler ordering and connectivity matrix defined by Kassab et al. from porcine hearts [59].
Single vascular trees were first generated in 2D, by Mittal et al. [70], involving only length and diameter. This model subjected to blood flow analyzis [71] showed a power law relationship between stem diameter and crown flow.
Kaimovitz et al [50] adapted vascular networks to the 3D ventri-cle geometry. They partition the network into 3 sub-networks corre-sponding to myocardium layers: epicardium, transmural myocardium and endocardium. For each of these they assign topology and geom-etry according to Kassab’s morphomgeom-etry (depending on main vessel name). The reconstruction of the subnetwork is constrained to lay in a specific space: 3D for transmural, 2D for epicardial and endocar-dial. It ensures anatomy constraints depending on the myocardium regions: left or right ventricle. In the end they concatenate the sub-networks, and improve the connections with annealing algorithm. The generated left and right coronaries are shown in figure 12. The
authors compared many morphometry characteristics of their model with references but did not provide a functional assessment of the generated vasculature.
Smith et al. proposed an extension of a segmented epicardial net-work, from a canine epicardial dataset [91]. The geometry and topol-ogy of the tree follows Kassab’s morphometry data. The spatial lo-calization of each new edge is determined by optimizing a cost func-tion depending on self avoidance, boundary avoidance, and hemo-dynamic bifurcation. The result is presented in figure 13. Based
on this multiple tree generation method and Kassab’s morphometry data, Bassingthwaihte et al. [7] have produced a coronary model for an hemodynamic study. The model of the Left Anterior Descending vessel (LAD) is constrained in either a slab or a cylinder space, and
composed of ten million segments. The filling space network is not fully satisfying as it presents small unrealistic knot-like structures. The estimated pressure upstream and downstream for each segment diameter does not agree with the literature for the endocardium, but was correct for the epicardium. Despite some unrealistic features, this anatomically derived model performs well as a starting point for blood flow simulation demonstrating spatial flow pattern similar to observations in normal hearts.
Figure 12 – Figures from Kaimovitz [50] : A rendering of the entire arterial
tree consisting of the epicardial, transmural and perfusion sub-networks
Figure 13 – Figures from Smith [91] : Antero(left) and superior view (right)
of the inner ventricular surface, the extended epicardial mesh until the generation order 6
1.2.2 Model constructed from functional principles
Other vessel tree generation methods aim to satisfy functional prin-ciples. They all share two main assumptions. First, flow is evenly distributed into the perfused volume. Second, Nature attempts to achieve its goal with minimal work. Such idea leads to the resolution of optimization problems, where the function to be minimized can be diversely defined.
The global optimization method introduced by Georg et al. in 2010 [31] defines random points in the perfused volume and generate the intermediate vasculature that minimizes the total vascular volume. The optimization produces suboptimal global structures, and goes on until all random points are connected into a single tree. This method has been used to generate liver vasculature which showed anatomi-cal correspondence with statistics from experimental data, but was not functionally assessed. Another tree generation approach was presented, by Tawhai et al. [96] and validated for bronchial airway models against statistical data. This approach uses a Monte Carlo re-cursive algorithm, which constrains bifurcation angles and segment lengths. The single tree generation methods [31] and [96] have been validated only for convex shape territories and do not rely on fluid dynamic law.
In contrast, the Constraint Constructive Optimization (CCO) method proposed by Schreiner et al. [85] relies on hemodynamic principles, and was adapted to the concave shape of the left ventricle [86]. The CCO method consists of a single tree angiogenesis simulation gov-erned by minimizing a target function: the total tree volume. It satis-fies two haemodynamic laws at bifurcation scale: Murray’s law and Poiseuille’s law (physical law defining the pressure drop in a tube). This single tree generation algorithm has evolved from Schreiner’s work in 2D [85], to 3D [54], then staged growth [55], and has fi-nally been adapted to the left ventricle concave shape [86], see figure 14. Karch et al. demonstrate that flow properties of 3D simulated
models approximate experimental data well [56]. This algorithm has also been adapted to generate connecting artery and veinous tree in liver by Kretowski [63] to simulate CT images showing contrast agent propagation. An extension of the algorithm was also proposed by Blanco et al. [11], performing subdomain partitionning based on flow distribution, before growing a single tree in each subdomain. How-ever, if the result looks plausible, the domain partitioning has neither been validated against ground-truth data, nor adapted to cardiac con-cave territory.
Another recent method has been proposed by Keelan et al. [61], that also handles non convex territory for vascular networks. It mini-mizes pumping power and blood volume with a simulated annealing
(a) (b) (c) (d)
Figure 14 – CCO algorithm evolution: result visualization of (a) 2D CCO [85],(b) 3D CCO [54], (c) Staged growth CCO [55], (d) Non
con-vex CCO for LAD [86]
approach to generate left and right coronary models. The generated vasculature matches the pig morphometry as analysed by Kassab but has not been functionally assessed. In addition this method is conve-nient for generating a complete vasculature, but uses no prior infor-mation on the epicardial network that can be extracted from cardiac CT.
1.2.3 Objective
Methods derived from anatomical data are based on animal stud-ies and not human data, thus we cannot ensure they are representa-tive of patient morphometry. In addition, with the aim of deriving a functional analysis from the generated vascular network, it seems more coherent to rely on functional principles for its construction. To generate a patient-specific model we must use all available priors, in particular the segmented epicardial arteries. Extension of this image based model requires a multi-tree network generation method. We describe this method in the following chapter.
2
M E T H O D S
2.1 assumptions
Here we describe the assumptions and parameters we used to build our vascular trees. The tree is constituted of cylindrical segments. It begins with a root segment, and all downstream end segments are called terminal segments. The produced tree is binary and its total number of segments is calculated from the number of terminal segments nterm:
ntot =2nterm−1 (1)
The terminal segments correspond to arteriole level, feeding a non-modeled vasculature. The whole tree and non-non-modeled micro-vasculature are embedded into a determined volume referred to as the perfusion territory.
The blood is modeled as an incompressible, homogeneous Newto-nian fluid, under a steady state. It is approximated as fully developed, unidirectional, axisymmetric flow in cylindrical geometry under lam-inar flow conditions. The resistance R and the pressure drop ∆p of a segment j are defined according to Poiseuille’s solution by:
Rj = 8µ π lj r4j (2) ∆pj=Rjqj (3)
with µ the viscosity, and l, r, q respectively the segment length, radius and flow. The total resistance of the tree is calculated recursively by tree decomposition into segments, considering parallel and serial arrangements. The flows at all terminal segments qtermare equal, and
delivered into the micro-circulation. Because of flow conservation, the sum of the qterm corresponds to the perfusion flow at the root
qperf.
The tree is subjected to Murray’s law [74], with a power law coeffi-cient γ set to 3.
rγ0 =rγ1 +rγ2 (4)
The law is derived from ideal conditions, and in reality the γ observed in coronaries varies between 2 for large vessels and 3 for small ones [101],[114],[57],[66], [109]. Since we generate vessels below the CT res-olution of the segmented network, we use a value of 3, corresponding to a range from small arteries down to arterioles.
2.2 cco algorithm
The CCO algorithm combines computational fluid dynamics laws, network geometry and topology optimization to simulate vascular network growth. Below we summarize the algorithm proposed by Schreiner [86] which is the basis of our method. The fully detailed implementation of the CCO method is described in appendix 10.
2.2.1 Tree growth
In Schreiner’s method the tree is constrained into a growing perfu-sion territory, and the target function minimizes the total tree volume, which is calculated considering the segments cylindrical shape:
tv =π nXtot
j=1
ljr2j (5)
Knowing the final volume of perfusion territory vperf the
micro-circulatory black box volume µbox [85], i.e. average perfusion territory of each terminal segment, is defined:
µbox =vperf/nterm (6)
The number of terminal segments in the tree, at the current step of the algorithm is called kterm. Before each new added segment, the
current perfusion territory volume vkterm is incremented by one µbox to simulate tissue growth concomitant with vascular growth. All seg-ments and their radii are stretched correspondingly to this volume inflation. The territory at step kterm, before adding a new segment,
has a corresponding volume :
vkterm = (kterm+1)× µbox (7)
Note that we do not recalculate positions after tree stretching but compute a conversion of any distance d (length, radius or others) measured from the final world fworldto the kworldvia a scaling factor (explained in appendix10): dkworld =dfworld× 3 r kterm+1 nterm (8) Segments are added one by one and subject to both local-scale optimization (at the single bifurcation scale) and global-scale opti-mization (at the tree scale), as detailed below. A random location, new_loc, is picked under geometrical and physiological constraints to be used as a candidate for segment extremity. Its connection is tested with neighboring segments: the two points defining the neigh-boring segment and new_loc are joined at a bifurcation point. Each
connection is subject to a local optimization: the bifurcation point location minimizes the bifurcation volume under the constraints of determinant flow, following Kamiya’s work [53]. Since the segment joining the bifurcation point to new_loc is a terminal segment, by definition it carries a flow qterm. After adding the new bifurcation,
the tree flow is incremented by one qterm and the hydrodynamic
re-sistance of the tree must be adjusted by recursively traversing all sub-trees, and propagating a radius rescale up the tree. The optimal con-nection is then selected among all concon-nections as the one minimizing the target function (total tree volume tv), to achieve the global
opti-mization process.
2.2.2 Territory specificity
In the original CCO method [85] the perfused volume is assumed convex and homogeneously filled. In a subsequent article [86], Schreiner et al. adapt the growth specifically to the left ventricle wall shape, which is a non-convex territory, and induce a perfusion gradient.
To achieve adaptation to a non-convex territory, they define a func-tion similar to an electrical potential to represent a non convex do-main between two isosurfaces [86]. Ranging from 0, the outer sur-face, to 1, the inner surface of the ventricle wall, the function w(x), provides a continuous and differentiable interpolation of the domain. Schreiner uses this spatial information during tree growth to confine the generated bifurcations inside the perfusion domain. We compute the domain function with a discrete Poisson solver called the random walker algorithm [33].
In addition, the domain function is used to define different stages of the growth. To reproduce the vessel distribution wrapping the ventricle surface before penetrating the myocardium layers, Schreiner uses the principle of staged growth defined by Karch [55]. The first segments generated are constrained to a thick hypersurface corre-sponding to the epicardial layer. Then, in a second stage, the vascular growth is extended inside the myocardial volume of the whole left ventricle, called hereafter the ventricular volume. During this second stage, the target function is weighted with the domain function w:
tv,s=π nXtot
s=1
lsr2sw(ms) (9)
with msthe segment midpoint.
Finally, the domain function is also used for a last purpose. As observed by Buss et al. [12], the perfusion density is actually in-homogeneous: the density of arterioles and capillaries in the endo-cardial layers is higher than in the epicardium. This gradient of per-fusion density can be modeled according to the domain function: the new terminal segment locations are subject to a distribution test. This
test ensures that the density of accepted points increases closer to the endocardium layer. As in [86], we use a factor of 3 between epi-cardium and endoepi-cardium terminal segment density.
2.3 cco forest: extension of cco to multiple trees To produce a patient specific vascular network, we aim at extending the downstream vasculature of a segmented model holding multiple epicardial coronaries. Hence the method is required to generate sev-eral vascular trees inside the same territory. In order to gensev-eralize the angiogenesis to multiple trees, such as in a physiological process, these trees should grow in a simultaneous manner. This contempora-neous growth intrinsically induces competition between trees.
Here we propose an innovative method enabling growth of several competing trees within the same perfusion territory. We call the asso-ciation of F trees inside a single perfusion territory a forest. We seek to minimize its total volume defined by:
Tv = F
X
i=1
tiv (10)
The forest growth is built following principles similar to CCO: terri-tory growth concomitant to tree growth. These trees grow in a com-petitive process depending on their relative inlet flow. From here on, variables relative to a forest start with a capital letter, and those relative to single trees start with a lowercase letter.
2.3.1 Forest initialization
First, we define the forest parameters. Vperf and Nterm are
respec-tively the perfusion territory volume and the total number of terminal segments that the forest needs to reach. During forest growth we cal-culate Kterm, the total number of terminal segments belonging to all
the trees, and we end growth when it is equal to Nterm. Each tree is
initialized with a root radius rroot, and a target inlet flow qtarg that
the tree has to reach at the end of the forest growth.
We can calculate the total forest flow Qperf that has to be reached
at the end of the forest growth, and considering an homogeneous distribution, the flow at each terminal segment of the forest Qterm is
estimated: Qperf= F X i=1 qitarg (11)
In a similar fashion as CCO algorithm, the micro-circulatory black box volume is calculated with:
VMbox=Vperf/Nterm (13)
As in the CCO algorithm, each tree is initialized with a random first segment, the root segment. The positioning of the root segment can be critical to promote tree growth, particularly so for close neigh-bors (a segment could block path of its neighbor). We constrain the maximum root segment length to be proportional to the flow ratio between the tree and its closest neighbor. The maximum length crite-rion li
maxfor each root segment is:
limax = d i cnqitarg qcn targ+qitarg (14) In this formula, di
cn is the distance to the closest neighbor tree, qitarg
is the target flow of the considered tree, and qcn
targ is the target flow of
its closest neighbor. With this constraint, tree roots cannot block the future territory of their neighbors.
2.3.2 Forest growth
When growing several trees in the same territory, a competition takes place. In order to obtain a coherent distribution, we influence this competitive process with relative tree flow.
For each tree we know the target flow qtarg that the tree has to
reach at the end of forest growth, and the flow at each step of the forest growth qKterm. We identify the largest flow qbtarg carried by the
tree of index b.
During growth, each tree growth speed depends on its relative flow, meaning its flow relative to the largest tree flow. trees are not allowed to grow when their current flow does not correspond to the final forest flow distribution. After each added segment, for all trees i we calculate the relative flow at step Kterm:
χiKterm =qiKterm/qbKterm (15)
and compare it with the target relative flow:
χitarg=qitarg/qbtarg (16)
If χi
targ> χiKterm, the tree is "activated", meaning it can get new connec-tions. Otherwise, its growth is temporarily suspended. An exception is made for the largest flow tree, which is only constrained by its target flow qb
targ.
The method is described in the flow chart Fig. 16. As a proof of
a 2D, non-convex simple geometry territory, see Fig. 15.
Physiologi-cal parameters used were in a similar range as Schreiner ’s et al [85]. These simulations correspond to 3 different flow distributions, which are tested with 3 different random seeds. The average attained flows over the 3 different random seeds are presented in table 1. Also, in
this table we present an estimation of tree perfusion territory calcu-lated from a discrete Voronoi tessellation, also known as skeleton by influence zone [89], using terminal segment locations as markers. With this method we observe an average relative error of 2 × 10⁻³between
target and attained flow for all trees. The area of the perfused terri-tory is proportional to attained tree flow with a correlation coefficient of 0.991.
This simultaneous tree growth method works for two or more com-peting trees, which is an important improvement with respect to the original CCO technique. In particular it can be used to extend the segmented coronary model, as we discuss in the next section.
(a) (b) (c)
Figure 15 – Example of forest growth proof of concept in simulated 2-D non convex territories, with varying flows. (a) : equal target flow. (b): upper tree flow twice the bottom tree flow. (c): upper tree flow 9 times the bottom tree flow. The colormap represents the potential function from 0 (blue) to 1 (red).
Table 1 – Measures on CCO Forest results
Simulation 1 Simulation 2 Simulation 3
tree 1 tree 2 tree 1 tree 2 tree 1 tree 2
Target flow (%) 50 50 66.7 33.3 90 10
Attained flow (%) 50.1 49.9 66.7 33.3 90.03 ± 0.05 9.97 ± 0.05
Territory (%) 55.6 ± 0.8 44.4 ± 0.8 67.5 ± 0.8 32.5 ± 0.8 89.0 ± 0.4 10.9 ± 0.4
2.4 cco forest adapted to patient data
The primary goal of the proposed methods to create hybrid image-based and synthetic geometric trees is to extend the segmented
epi-Inputs:
Number of terminal segments: Nterm
Final perfusion territory volume:Vperf
Number of trees:F
For each tree: root location,rrootand target flowqtargi
Initialization:
VMbox = Vperf/Nterm
Qterm = Pqtargi /Nterm
Define 1stconstrained random segment for each tree
Current nber of terminal segments in forest:Kterm = F
Current territory volume: VK = Kterm × VMbox
Current forest flow:QK = PqiKterm = Kterm× Qterm Increment territory:VK = (Kterm+ 1) × VMbox
Set each tree activity based on its current flow
see section 2.3.2
Pick 1 constrained random location Find 20 closest neighbor seg-ments belonging to active trees
Optimize bifurcation Update tree flow and radii
see section 2.2.1
All constraints satisfied
see section 2.4.2
Eliminate connection Store forest volume
For each neighbor segment : connection test
Nber of forest volumes stored≥ 1 Permanently add connection with smallest volume
Kterm = Kterm + 1 Kterm= Nterm End YES NO YES YES NO NO