HAL Id: insu-03093638
https://hal-insu.archives-ouvertes.fr/insu-03093638
Submitted on 4 Jan 2021
HAL is a multi-disciplinary open access
archive for the deposit and dissemination of
sci-entific research documents, whether they are
pub-lished or not. The documents may come from
teaching and research institutions in France or
abroad, or from public or private research centers.
L’archive ouverte pluridisciplinaire HAL, est
destinée au dépôt et à la diffusion de documents
scientifiques de niveau recherche, publiés ou non,
émanant des établissements d’enseignement et de
recherche français ou étrangers, des laboratoires
publics ou privés.
Precise positioning of Chang’e 3 lander based on
Helmert-VCE-aided weighting method using phase delay
data from Chinese VLBI Network
Shanhong Liu, Jianguo Yan, Qingbao He, Jianfeng Cao, Mao Ye, Jean-Pierre
Barriot
To cite this version:
Shanhong Liu, Jianguo Yan, Qingbao He, Jianfeng Cao, Mao Ye, et al..
Precise
position-ing of Chang’e 3 lander based on Helmert-VCE-aided weightposition-ing method usposition-ing phase delay data
from Chinese VLBI Network. Advances in Space Research, Elsevier, 2020, 66 (6), pp.1485-1494.
�10.1016/j.asr.2020.05.034�. �insu-03093638�
Precise positioning of Chang’e 3 lander based on Helmert-VCE-aided
weight-ing method usweight-ing phase delay data from Chinese VLBI Network
Shanhong Liu, Jianguo Yan, Qingbao He, Jianfeng Cao, Mao Ye, Jean-Pierre
Barriot
PII:
S0273-1177(20)30367-7
DOI:
https://doi.org/10.1016/j.asr.2020.05.034
Reference:
JASR 14806
To appear in:
Advances in Space Research
Received Date:
6 November 2019
Accepted Date:
24 May 2020
Please cite this article as: Liu, S., Yan, J., He, Q., Cao, J., Ye, M., Barriot, J-P., Precise positioning of Chang’e 3
lander based on Helmert-VCE-aided weighting method using phase delay data from Chinese VLBI Network,
Advances in Space Research (2020), doi:
https://doi.org/10.1016/j.asr.2020.05.034
This is a PDF file of an article that has undergone enhancements after acceptance, such as the addition of a cover
page and metadata, and formatting for readability, but it is not yet the definitive version of record. This version
will undergo additional copyediting, typesetting and review before it is published in its final form, but we are
providing this version to give early visibility of the article. Please note that, during the production process, errors
may be discovered which could affect the content, and all legal disclaimers that apply to the journal pertain.
Precise positioning of Chang’e 3 lander based on
Helmert-VCE-aided weighting method using phase delay data from
Chinese VLBI Network
Shanhong
Liu
a,b,
Jianguo
Yan
a,∗,
Qingbao
He
a,
Jianfeng
Cao
c,
Mao
Ye
aand
Jean-Pierre
Barriot
d,aaState Key Laboratory of Information Engineering in Surveying, Mapping and Remote Sensing, Wuhan University, Luoyu Road 129, 430070
Wuhan, China
bObservatoire de la Côte d’Azur, Geoazur,CNRS UMR7329, Valbonne, France cBeijing Aerospace Flight and Control Center, 100094 Beijing, China
dObservatoire géodésique de Tahiti, BP 6570, 98702 Faa’a, Tahiti, French Polynesia
A R T I C L E I N F O
Keywords: Moon lander VLBI phase delay
Helmert-Variance Component Estima-tion (Helmert-VCE)
LUGREAS Chang’e 3
A B S T R A C T
The precise positioning of a lander is a key issue during in-situ planetary exploration. This pa-per proposes an optimal weighting algorithm based on a Helmert-variance component estima-tion applied to VLBI phase delay data. We validated our algorithm on Chang’e 3 lander VLBI phase delay from the Chinese VLBI Network. We consider that the lander positioning accuracy achieved with our new algorithm is at least 53% better, compared to previous estimations based on the same observations. The position of the lander based on continuous 4-day observations was estimated to be 44.1215◦N (± 21.9 meters), -19.5135◦E (± 4.2 meters) and -2632.7 m (±
18.9 meters) with respect to a moon reference system. This result agrees well with the position derived from images taken by the Narrow Angle Camera on the Lunar Reconnaissance Orbiter.
1. Introduction
The Chinese lunar exploration program has developed for over 10 years beginning with the Chang’e 1, launched in 2007 (Ziyuan et al.,2010;Li et al.,2015;Wei et al.,2018). After the Chang’e 2, most of Chinese moon missions carried landers (Ip et al.,2014;Li et al.,2014,2016b). Determining the lander position accurately is naturally a key requirement, and the related researches have been over half a century.Anderson et al.(1970) firstly used the horizon-to-horizon Doppler tracking data to determine the position of the Mars lander at the 60 km level and concluded that Doppler data were not effective for accurately determining the lander position. In the Apollo 16 and 17 program, the National Aeronautics and Space Administration (NASA) used Very Long Baseline Interferometry (VLBI) technology to determine the position of the Apollo lunar rover with a relative positioning error of approximately 25 m (Salzberg,
1973).Kahn et al.(1992) found that twelve hours of Doppler and either same-beam VLBI or ranging data from a lander and a low circular or circular half-synchronous Mars orbiter made it possible to determine absolute lander position at the tens of meters level of accuracy.Christou(2002) provided a new method that used the shadow of the Martian moon Phobos cast on the surface of Mars to roughly determine the location coordinates of a lander, and the surface accuracy was about 20 km. Methods for lander position determination are continuously being improved, with increases in the types of observation data applied, such as two/three-way range and Doppler, VLBI, and image data.
VLBI is a leading method for angle measurement (Duev et al.,2012), and continues to be routinely used in precise lander positioning and spacecraft navigation. In the positioning of the Chang’e 3 mission lander, the VLBI observations were coupled with range and range-rate observations (Huang et al.,2012). VLBI was also used for spacecraft orbit determination during the SELenological and ENgineering Explorer (SELENE) mission (Kato et al.,2008), using phase delays from the same-beam, named differential VLBI (Kikuchi et al.,2009). The Chang’e 3 mission used the same-beam phase-referencing to obtain horizontal position estimates for the lunar rover with respect to the lander position with a 1-m relative accuracy level (Zhou et al.,2015).
∗Corresponding author
[email protected](S. Liu); [email protected] (J. Yan); [email protected] (Q. He); [email protected] (J. Cao); [email protected](M. Ye); [email protected] (J. Barriot)
To obtain a high-accuracy Chang’e 3 lander positioning firstly is the key element in mission operations and scientific investigations. High-precision coordinates for the Chang’e 3 lander can be used as control points for transforming the coordinates from the local lunar coordinate system to the global coordinate system of moon. Furthermore, a high-precision lander positioning algorithm will have the potential to contribute thehigh-accuracymodel of the rotation and orientation of moon in the futurewith thelong-term radio measurements for landers. The accuracy of positioning of the Chang’e 3 lander determined by the Narrow Angle Camera of the NASA Lunar Reconnaissance Orbiter (LRO) spacecraft was approximately 20 meters (Liu et al.,2015). The estimated positioning differences for the lander based on multiple observables, including one-hour effective time three-way range, VLBI delay measurements, and two-hour VLBI delay rate measurements (13:12-15:12 observing time on 14 December, 2013, UTC), were 50 meters with respect to the results using LRO photographs (Huang et al.,2014;Li et al.,2014).Cao et al.(2016) adoptedunited X-bandand VLBI measurements (one hour on December 14 and two hours on December 17, 2013, UTC), and obtained deviations of less than 100 meters in the three dimensions compared with LRO photograph results. The accuracy of the Chang’e 3 lander positioning based on only VLBI observations (December 20 to 23, 2013, UTC) was up to the hundred-meter level (He et al.,2017). The accuracy from lander/quasars VLBI joint observations (OCEL program,Haas et al.(2016)) was down to ten meters (Klopotek et al.,2019), but observations from multiple antennas in different countries were needed, with all the subsequent organizational complexities.
Common to most of the aforementioned studies is that the fixed weight for same type of observations has been used to positioning the lander of interest. In this paper, we propose adaptive weighting for the processing of VLBI phase delay data, to improve lander positioning accuracy.Löcher and Kusche(2018) reprocessed LRO radiometric tracking data in this way and found that adaptive data weighting allowed the formal error of LRO orbits to be reduced to 2.54 m in the 3D position and 0.13 m in the radial direction, compared to the results obtained with fixed scheme weighting (i.e. 5.35 m in the 3D position and 0.24 m in the radial direction). The adaptive weighting method has been developed for lander positioning according to the Helmert Variance Component Estimation (Helmert-VCE), which is incorporated in our in-house precise orbitography software, LUnar Gravity REcovery and Analysis Software (LUGREAS) (Li et al.,
2016a). The paper is structured as follows: In section 2, we introduce the data, the partial derivative for the lander in the VLBI observation model, and the methodology and the procedure for Helmert-VCE-aided lander positioning. In section 3, the results are presented, compared, and discussed. Conclusions are drawn in section 4.
2. Data, measurement model, and methodology
2.1. Tracking data
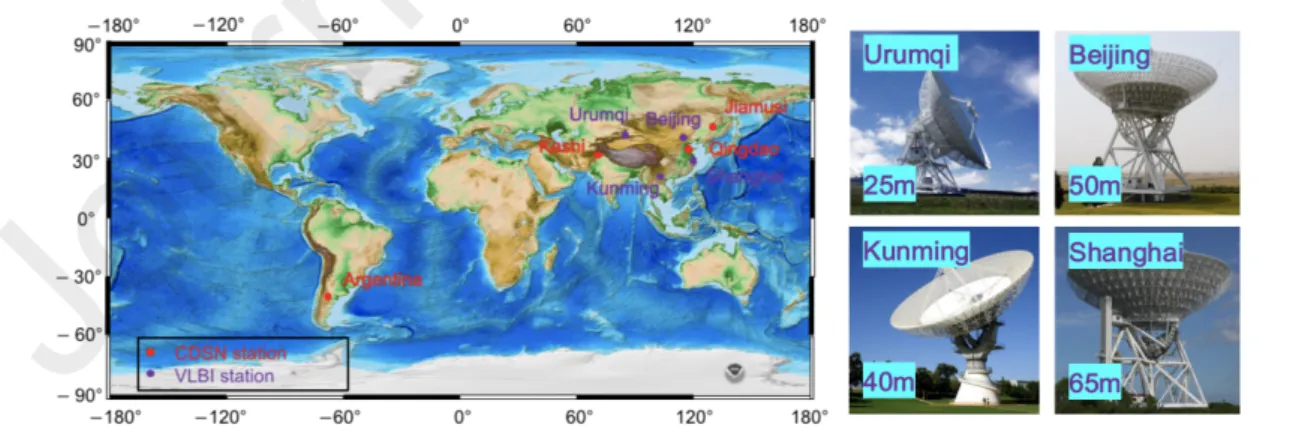
To support lunar and Mars exploration missions, China built a Deep Space Network (CDSN) and Very Long Baseline Interferometry Network (CVN) to provide measurements for spacecrafts or landers (see Figure1). The CVN has been successfully used in the Chinese series of lunar explorations (Huang,2006).
Figure 1: Geographical distribution for Chinese stations of CDSN and CVN. The red spot means Chinese radio track-ing stations and the yellow spot means VLBI stations. Background map: https://www.ngdc.noaa.gov/mgg/global/ global.html
From Figure1, red spots are CDSN stations. The CDSN includes three stations at Kashi (35 m antenna), Jiamusi (66 m antenna) and Qingdao (18 m antenna), in China, and one station in Argentina (35 m antenna). The CVN includes
Lander positioning of Chang’e 3 based on Helmert-VCE-aided weighting method Table 1
Hours of tracking data acquired by the CVN from December 20 to 23, 2013.
Baselines Length(km) HoursTotal time% per day (Hours)Mean length 20 No. of Observations21 22 23
Beijing-Kunming (BK) 2080 39.0 17.43 9.8 7752 7548 7307 6884 Beijing-Urumqi (BU) 2400 35.1 15.69 8.8 7176 6887 6573 6180 Beijing-Shanghai (BS) 1060 39.5 17.65 9.9 7499 7331 7126 6823 Urumqi-Kunming (UK) 2500 35.1 15.69 8.8 7176 6887 6573 6180 Kunming-Shanghai (KS) 1900 40.9 18.27 10.2 7499 7331 7126 6618 Urumqi-Shanghai (US) 3200 34.2 15.28 8.5 6923 6670 6392 6083
Total time network - 223.8 100.00 No. of rejected 1845
Tracking elapsed - 576.0 - No. of weighted 164699
Tracking observed - 38.9% - Available data ratio 98.9%
four VLBI stations, at Shanghai, Beijing, Kunming and Urumqi, marked with purple spots in Figure1(Xu et al.,2016). A new low-noise VLBI station will be built at the Chinese Zhongshan station in Antarctica in the near future (Private communication, Beijing Institute of Tracking and Telecommunications Technology, 2019).
The CDSN tracked the Chang’e 3 for only one hour using X-band three-way measurements after its landing on December 14, 2013, 21:00:00 UTC, with positioning accuracy at the several hundred meter level (Li et al.,2014). For the remaining mission period, CVN tracking was used. After landing, the lander sent continuous signals to the CVN for about 10 hours per day at a center frequency of 8496 MHz and bandwidth of 8 MHz. We refer the reader toHe et al.(2017) for the the phase delay extraction method, and the data correction details are given in AnnexA. In the period examined in this study (December 20 to 23, 2013), the CVN considered six baselines for Chang’e 3 lander observations, for a total of 224 tracking hours (see Table1). About 98.9% of the data acquired was of good quality.
2.2. VLBI delay model
Prior to providing the details of the lander positioning procedure, we briefly summarize the VLBI measurement model and the partial derivative for the lander. Since the lander radio source is on the lunar surface and not at infinity, we have to consider curved wave-front effects. To counteract these effects,Fukushima(1994) proposed an iterative scheme for lunar sources,Klioner(1991) provided an analytical formula valid for solar system sources.Moyer(2005) provided a delay model by computing differences for up and down light-times in the Barycentric Celestial Reference System (BCRS). We adopted the Moyer method for the calculation of light time in LUGREAS.
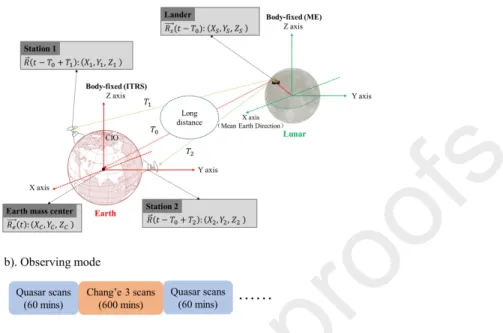
The geometrical VLBI delay model and observing mode are shown in Figure2. The geocentric VLBI delay observations are recorded at the time when the signal arrives at the antennas on the earth, equipped with hydrogen maser clocks. 𝑇0is the propagation time for the signal sent from the lander to arrive at the center of the earth; when
we can assume that there is a virtual station located at the mass center of the earth. The main aim of 𝑇0is to align time
during signal correlation processing (Borkowski,1983). 𝑇1and 𝑇2indicate the propagation times for the signal sent
from the lander to arrive at stations 1 and 2, respectively. The estimation of the propagation time needs an iterative computation, called the geocentric VLBI delay formula, and described by
𝑇0= 1𝑐( ⃗𝑅𝑒(𝑡) − ⃗𝑅(𝑡 − 𝑇0))
𝜏𝑔1= 𝑇1− 𝑇0= 1𝑐( ⃗𝑅𝑒(𝑡 + 𝜏𝑔1) − ⃗𝑅(𝑡 − 𝑇0)) − 𝑇0
𝜏𝑔2= 𝑇2− 𝑇0= 1𝑐( ⃗𝑅𝑒(𝑡 + 𝜏𝑔2) − ⃗𝑅(𝑡 − 𝑇0)) − 𝑇0
(1)
Eq.1express the theoretical values of observations. Further, the baseline-based VLBI delay at stations 1 and 2 can be written as: 𝜏1−2= 𝜏𝑔2− 𝜏𝑔1. The partial derivative for the landercoordinatescan be expressed as:
𝜕𝜏1−2 𝜕 ⃗𝑅𝑠(𝑡 − 𝑇0) = ( 𝑅(𝑡 − 𝑇⃗ 0) − ⃗𝑅𝑒(𝑡 + 𝜏𝑔1) ⃗𝑅(𝑡 − 𝑇0) − ⃗𝑅𝑒(𝑡 + 𝜏𝑔1) − 𝑅(𝑡 − 𝑇⃗ 0) − ⃗𝑅𝑒(𝑡 + 𝜏𝑔2) ⃗𝑅(𝑡 − 𝑇0) − ⃗𝑅𝑒(𝑡 + 𝜏𝑔2) ) (2)
Figure 2: Geocentric VLBI delay model (a) and observing mode (b). (a): The initial lander position is given in the Mean Earth reference system of the moon (ME) and converted to the Barycentric Celestial Reference System (BCRS) (Archinal et al.,2011), marked as(𝑋𝑠, 𝑌𝑠, 𝑍𝑠), and written as ⃗𝑅𝑠(𝑡 − 𝑇0) under universal time. The notations (𝑋1, 𝑌1, 𝑍1)
and(𝑋2, 𝑌2, 𝑍2) in BCRS represent the position of the VLBI stations 1 and 2 when radio waves of the same wave front
are received, expressed as ⃗𝑅(𝑡 − 𝑇0+ 𝑇1) and ⃗𝑅(𝑡 − 𝑇0+ 𝑇2). The (𝑋𝑧, 𝑌𝑧, 𝑍𝑧) in BCRS, written as ⃗𝑅𝑒(𝑡), is the position of
the earth’s center when a signal arrives. (b): The scan sequence is Quasar-Chang’e 3-Quasar. The scan strategy and raw data processing are beyond the scope of this study and were discussed inLiu and Wang(2015);He et al.(2016).
Figure2.(b) depicts the observation mode, Quasar (60 mins)-lander (600 mins)-Quasar(60 mins). The observation mode for the Chang’e 3 lander can be regarded as the geodetic VLBI but is a little bit different from the traditional geodetic observation mode in scans. It should be noted, during the processing of raw data, the effects of troposphere and ionosphere were corrected using GPS real-time data and the details of data processing and detail corrections for the raw VLBI data are given in AnnexA.
2.3. Methodology
The entire procedure for positioning of the Chang’e 3 lander based on the Helmert-VCE-aided weighting method has been partly designed according to the following formulas obtained fromMoyer(1971);Grafarend et al.(1980); Te-unissen and Amiri-Simkooei(2008);Huang et al.(2012);Guo et al.(2016);Löcher and Kusche(2018). By definition, we consider that a lander on the moon surface is fixed with respect to the crust, in order to simplify the traditional or-biter observation function (Moyer,1971;Huang et al.,2012). The linearized equation for observations, which belongs to the Guass-Markov functional model, is:
𝑦 = 𝐻𝑥0+ 𝜀 (3) where 𝑦 = 𝑦1 ... 𝑦6
is the vector of observations, 𝐻 = 𝐻1
... 𝐻6
the sensitivity matrix, and 𝜀 = 𝜀1
... 𝜀6
the noise, supposed to be Gaussian. The local parameter 𝑥0, containing lander position correction to the a priori position of the lander, can
be solved as,
̂𝑥0= (𝐻𝑇𝑃 𝐻)−1𝐻𝑇𝑃 𝑦 (4)
where ̂𝑥0is the adjusted parameter vector. Usually, 𝑃 is defined as a diagonal matrix multiplied by a given
Lander positioning of Chang’e 3 based on Helmert-VCE-aided weighting method Table 2
Configurations of LUGREAS orbitography software for Chang’e 3 lander VLBI tracking data processing.
Item Name Detail information
Corrections Antenna station coordinate and polar tide correction (Solid Earth tides, ocean tidePetit and Luzum,2010)
Speed of light Relativistic effectMoyer(2005)
Configurations TDB-TT translation model Moyer(1981)
Earth rotation model IAU 2006/2000 precession-nutationPolar motion parameters from (IERS) C04Seidelmann et al.1 (2007);
Moon rotation model and Ephemeris From DE421 (Archinal et al.,2011)
Others Cut-off angle 10◦
Weight Optimal weighting
Estimated parameters Lander position
1https://www.obspm.fr/
be replaced by the adjusted weight matrix for observation (Grafarend et al.,1980;Kusche,2003)). Six VLBI baselines can be created with CVN and the measurement accuracy of Chang’e 3 lander is about 1 ns (He et al.,2017), so we could consider six data sets for the sake of baselines difference. It should be noted that with the accuracy improving, the contributions for the weight adjustment, such as elevation-angle, thermal expansion of the antenna, could be computed independently for each VLBI delay observation and for each of the two telescopes forming a baseline.
For the Helmert-VCE-aided least square, at the first calculation, we need to initialize the weight matrix of 𝑃 . For different data sets, 𝑃𝑖(𝑖 represents different observation data set) can be considered as a constant weight.
𝑃1= 𝑃2= 𝑃3= 𝑃4= 𝑃5= 𝑃6 (5)
Then, the posterior residuals of all observation baselines can be calculated as,
𝑣𝑖 = 𝐻1 ... 𝐻6 ̂𝑥0− 𝑦1 ... 𝑦6 (6) According to the simplified method ofMikhail and Ackerman(1976) for the stochastic model, the posterior unit weight variance ( ̂𝜎20
𝑖) can be calculated as,
̂
𝜎20𝑖 = 𝑣 𝑇 𝑖 𝑃𝑖𝑣𝑖
𝑛𝑖− 𝑡𝑟(𝑁−1𝑁𝑖) (7)
where 𝑡𝑟() is the trace operator; 𝑁 = 𝐻1 ... 𝐻6 𝑇 𝑃 𝐻1 ... 𝐻6 and 𝑁𝑖 = 𝐻𝑇 𝑖 𝑃𝑖𝐻𝑖.
Furthermore, the Bartlett test can be applied to examine the statistically equal of the variance components (Bartlett,
1937;Guo et al.,2016) and the details are given in AnnexB.
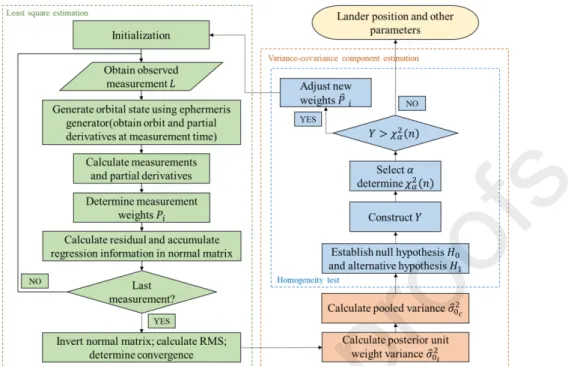
This algorithm is incorporated in the LUGREAS orbitography software. The flowchart of lander positioning is represented in Figure3. The process is split into three parts: the basic data processing in the frame of least squares estimation, variance-covariance component calculation, and homogeneity test. The green dashed line box on the left side of Figure 3 indicates the entire process of data processing, calculation of theoretical observation values, and least squares estimation. Optimal parameters are obtained when the iterations converge after matching with proper convergence criterion. The configuration set-up for our LUGREAS orbitography software in this study is shown in Table2. The priori lander position is selected as 44.1239°N, -19.5106°E, and -2637.6 m.
Figure 3: Flowchart of LUGREAS software with Helmert-VCE procedure in lander positioning. The optimal procedure in the Helmert-VCE process appears in the orange dashed line box; this procedure includes a homogeneity test as shown in the blue dashed line box. 𝑃𝑖 is weight matrix (𝑖 represents different observation baseline). ̂𝜎20𝑖 the posterior unit weight
variance; ̂𝜎2
0𝑐 is pooled variance of the variance components; 𝑌 is a constructed statistic. Annex B gives the detail of
formulas.
3. Results and discussion
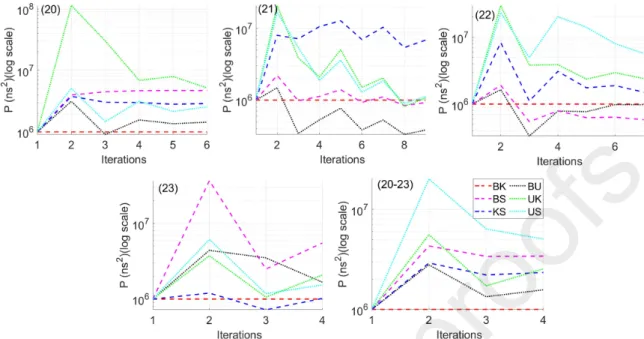
3.1. Weight change in iteration processing
The position of the Chang’e 3 lander is estimated in a moon-fixed reference frame (latitude, longitude, height) with respect to the Mean Earth reference system of the moon, where height is with respect to a reference sphere with a radius of 1737.4 km radius (Archinal et al.,2011). We designed five software runs for position determination, based on the data sets collected on December 20, 21, 22, 23, 2013 and the four dates combined. We first made an estimate of the lander position only using data from December 20, 2013, as an example, to display the weight change in the iterations (Table3). The test statistics were calculated by the formulas in AnnexB.
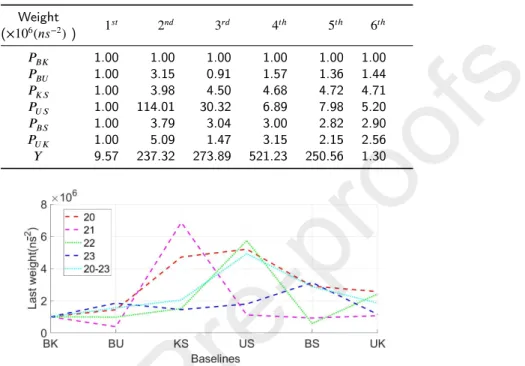
From Table3, in the last iteration, the probability in the homogeneity test was 1.3 and passed. For the other cases, December 21, 22 and 23 of 2013, and December 20-23 combined, the test statistics are not listed, since the processing is the same. The weight values in the last iteration for all cases are plotted in Figure4. There is no discernible pattern in the weighting, or the weight changes case by case.
Weight change for the six baselines are plotted in Figure5. The advantages of our new positioning method with respect to a fixed weight strategy are clearly shown in Figure6. We can see that most statistics values for the six baselines based on the VCE-added lander positioning are closer to zero than the results based on the fixed-weight method. Of note, the measurement precision (considering all error sources in observation) for the respective baselines is about 1 ns (He et al.,2017), and the RMS of the residual in our solution is compatible with the real situation of the stated observation noise.
3.2. Comparison to previous results
We also made a comparison (Table4) with the previous determinations of Chang’e 3’s position using the same VLBI data, which was provided by the Shanghai Astronomical Observatory (SHAO).
Compared with fixed weighting, the improvement in accuracy for optimal weighting is at least 53%. Since the stability of accuracy for the baselines’ observables could not be maintained for all baselines, optimal weighting is more
Lander positioning of Chang’e 3 based on Helmert-VCE-aided weighting method Table 3
Test statistics at each iteration based on the optimal weighting method on December 20, 2013 in lander positioning calculations. Initial weights were set as1 × 106for the first iteration, and the corresponding statistics, 𝑌 , was calculated as
9.57. We could fix the 𝑃𝐵𝐾 weight of the observation equation as constant, while the other weights were adjusted. Then
this iteration was repeated until the corresponding statistics 𝑌 passed the homogeneity test. The significance level 𝛼 was set to 0.1, and the critical value 𝜒2
0.1(5) was 1.610. Weight (×106(𝑛𝑠−2) ) 1𝑠𝑡 2𝑛𝑑 3𝑟𝑑 4𝑡ℎ 5𝑡ℎ 6𝑡ℎ 𝑃𝐵𝐾 1.00 1.00 1.00 1.00 1.00 1.00 𝑃𝐵𝑈 1.00 3.15 0.91 1.57 1.36 1.44 𝑃𝐾𝑆 1.00 3.98 4.50 4.68 4.72 4.71 𝑃𝑈𝑆 1.00 114.01 30.32 6.89 7.98 5.20 𝑃𝐵𝑆 1.00 3.79 3.04 3.00 2.82 2.90 𝑃𝑈𝐾 1.00 5.09 1.47 3.15 2.15 2.56 𝑌 9.57 237.32 273.89 521.23 250.56 1.30
Figure 4: Weight values during the last iteration using the proposed optimal weighting method for all cases of December 20, 21, 22, 23 of 2013, as well as the combined four days.
Table 4
Differences in lander position in Mean Earth reference system of moon. Five sets of results by date, December 20, 21, 22, 23, and December 20-23, 2013, from SHAO and our LURGREAS software are listed. Based on the same type of observations, the difference between the benchmark values and the SHAO’s results (He et al.,2017) are shown on the left side; the difference in results between the benchmark value and our results are shown on the right side. The benchmark position was calculated from the photographs taken by LRO’s Narrow Angle Camera, which was 44.12189°N, 19.51129°W, and the elevation was -2633.0 m, with accuracy around 20 m (Liu et al.,2015).
Fixed weight (Δ1/m) Optimal weight (Δ2/m) Improved rate
Cases ΔLatitude ΔLongitude ΔHeight ΔLatitude ΔLongitude ΔHeight Δ1−Δ2
Δ1 Dec 20 58.0 47.8 257.1 -86.9 18.0 -89.7 52.9% Dec 21 -294.3 147.1 173.9 -33.6 4.6 57.2 82.1% Dec 22 1151.0 -692.0 -1445.2 -15.0 42.6 -23.8 97.4% Dec 23 -541.5 344.5 725.1 -68.5 36.5 -89.5 87.8% Dec 20-23 -312.2 171.3 406.1 -67.2 20.7 70.0 81.6%
useful than fixed weighting in positioning calculations. The differences for baselines in the Chang’e 3 mission mainly stem from different observation accuracies. Summing up, Table4shows that optimal weighting is more reasonable for different observation accuracies of all baselines. The lander position accuracy obtained using the new method is compared with the results obtained using different types of data in Figure7.
The lander positions closest to that from the LRO NAC results were calculated byKlopotek et al.(2019). Their observations were made under the OCEL program, where geodetic VLBI observations were carried out in 2014, 2015,
Figure 5: Weight changes for the six baselines using the optimal weighting scheme for all cases: December 20, 21, 22, 23 of 2013, individually and combined.
Figure 6: Comparison between our optimal weighting scheme (VCE) and a fixed weighting scheme regarding mean and RMS of residuals.
and 2016 during twelve 24-hour sessions using a global network of VLBI telescopes. It is clear that having more baselines is beneficial in terms of observation time, quantity and distribution of stations (Klopotek et al.,2018).
Lander positioning of Chang’e 3 based on Helmert-VCE-aided weighting method
Figure 7: Comparison of the positions of the Chang’e 3 lander with respect to various studies with different data types. The orange dot refers to the position determined by combining fourteen images taken by the Narrow Angle Camera of the LRO (Liu et al.,2015), and the light orange circle indicates the uncertainty. The purple dot depicts the lander position results calculated by the observations from OCEL program, and the light purple circle represents the error ellipse (Klopotek et al.,2019). The blue dot depicts the coordinates obtained using VLBI and UXB measurements (Li et al.,2016b), and the light blue dot indicates the uncertainty. The green circle represents the lander position calculated with only VLBI measurements with fixed-weight, and the light green circle shows the error range (He et al.,2017). The red dot indicates the results from the optimal weighting method in Dec 21 case and combined Dec 20-23 case, and the 1-𝜎 position error ellipses depict the results marked in light red.
4. Conclusions
In this study, we used VLBI phase delay for determining the position of the Chang’e 3 lander using a Helmert-VCE-aided scheme and the VLBI data from the CVN1. The position of the Chang’e 3 lander was determined to be
44.1215◦N, -19.5135◦E and -2632.7 m (with an uncertainty of 18.9 meters) for Dec 20-23, with horizontal position
uncertainties on the lunar surface of about 21.9 and 4.2 m in latitude and longitude, respectively. The improvement in position accuracy with respect to the fixed weight method is 81.6%. For a single-day arc, especially, the improvement in accuracy is at least 53%. This result does fully agree with the expectations since the optimal weighting was intended to make use of the VLBI data with highly accuracy. In addition, our optimal weighting method has the potential to be applied to the determination of parameters related to Love numbers and low degree gravity coefficients in the future, as well as it can be used in processing many types of tracking data.
Acknowledgement
We express our gratitude to Prof.Agnés Fienga for meaningful discussions, which have led to substantial improve-ments of this manuscript. We thank the Mr. Stephen C. McClure, a native English speaker and researcher, and Yiqun Dai, an editor and researcher from Wuhan University for helping polish this paper. The work is supported by the National Natural Science Foundation of China (U1831132, 41874010, 41374024), the Innovation Group of Natural Fund of Hubei Province (2018CFA087) and China Scholarship Council. This work is also supported by the Open Funding of Macau University of Science and Technology (FDCT 119/2017/A3) and the Guizhou Provincial Key Lab-oratory of Radio Astronomy and Data Processing (KF201813). Jean-Pierre Barriot was funded by a DAR grant in planetology from the France Space Agency (CNES). The numerical calculations in this paper have been done on the
supercomputing system in the Supercomputing Center of Wuhan University.
A. Phase delay data processing and corrections
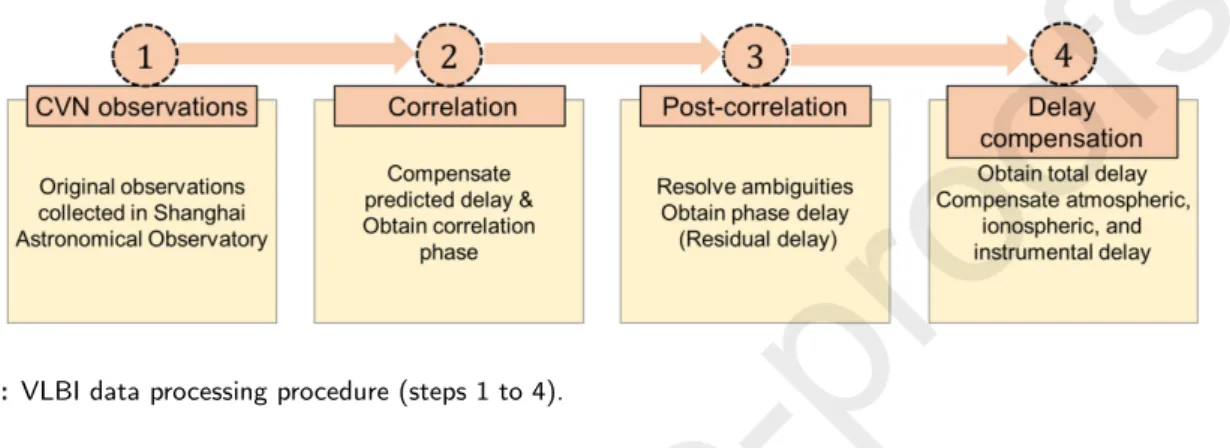
In this study, the VLBI phase delay data was collected at the CVN to estimate the lander position. After the Chang’e 3 landed on the lunar surface, the lander sent continuous signals to the CVN for about 10 hours a day at a center frequency of 8496 MHz and bandwidth of 8 MHz. The phase delay VLBI processing chain consists of four stages including data collection, correlation, post-correlation, and delay compensation. The processing is briefly described in Figures8. The extraction method of phase delay is documented inHe et al.(2017).
Figure 8: VLBI data processing procedure (steps 1 to 4).
Step 1. Data collection. The antennas of CVN located at different places tracks the Chang’e 3 lander at the same time. The raw observation data will be sent to the VLBI center of SHAO to further process. The bandwidth of the ground-receiving channel is about 8 MHz; the frequency point of Fast Fourier Transformation (FFT) is about 4096; the quantization is about 8 bits and the re-quantization is about 2 bits.
Step 2. Correlation. The data need be processed by a correlation treatment. The predicted value of ionospheric delay was refereed from the GPS data, and the ionospheric effect can be removed from the correlation phase of all frequency points in the whole channel. Then, we made the weighted linear fitting on the phases of the whole channel to eliminate the nonlinear effects, which caused by the channel phase-frequency characteristic and the part of ionosphere. Step 3. Post-correlation processing. The method uses phases of two spectral lines spaced in a narrow band (1 MHz) to resolve the phase ambiguities when determining the phase delay resolution as described byHe et al.(2017). We take the phases of the 745th point and 1000th point on the fitted straight line of correlation phases (just 1MHz spaced). Since the lander fixed on the moon without any maneuvering, the phase can be connected directly. Connecting the phases in continuous 10 h, the phases on each baseline have only one ambiguity. Integrating the phases at continuous 10 h, we can solve the ambiguity and obtain the phase delay.
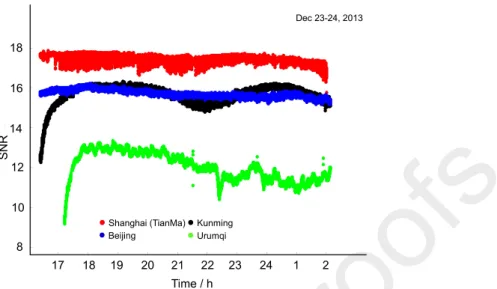
Step 4. Delay compensation. We obtain the total phase delay which contained part of unmoved errors, such as atmospheric, ionospheric, and instrumental (channel delay), and the delay caused by the initial phase of down-conversion local oscillator. For the atmospheric delay and ionospheric delay, contained zenith hydrostatic delay and zenith wet delay, it used the GPS data. This method to reduce the instrumental delay is to observing the radio source in the Chang’e 3 mission. Moreover, the signal-to-noise ratio (SNR) is a key index to judge the thermal noise. The SNR for the observation scan period can be seen in Figures9, the method for SNR calculations can be found inHe et al.(2016).
B. Homogeneity test
The progress of homogeneity test for variances is listed.
Step 1: Establish the null hypothesis and the alternative hypothesis: 𝐻0 ∶ ̂𝜎201 = ̂𝜎202 = ̂𝜎20𝑖... = ̂𝜎206 ;
𝐻𝑎∶ ̂𝜎20𝑖 ≠ ̂𝜎20𝑗 for at least one pair (𝑖, 𝑗).
Lander positioning of Chang’e 3 based on Helmert-VCE-aided weighting method
Figure 9: SNR of data from the lander on December 23, 2013, according to the method of He et al. (2016), for the Shanghai, Kunming, Beijing and Urumqi VLBI antennas. He et al.(2016) concluded that the beginning part of trends for Kunming and Urumqi station are related to the variations of antenna elevation angle and antenna noise temperature. Another possible reason for the trend seen for the Urumqi station is that a high mountain in the south-west direction of Urumqi station, which caused an unstable increase on the antenna system noise temperature.
𝑌 = ∑6 𝑗=10.001(𝑛𝑗−1)𝑙𝑛 ̂ 𝜎20𝑐 ̂ 𝜎20𝑖 1+∑6𝑗=1(𝑛𝑗−1)−1−(𝑛𝑧−6)−1 6
where 𝑛𝑧=∑6𝑗=1𝑛𝑗and the pooled variance ̂𝜎20𝑐 of the six variance components can be calculated as (Snedecor
and Cochran,1989), ̂𝜎20 𝑐 = ∑6 𝑗=1(𝑛𝑗−1) ∑6 𝑗=1𝑛𝑗−6. 𝑌 conforms to the 𝜒 2distribution.
Step 3: Select the appropriate significance level 𝛼. As there are six types of unit weight variances, the degree of freedom has been set as 6 in the 𝜒2distribution. The critical value 𝜒2𝛼(𝑛) is retrieved from the lookup table afterward.
Step 4: Compare 𝑌 and 𝜒2𝛼(𝑛) and determine the final iteration.
𝑓(𝑥) =
𝑌 ≤ 𝜒2𝛼(𝑛) accept 𝐻0, reject 𝐻𝑎
𝑌 > 𝜒2𝛼(𝑛) accept 𝐻𝑎, reject 𝐻0
If 𝐻0is accepted, go to Step 6, otherwise go to Step 5.
Step 5: Adjust the new weights using the following formula and return to iteration procedure (from Equation5):
̂𝑃𝑖 = 𝑐 ̂ 𝜎20𝑖∗𝑃−1
𝑖
(𝑖 = 1...6) where 𝑐 is an arbitrary constant, whose value is chosen to be close to ̂𝜎20
𝑖.
Step 6: The iteration terminates.
C. Robustness of positioning calculation
To testify the robustness from the calculation program, we solved the lander position using an exaggerated initial position (0◦N, 0◦E, and -2637.6 m). Since the VLBI observations has the poor sensitivity in the line of sight direction
(Klopotek et al.,2018,2019), the height direction needs to be constrained to a priori value with 𝜎 = ± 20 m. In Table5, we listed the iteration results. The weights were adjusted at each iteration in our VCE algorithm, and the last iteration weight is 1.00, 1.52, 3.81, 4.10, 1.88, 1.54, 1.44 (units: ×106𝑛𝑠−2) for 𝑃
Table 5
Results of the lander positioning using VLBI phase delay on December 20, 2013.
Corrections Lander solution
Iterations ΔX (m) ΔY (m) ΔZ (m) Latitude (◦) Longitude (◦) Height (m)
1 -490622.3491 -319962.8663 1165821.6745 42.2243 -14.4225 -2682.5 2 -69084.3878 -91662.4078 42155.8677 44.1338 -19.3055 -2620.1 3 -1398.5950 -4274.1756 -104.3472 44.1290 -19.5124 -2630.9 4 -27.5301 -5.3521 24.9068 44.1301 -19.5130 -2663.5 5 9.7558 -20.4105 -16.5072 44.1293 -19.5137 -2646.0
References
Anderson, S., Blackshear, W.T., Tolson, R., 1970. Orbit and position determination for mars orbiters and landers. Journal of Spacecraft and Rockets 7, 1095–1100.
Archinal, B.A., A’Hearn, M.F., Bowell, E., Conrad, A., Consolmagno, G.J., Courtin, R., Fukushima, T., Hestroffer, D., Hilton, J.L., Krasinsky, G.A., et al., 2011. Report of the iau working group on cartographic coordinates and rotational elements: 2009. Celestial Mechanics and Dynamical Astronomy 109, 101–135.
Bartlett, M.S., 1937. Properties of sufficiency and statistical tests. Proceedings of the Royal Society of London. Series A-Mathematical and Physical Sciences 160, 268–282.
Borkowski, K., 1983. Very long baseline interferometry. iii-vlbi data processing. Postepy Astronomii Krakow 31, 255–277.
Cao, J., Zhang, Y., Hu, S., Huang, Y., Chen, M., 2016. An analysis of precise positioning and accuracy of the ce-3 lunar lander soft landing. Geomatics and Information Science of Wuhan University 41, 274–278.
Christou, A.A., 2002. Lander position determination on mars using phobos transits: application to beagle 2. Planetary and Space Science 50, 781–788.
Duev, D.A., Calvés, G.M., Pogrebenko, S.V., Gurvits, L.I., Cimo, G., Bahamon, T.B., 2012. Spacecraft vlbi and doppler tracking: algorithms and implementation. Astronomy & Astrophysics 541, A43.
Fukushima, T., 1994. Lunar vlbi observation model. Astronomy and Astrophysics 291, 320–323.
Grafarend, E., Kleusberg, A., Schaffrin, B., 1980. An introduction to the variance-covariance component estimation of helmert type. Zeitschrift für Vermessungswesen 105, 161–180.
Guo, J., Yang, F., Shi, J., Xu, C., 2016. An optimal weighting method of global positioning system (gps) troposphere tomography. IEEE Journal of Selected Topics in Applied Earth Observations and Remote Sensing 9, 5880–5887.
Haas, R., Halsig, S., Han, S., Iddink, A., Jaron, F., La Porta, L., Lovell, J., Neidhardt, A., Nothnagel, A., Plötz, C., et al., 2016. Observing the chang’e-3 lander with vlbi (ocel), in: First International Workshop on VLBI Observations of Near-field Targets, p. 41.
He, Q., Liu, Q., Li, P., Kawaguchi, N., Wu, Y., Zheng, X., Zhang, J., Xu, Z., 2016. Snr periodical variation of chang’e-3 spacecraft orbiting the moon. Chinese Journal of Aeronautics 29, 470–478.
He, Q.b., Liu, Q.h., Chang, S.q., Zheng, X., 2017. A new try of connecting phase and solving phase delay in vlbi. Chinese Astronomy and Astrophysics 41, 614–625.
Huang, Y., 2006. A study on the orbit determination of the chang’e-1 lunar probe. Doctorial Dissertation. Shanghai: Shanghai Astronomical Observatory, Chinese Academy of Sciences .
Huang, Y., Chang, S., Li, P., Hu, X., Wang, G., Liu, Q., Zheng, W., Fan, M., 2014. Orbit determination of chang’e-3 and positioning of the lander and the rover. Chinese science bulletin 59, 3858–3867.
Huang, Y., Hu, X., Li, P., Cao, J., Jiang, D., Zheng, W., Fan, M., 2012. Precise positioning of the chang’e-3 lunar lander using a kinematic statistical method. Chinese Science Bulletin 57, 4545–4551.
Ip, W.H., Yan, J., Li, C.L., Ouyang, Z.Y., 2014. Preface: The chang’e-3 lander and rover mission to the moon. Research in Astronomy and Astrophysics 14, 1511.
Kahn, R.D., Folkner, W.M., Edwards, C.D., Vijayaraghavan, A., 1992. Position determination of spacecraft at mars using earth-based differential tracking, in: Astrodynamics 1991, pp. 1545–1562.
Kato, M., Sasaki, S., Tanaka, K., Iijima, Y., Takizawa, Y., 2008. The japanese lunar mission selene: Science goals and present status. Advances in Space Research 42, 294–300.
Kikuchi, F., Liu, Q., Hanada, H., Kawano, N., Matsumoto, K., Iwata, T., Goossens, S., Asari, K., Ishihara, Y., Tsuruta, S.i., et al., 2009. Picosecond accuracy vlbi of the two subsatellites of selene (kaguya) using multifrequency and same beam methods. Radio Science 44.
Klioner, S.A., 1991. General relativistic model of vlbi observables, in: Proc. AGU Chapman Conf. on Geodetic VLBI: Monitoring Global Change, Carter, WE (ed.), NOAA Technical Report, pp. 188–202.
Klopotek, G., Hobiger, T., Haas, R., 2018. Geodetic vlbi with an artificial radio source on the moon: a simulation study. Journal of Geodesy 92, 457–469.
Klopotek, G., Hobiger, T., Haas, R., Jaron, F., La Porta, L., Nothnagel, A., Zhang, Z., Han, S., Neidhardt, A., Plötz, C., 2019. Position determination of the chang’e 3 lander with geodetic vlbi. Earth, Planets and Space 71, 23.
Kusche, J., 2003. Noise variance estimation and optimal weight determination for goce gravity recovery. Advances in Geosciences 1, 81–85. Li, C., Liu, J., Ren, X., Zuo, W., Tan, X., Wen, W., Li, H., Mu, L., Su, Y., Zhang, H., et al., 2015. The chang’e 3 mission overview. Space Science
Lander positioning of Chang’e 3 based on Helmert-VCE-aided weighting method
Li, C.L., Mu, L.L., Zou, X.D., Liu, J.J., Ren, X., Zeng, 2014. Analysis of the geomorphology surrounding the chang’e-3 landing site. Research in Astronomy and Astrophysics 14, 1514.
Li, F., Ye, M., Yan, J., Hao, W., Barriot, J.P., 2016a. A simulation of the four-way lunar lander–orbiter tracking mode for the chang’e-5 mission. Advances in Space Research 57, 2376–2384.
Li, P., Huang, Y., Hu, X., Shengqi, C., 2016b. Positioning for the chang’e-3 lander and rover using earth-based observations, in: AGU Fall Meeting Abstracts.
Liu, B., Di, K., Wang, B., Tang, G., Xu, B., Zhang, L., Liu, Z., 2015. Positioning and precision validation of chang’e-3 lander based on multiple lro nac images. Chinese Science Bulletin 60, 2750–2757.
Liu, J., Wang, G., 2015. The statistics and analysis of vlbi data in real-time during the mission of chang’e-3. Annals of Shanghai Astronomical Observatory , 15.
Löcher, A., Kusche, J., 2018. Precise orbits of the lunar reconnaissance orbiter from radiometric tracking data. Journal of Geodesy 92, 989–1001. Mikhail, E., Ackerman, F., 1976. Observation and least squares (new york: A dun donelly) .
Milani, A., Gronchi, G., 2010. Theory of orbit determination. Cambridge University Press.
Moyer, T.D., 1971. Mathematical formulation of the double precision orbit determination program/dpodp .
Moyer, T.D., 1981. Transformation from proper time on earth to coordinate time in solar system barycentric space-time frame of reference. Celestial Mechanics 23, 33–56.
Moyer, T.D., 2005. Formulation for observed and computed values of Deep Space Network data types for navigation. volume 3. John Wiley & Sons.
Petit, G., Luzum, B., 2010. IERS conventions (2010). Technical Report. BUREAU INTERNATIONAL DES POIDS ET MESURES SEVRES (FRANCE).
Salzberg, I., 1973. Tracking the apollo lunar rover with interferometry techniques. Proceedings of the IEEE 61, 1233–1236.
Seidelmann, P.K., Archinal, B.A., A’hearn, M.F., Conrad, A., Consolmagno, G., Hestroffer, D., Hilton, J., Krasinsky, G., Neumann, G., Oberst, J., et al., 2007. Report of the iau/iag working group on cartographic coordinates and rotational elements: 2006. Celestial Mechanics and Dynamical Astronomy 98, 155–180.
Snedecor, G., Cochran, W., 1989. Statistical methods, eight ed.
Teunissen, P.J., Amiri-Simkooei, A., 2008. Least-squares variance component estimation. Journal of geodesy 82, 65–82. Wei, Y., Yao, Z., Wan, W., 2018. China’s roadmap for planetary exploration. Nature Astronomy 2, 346.
Xu, D.z., Dong, G.l., Wang, G.l., Li, H.t., Jiang, W., 2016. First geodetic vlbi sessions with the chinese deep space stations jiamusi and kashi. Advances in Space Research 58, 1638–1647.
Zhou, H., Li, H., Dong, G., 2015. Relative position determination between chang’e-3 lander and rover using in-beam phase referencing. Science China Information Sciences 58, 1–10.
Ziyuan, O., Chunlai, L., Yongliao, Z., Hongbo, Z., Chang, L., Jianzhong, L., Jianjun, L., Wei, Z., Yan, S., Weibin, W., et al., 2010. Chang’e-1 lunar mission: An overview and primary science results. Chinese Journal of Space Science 30, 392–403.