HAL Id: hal-03028492
https://hal.archives-ouvertes.fr/hal-03028492
Submitted on 27 Nov 2020
HAL is a multi-disciplinary open access
archive for the deposit and dissemination of
sci-entific research documents, whether they are
pub-lished or not. The documents may come from
teaching and research institutions in France or
abroad, or from public or private research centers.
L’archive ouverte pluridisciplinaire HAL, est
destinée au dépôt et à la diffusion de documents
scientifiques de niveau recherche, publiés ou non,
émanant des établissements d’enseignement et de
recherche français ou étrangers, des laboratoires
publics ou privés.
Changes in Phase Behavior from the Substitution of
Ethylene Oxide with Carbon Dioxide in the Head Group
of Nonionic Surfactants
Vivian Spiering, Aurora Ciapetti, Michelle Lima, Dominic Hayward, Laurence
Noirez, Marie-sousai Appavou, Reinhard Schomäcker, Michael Gradzielski
To cite this version:
Vivian Spiering, Aurora Ciapetti, Michelle Lima, Dominic Hayward, Laurence Noirez, et al.. Changes
in Phase Behavior from the Substitution of Ethylene Oxide with Carbon Dioxide in the Head
Group of Nonionic Surfactants. ChemSusChem, ChemPubSoc Europe/Wiley, 2020, 13, pp.601
-607. �10.1002/cssc.201902855�. �hal-03028492�
Changes in Phase Behavior from the Substitution of
Ethylene Oxide with Carbon Dioxide in the Head Group of
Nonionic Surfactants
Vivian J. Spiering,*
[a]Aurora Ciapetti,
[a]Michelle Tupinamba Lima,
[b]Dominic W. Hayward,
[a]Laurence Noirez,
[c]Marie-Sousai Appavou,
[d]Reinhard Schom-cker,
[b]and
Michael Gradzielski*
[a]Introduction
Nonionic surfactants with ethylene oxide [EO; or ethylene glycol (EG)] head groups are the workhorse surfactants in the field of detergency and many other applications of surfac-tants.[1,2]For example, in the European Union, more than 1
mil-lion tons are produced per year.[3]EO is a petrochemical
prod-uct, and for such a large-scale product it is interesting to sub-stitute it by biorenewable resources. One option that has been explored so far in that direction is the use of glycerol for the head group,[4] and with such surfactants also nanoemulsions
can be formed.[5]However, in the field of detergency they have
not been able to substitute conventional nonionic surfactants, and here researchers are still searching for a more sustainable chemical solution.
In our experiments, we studied nonionic surfactants that were modified in terms of their head group, containing differ-ent numbers of CO2 moieties that partly substitute the EO
units. The use of CO2 as a resource in organic chemistry and
also, in particular, its copolymerization with epoxides is a topic of high current interest. The process itself has been known for over 40 years but has seen substantial catalytic improvements in recent years.[6–9] Application of such synthetic schemes, for
instance, led to the formation of nanostructures from CO2
-based polycarbonates[10] or functional copolymers based on
CO2and glycidyl ethers.[11]
In our case, CO2-modified surfactants were obtained by a
double metal cyanide (DMC)-catalyzed copolymerization of a mixture of EO and CO2with a monofunctional alkanol as
start-ing unit[12,13] (here: dodecanol). By doing so and varying the
relative amount of CO2, nonionic surfactants with different CO2
content in their head group are accessible (Figure 1), which apart from this are identical with respect to their hydrophobic group and the length of their hydrophilic head (see Table S1 in the Supporting Information). Such surfactants are of high inter-Nonionic ethylene oxide (EO)-based surfactants are widely
em-ployed in commercial applications and normally form gel-like liquid crystalline phases at higher concentrations, rendering their handling under such conditions difficult. By incorporating CO2units in their hydrophilic head groups, the consumption of
the petrochemical EO was reduced, and the tendency to form liquid crystals was suppressed completely. This surprising be-havior was characterized by rheology and studied with respect to its structural origin by means of small-angle neutron scatter-ing (SANS). These experiments showed a strongly reduced
re-pulsive interaction between the micellar aggregates, attributed to a reduced hydration and enhanced interpenetration of the head groups owing to the presence of the CO2units. In
addi-tion, with increasing CO2content the surfactants became more
efficient and effective with respect to their surface activity. These findings are important because the renewable resource CO2is used, and the CO2-containing surfactants allow handling
at very high concentrations, an aspect of enormous practical importance.
[a] V. J. Spiering, A. Ciapetti, Dr. D. W. Hayward, Prof. Dr. M. Gradzielski Stranski-Laboratorium fer Physikalische und Theoretische Chemie Institut fer Chemie
Technische Universit-t Berlin
Straße des 17. Juni 124, 10623 Berlin (Germany) E-mail: v.spiering@tu-berlin.de
michael.gradzielski@tu-berlin.de [b] M. T. Lima, Prof. Dr. R. Schom-cker
Institut fer Chemie—Technische Chemie Technische Universit-t Berlin
Straße des 17. Juni 124, 10623 Berlin (Germany) [c] Dr. L. Noirez
Laboratoire L8on Brillouin (CEA-CNRS) C.E.-Saclay, 91191 Gif sur Yvette Cedex (France) [d] Dr. M.-S. Appavou
Forschungszentrum Jelich GmbH
Jelich Centre for Neutron Science (JCNS) at Heinz Maier-Leibnitz Zentrum (MLZ)
Lichtenbergerstr. 1, 85747 Garching (Germany)
Supporting Information and the ORCID identification number(s) for the author(s) of this article can be found under:
https://doi.org/10.1002/cssc.201902855.
T 2019 The Authors. Published by Wiley-VCH Verlag GmbH & Co. KGaA. This is an open access article under the terms of the Creative Commons Attribution Non-Commercial NoDerivs License, which permits use and distribution in any medium, provided the original work is properly cited, the use is non-commercial, and no modifications or adaptations are made.
est because of the substitution of the petrochemical EO unit by CO2as a cheap and environmentally benign resource. In
ad-dition, the CO2 units are diesters, which typically can be
de-graded more easily (a point of ecological importance).
Owing to their high importance, the properties of nonionic surfactants have been studied in detail. Key features are their self-assembly behavior in aqueous solution, which shows a marked temperature dependence, and at higher concentra-tions, they form liquid crystalline (LC) phases.[1,14]The type and
location of these LC phases in the phase diagram depends in a systematic fashion on the molecular architecture of the non-ionic EO surfactants.[14,15]Typically, hexagonal and cubic phases
are formed, which exhibit marked gel-like properties (with shear moduli G0in the range of 104–106Pa).[16,17]This behavior
is often problematic because for many formulations the forma-tion of highly viscous phases during the preparaforma-tion process is a major nuisance and therefore has to be avoided or circum-vented. This often means one has to work in application/for-mulation with accordingly diluted surfactants from the very beginning, which leads to substantially higher logistic costs and volumes, thereby having a negative ecological impact.
In our work, we were now interested in how CO2-containing
surfactants compare to their conventional nonionic counter-parts. Accordingly, we studied a series of dodecyl surfactants in which the amount of contained CO2 units was systematically
varied [i.e., C12(CO2)xEOn with x in the range of 0–3.1 and n=
8.2–14.0; see Figure 1 and Table S1 in the Supporting Informa-tion]. Here it should be noted that the distribution of the CO2
in the head group is statistical (see Figure S1 in the Supporting Information). The synthesis and basic properties have been de-scribed before,[13]including their hydrophilic–lipophilic balance
and behavior in the formation of emulsions, which showed a similar property spectrum as their conventional analogues.[18]
Results and Discussion
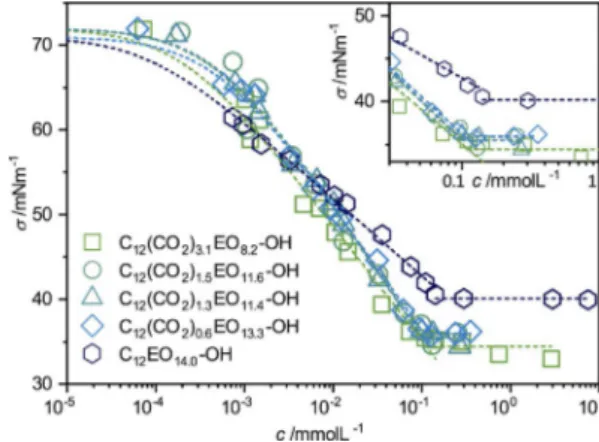
Phase behavior and surface activityA key property in the characterization of new surfactants is their surface activity, and it allows to determine the critical mi-celle concentration (cmc). The surface tension data of all four CO2-containing surfactants look quite similar (Figure 2), with a
cmc value of 0.053 mmol L@1 for the surfactant with the
high-est CO2 content [C12(CO2)3.1EO8.2-OH] and 0.175 mmolL@1 for
the surfactant without CO2(C12EO14.0-OH). Surface tension
mea-surement data for the individual surfactants are shown in Fig-ure S2 in the Supporting Information. From this change in cmc values, one may conclude that the surfactants become more
hydrophobic with increasing CO2content (Figure S3,left in the
Supporting Information). The obtained values are lower com-pared with other nonionic C12surfactants at 258C, such as
n-dodecyl-b-d-glucoside with 0.19 mmol L@1 [19]or C
12EO5-OH with
0.064 mmol L@1,[20]thereby indicating a higher extent of
hydro-phobicity. The cmc, the head group areas (a0), and the Gibbs
free energy of micellization (DGmic) of the different surfactants
are summarized in Table 1. The surface tension of the CO2
sur-factants at 258C at the cmc was found to be between 34.4 and up to 35.9 mN m@1. This is in the expected range for C
12EOj
nonionic surfactants,[21–23]but it is interesting to note that
sur-face tension becomes lower with increasing CO2content, that
is, the surfactants become more effective.
Furthermore, it was observed that the head group area de-creases with increasing CO2content (Figure S3 in the
Support-ing Information). This decrease can be explained by an en-hanced hydrophobicity and a decreased hydration. DGmicwas
found to be linearly proportional to the CO2content.
Perform-ing a linear regression fit to the gradient (Figure S3, right in the Supporting Information) reveals a transfer energy of (@0.37 : 0.06) kT per CO2 unit, independent of temperature. This value
is substantially smaller than the transfer energy of a CH2group
in a hydrophobic chain (& @1.2 kT), but nonetheless large enough to significantly influence the micellization process. It was previously found that the introduction of hydrophobic propylene oxide (PO) units into the hydrophilic chain of C12EO8
Figure 1. General structural formula of the CO2-containing nonionic dodecyl
surfactants investigated in this work; in particular we studied: C12EO14.0-OH,
C12(CO2)0.6EO13.3-OH, C12(CO2)1.3EO11.4-OH, C12(CO2)1.5EO11.6-OH, and
C12(CO2)3.1EO8.2-OH.
Figure 2. Surface tension s as a function of concentration for
C12EO8.2(CO2)3.1OH, C12EO11.6(CO2)1.5-OH, C12EO14(CO2)1.3-OH, C12EO13.3(CO2)0.6
-OH, and the reference sample C12EO14.0-OH at 258C.
Table 1. Summary of the surface tension measurements.[a]
Surfactant cmc
[mmolL@1] s[mnmCMC @1] [nma0 2] DG[kJmolmic @1]
C12(CO2)3.1EO8.2-OH 0.053 34.4 0.55 @34.3
C12(CO2)1.5EO11.6-OH 0.091 35.9 0.65 @33.0
C12(CO2)1.3EO11.4-OH 0.099 35.5 0.67 @32.8
C12(CO2)0.6EO13.3-OH 0.118 35.9 0.69 @32.4
C12EO14.0-OH 0.175 40.1 1.07 @31.4
[a] Critical micelle concentration (cmc), surface tension at the cmc (sCMC),
head group area (a0), and Gibbs free energy of micellization (DGmic).
ChemSusChem 2020, 13, 601 – 607 www.chemsuschem.org 602 T 2019The Authors. Published by Wiley-VCH Verlag GmbH & Co. KGaA, Weinheim
surfactants gives rise to a transfer energy of @0.25 kT/PO unit at 258C.[24]The effect of adding PO and CO
2units is therefore
similar, in both cases facilitating the formation of micelles, but more pronounced for the case of CO2 incorporation. For a
comparison, the transfer energy per EO unit is +0.16 kT,[25]and
thus the EO unit is causing a small contribution disfavoring mi-cellization.
In summary, the CO2-containing surfactants are having a
lower cmc, which means for many applications that one can reduce the required amount, and they also show lower surface tension values above the cmc, as typically wished for a surfac-tant. Accordingly, substitution of EO by CO2in the head group
leads to more efficient and effective nonionic surfactants.
Rheological behavior
Most interesting is the behavior at high concentrations as for conventional nonionic surfactants of this type (e.g., C12EO8[14]
or C12EO12[26]) one observes with increasing concentration
above approximately 25–30 wt% first a cubic phase and at still higher concentration a hexagonal phase is formed, both of which are highly viscous and gel-like in appearance. In con-trast, the CO2-containing nonionic surfactants show a very
dif-ferent phase behavior depicted in Figure 3. For surfactants containing more than one CO2 unit per molecule in their
hy-drophilic head group, LC phases are no longer formed. The as-signment of the different LC phases was done based on polari-zation microscopy (the cubic phase is isotropic, whereas the hexagonal phase shows typical fan-like birefringence textures, see Figure S4 in the Supporting Information) and was corrobo-rated by the small-angle neutron scattering (SANS) results (see Figure S5 in the Supporting Information).
The absence of the LC phases for higher CO2 content is not
only interesting for fundamental soft matter science but is also largely altering the flow behavior of such systems, and thereby the way they can be handled in terms of application. The CO2
-containing surfactants with more than one CO2unit per
mole-cule are always rather low-viscosity Newtonian fluids (h< 1 Pas), whereas conventional nonionic surfactants form
highly viscous gels with a yield stress. This effect of largely changed flow behavior is quantified by the viscosity curves shown in Figure 4a, which directly compare the surfactant without CO2 and the one containing 3.1 CO2 units
[C12(CO2)3.1EO8.2-OH] at different concentrations. The latter is in
the concentration range from 45 to 65 wt% always a Newtoni-an liquid with a viscosity of approximately 0.4–0.8 Pas, where-as for the equivalent conventional surfactant without CO2a 4–
6 orders of magnitude higher viscosity (no finite zero-shear vis-cosity is seen, corresponding to having a yield stress) and a re-duction with increasing frequency (corresponding to shear thinning) is observed. The storage modulus G’ as a function of frequency obtained from oscillatory rheological measurements for the different surfactants at a given concentration of 65 wt% (Figure 4b) shows for C12EO14.0-OH constant values of
approximately 2V104Pas (rather stiff gel; these values depend
somewhat on the concentration as shown in Figure S6a in the Supporting Information), which quantifies the gel-like proper-ties of these samples. Already for the surfactant with an aver-age of 0.6 CO2units per molecule, the value is reduced by two
Figure 3. Phase diagram at 258C as a function of the surfactant concentra-tion and the number of CO2units contained in the hydrophilic head group
(with isotropic L1-phase, cubic phase, and hexagonal phase).
Figure 4. Rheological parameters for different surfactant samples in the high-concentration regime of 45–65 wt% obtained at 258C from oscillation measurements at a shear stress of 0.5 Pa. (a) Magnitude of the complex vis-cosity jh*j as a function of angular frequency for the CO2-richest surfactant
(x=3.1) and the reference sample without CO2(x =0); (b) Storage modulus
G’ as a function of angular frequency for the different surfactants at constant concentration of 65 wt% (measurement system: cone-plate stainless-steel geometry radius: 40 mm, gap size 150 mm).
orders of magnitude. It is still rather constant, thereby confirm-ing the gel properties, but as a much softer gel. In contrast, for the surfactants containing more than one CO2 group the
values are smaller by four to six orders of magnitude. Actually, the values given in Figure 4b for the samples with x>1 are not really meaningful because the viscous component of the complex shear modulus G* is largely dominating, as shown in
Figure S6b in the Supporting Information.
Small-angle neutron scattering
Apparently, the flow and phase behavior of the concentrated nonionic surfactant solutions are largely changed by the incor-poration of the CO2 moieties into their head groups. To
eluci-date this interesting phenomenon further, we studied in detail the structure of the self-assembled aggregates formed here and their structural ordering. This was done by SANS experi-ments, which confirm that at a higher concentration no LC or-dering is present, and especially no cubic phases are observed, which typically show pronounced gel-like behavior.[27] Often
cubic phases are manifested in the scattering patterns by spikes on the isotropic correlation peak,[27–31] as seen for
C12EO14.0-OH and C12(CO2)0.6EO13.3-OH (shown in Figure 5a for
samples with 50 wt%; for the scattering patterns at other con-centrations see Figure S7 in the Supporting Information). In
contrast, the samples with higher CO2 content show isotropic
scattering rings. When looking more closely at the radially averaged correlation peak at a given concentration of 50 wt% (Figure 5b), one notices that the peaks become increasingly wider and less sharp with increasing CO2 content. This
indi-cates a much lower degree of ordering, which generally could be attributed to less pronounced repulsive interactions be-tween the micelles. At the same time, the peak position moves somewhat towards smaller q values, which indicates a small micellar growth with increasing CO2 content in the head
group.
SANS measurements at a lower concentration of 1 wt% showed similar scattering curves (Figure S8 in the Supporting Information) that prove that globular micelles of similar size (radius of gyration of 2.4–2.7 nm, Table S3 in the Supporting In-formation) are always formed, irrespective of the CO2content
of the surfactant. A quantitative analysis of the SANS data shows that there is some increase in size with increasing con-tent of CO2(Table S3 in the Supporting Information), in
agree-ment with the shift of the correlation peak at higher concen-tration. For spherical micelles, this corresponds to a reduction of the head group area (a0) from 0.85 nm2 for the pure EO
sur-factant to 0.62 nm2 for C
12(CO2)3.1EO8.2-OH (Table S3 in the
Sup-porting Information). These values are in good agreement with the data from surface tension measurements (Table 1). A ra-tional explanation of this observation would be that with in-creasing CO2 content a0 is reduced because of a lower extent
of hydration. SANS measurements over a large concentration range up to 65 wt% (see Figure S9 in the Supporting Informa-tion) show that the size of the micelles is only slightly affected by the change of concentration (i.e., one has similar aggre-gates present), but in the case without or with little CO2in the
head group leading to LC stiff phases, whereas for more than one CO2unit in the head groups the fluid state was retained
up to highest concentrations. Apparently, the interaction and the extent of ordering at high concentration change largely upon the incorporation of CO2into the head groups. To
quan-tify the effective interaction between the micelles as a function of the CO2content of the different surfactants, we further
ana-lyzed the scattering data in the thermodynamic limit (i.e., q! 0). The determined I(0)expvalues as a function of the volume
fraction f (here considering the “dry” volume fraction f result-ing from the surfactant only) are given in Figure 6 and show the expected passing through a maximum at a given f. This can be explained such that the intensity first increases linearly with the number of dispersed particles, but with increasing concentration, they become increasingly ordered (thereby sup-pressing fluctuations responsible for the scattering). This effect is quantitatively described by the structure factor S(0), which then leads to a reduction in scattering intensity. To describe the experimentally observed scattering behavior, we employed the hard-sphere model according to Carnahan–Starling[32]
[Eq. (1)]:
S 0ð Þ@1¼ð1 þ 2@hsÞ2@4@3hsþ 4@4hs
1 @ @hs
ð Þ4 ð1Þ
Figure 5. (a) Comparison of 2D scattering patterns of the nonionic surfac-tants with different CO2content in their head groups for a constant
concen-tration of 50 wt%. (b) Radially averaged intensity curves for the same data (indicating the markedly sharper peaks of the gels). The curves are scaled on the y-axis by the following multiplicators: (CO2)3.1·1; (CO2)1.5·4; (CO2)1.3·12;
(CO2)0.6·64; (CO2)0·240.
ChemSusChem 2020, 13, 601 – 607 www.chemsuschem.org 604 T 2019The Authors. Published by Wiley-VCH Verlag GmbH & Co. KGaA, Weinheim
in which fhsis the solvated volume fraction effective
responsi-bility for the hard-sphere interaction, and fhs=Bf(1@Af), in
which B quantifies the extent of hydration of the aggregates (i.e., the amount of water strongly bound to the head group) that has to be considered when describing the micelles as hard spheres. A is accounting for the effect of “softness”, which means the extent to which aggregates can interpene-trate at higher concentration, thereby effectively reducing the volume fraction of the system. On this basis, one can calculate directly the observed intensity I(0) according to Equation (2): Ið0Þ ¼ @ ? DðSLDÞ2? V ? Sð0Þ ð2Þ
which is the monodisperse approximation, in which D(SLD) is the difference of the scattering length densities of (dry) mi-celles and D2O, and V the volume of the dry aggregates.
Looking in detail at the experimental data shown in Figure 6 one observes a marked increase in intensity with increasing CO2content and at the same time, the relative reduction of
in-tensity beyond the maximum becomes much less pronounced. The higher intensity arises from larger aggregates with increas-ing CO2 content, as already seen from the SANS curves taken
at 1 wt% (Figure S8 and Table S3 in the Supporting Informa-tion). Describing these data with Equations (1) and
(2) shows that with increasing CO2 content there is
less hydration of the head groups (smaller B) and therefore a lower effective volume fraction (data summarized in Table 2). The hydration number H of water molecules per surfactant molecule is such that for each EO group one has approximately two water molecules, whereas one can assign nominally zero water molecules per CO2 group. More importantly,
the aggregates become much softer, as evidenced by the substantial increase of A, which means that at higher concentration the effective volume fraction of the aggregates does not increase much. This in-crease at high concentration is seen even more
clear-ly in Figure S10 in the Supporting Information, in which we normalized the data with respect to the maximum of I(0) and the volume fraction fmax at which the maximum is located.
This means that the CO2-containing micelles are much more
in-terpenetrating (see Figure 7), and thereby much less repulsive and unable to form ordered (LC) phases.
Accordingly, similar micelles are present, but the incorpora-tion of the CO2 moieties into the hydrophilic head groups
leads to a substantial alteration of the interaction potential and renders them much softer. This apparently arises firstly from the lower extent of hydration of the head groups and secondly from attractive interactions owing to the presence of CO2 units that allow for interpenetration of the hydrophilic
corona of the surfactants (see Figure 7) Polyethylene oxide (PEO) is known to be strongly hydrated,[33,34]but this tendency
is reduced by the presence of CO2 units. Such a reduction of
the hydration is concomitant to a reduced a0, which in turn
ex-plains the formation of larger aggregates based on simple ge-ometry (as the radius of a spherical micelle should be given as R= 3vh/ah, with vh being the molecular volume of the
hydro-phobic part of the surfactant). In addition, it appears that CO2
units of neighboring micellar head group coronas are less re-pulsively interacting with each other, presumably because of their strong dipole moment coupled with the high polarizabili-ty of the CO2group. In summary, the interaction potential
be-tween the nonionic micelles becomes much less repulsive, and such “soft spheres” then accordingly do not form highly or-dered LC phases with their corresponding gel-like properties (Figure 7).
Figure 6. I(0)expfor all CO2surfactants from SANS data depending on the dry
volume fraction f. Lines are I(0)thconsidering the static structure factor S(0),
which was calculated from the volume fraction fhsof the swollen
aggre-gates with a certain amount of water (described by B) and the softness pa-rameter A that describes the extent of interpenetration of the aggregates [Eq. (1)].
Table 2. Parameters from the fits shown in Figure 5 for I(0)expfrom SANS
data for volume fractions up to 0.35.[a]
Surfactant A B H Mw [kDa] Nagg a[nm0 2] C12(CO2)3.1EO8.2-OH 0.55 1.51 17.2 55.4 80.5 0.62 C12(CO2)1.5EO11.5-OH 0.52 1.58 19.7 35.4 46.4 0.74 C12(CO2)1.3EO11.4-OH 0.50 1.63 23.2 29.6 39.8 0.86 C12(CO2)0.6EO13.3-OH 0.37 1.64 25.2 22.8 28.7 0.94 C12EO14.0-OH 0.01 1.72 28.8 30.9 38.5 0.85
[a] A, B, hydration number H (molecules of water per surfactant mole-cule), molecular weight Mw, aggregatation number Nagg, and head group
area a0.
Figure 7. Illustration of the packing conditions prevailing in the case of nonionic surfac-tants without and with incorporated CO2units in the head group. A higher CO2content
reduces hydration, reducing the repulsive interactions, and thereby allows for interpene-tration of the hydrophilic micelles shells.
Conclusions
In this work, we studied the effect of replacing petrol-based ethylene oxide (EO) in the head groups of nonionic surfactants by the renewable resource CO2. The presence of CO2 in the
head group reduces the critical micellar concentration (cmc) and the surface tension above the cmc (i.e., the surfactants become more efficient and effective). Most interestingly, our study shows that the phase behavior of nonionic surfactants is fundamentally altered by substituting CO2 moieties into the
hydrophilic EO-based head groups. Already the incorporation of one CO2 group per molecule suppresses the formation of
gel-like liquid crystalline phases completely. This is not only fundamentally a very interesting observation but also one of high practical importance, facilitating enormously the handling of these surfactants at higher concentrations, which is typically required in almost all applications at some stage. It should also be noted that this behavior is unique for CO2 incorporation;
for instance, the incorporation of the hydrophobic propylene oxide (PO) unit, even at a much higher percentage of substitu-tion, still leads to the formation of a gel-like phase (e.g., shown for C12EO4PO5).[35]
Scattering experiments show that the origin of this surpris-ing behavior is a substantial dehydration of the head groups owing to the presence of the CO2moieties and a considerably
reduced repulsive interaction and interpenetration between the head groups. Together, this causes the repulsiveness of the interactions to become too weak to allow a higher ordering of the micelles, and therefore no liquid crystalline phases are formed.
This is an interesting example of how a fundamental investi-gation of the structural and phase behavior of a surfactant system allows for a systematic understanding based on the molecular architecture. Being able to work at any concentra-tion allows for more compact shipment, thereby reducing sub-stantially the ecological impact of the logistics for this large-scale commodity product. This information can be applied di-rectly in surfactant science for formulation at high concentra-tions. In addition, these CO2-containing surfactants contribute
to the aim of more sustainable chemistry as the petrol based EO units are replaced by CO2 (by up to 25 %). Furthermore,
even less surfactant has to be employed for typical applica-tions because the CO2 incorporation also reduces the cmc,
owing to the fact that the CO2 groups render the surfactant
more hydrophobic; the transfer energy for micellization is changed by @0.37 kT per CO2 unit. Finally, above the cmc the
CO2-containing surfactants also show lower surface tension
values (i.e., they are more effective surfactants). For all these reasons, and with this simple synthetic approach, it can be ex-pected that CO2-containing nonionic surfactants will become a
very promising alternative in the surfactant market.
Experimental Section
Surface tension measurements were performed with a du-Noey ring on a DCAT tensiometer (Data Physics) at 25, 30, 40, and 50 8C. The temperature was maintained by a circulating thermostat with
prior heating of the surfactant solution in an oven and an equili-bration time of 20 min. The surface tension was measured until the value remained constant for a given period, as defined by the mea-surement software (typically 350 s). The measured average surface tension was determined for each in a concentration range from 10@5up to 0.02 wt% and plotted as a function of logarithmic
con-centration. The cmc was determined by calculating the point at which the surface tension reaches a constant plateau value. In ad-dition, the surface tension measurements were used to determine the surface excess concentration (G) and the head group area (a0)
using the Langmuir–Szyszkowski isotherm[36][Eq. (3)]:
s ¼ s0@RTG ? lnð1 þ KcÞ ð3Þ
in which s is the surface tension [Nm@1], s
0the surface tension of
water (72.8 mNm@1 at 298 K), R the ideal gas constant
(8.314 JK@1mol@1), T the temperature, G the surface excess
concen-tration, K the absorption constant, and c the concentration. The head group area a0is related to the surface excess
concentra-tion by the Avogadro constant, NA, by Equation (4):
a0¼ ðG ? NAÞ@1 ð4Þ
According to the phase-separation model[37] and the mass-action
model,[38]the standard Gibbs free energy of micellization per mole
of monomer (DGmic) is given by Equation (5):
DGmic¼ RT ? lnccmc ð5Þ
in which xcmcis the mole fraction of surfactant in aqueous solution
at the cmc (assuming ideal behavior).
Rheology measurements were performed with a Bohlin Gemini 200 HR nano rheometer (Malvern Instruments), using a cone-plate ge-ometry (radius: 40 mm, gap size 150 mm, stainless-steel gege-ometry). In steady-state conditions, the applied shear rates varied from 0.00014 to 50 s@1. To analyze the viscoelastic behavior of these
samples, oscillatory measurements were performed with the same instrument and fixtures. A strain amplitude sweep was performed at a constant angular frequency of 6.3 Hz varying the amplitude of the shear stress at 0.01–15 Pa to identify the linear viscoelastic regime. Based on these measurements a frequency sweep at a shear stress of 0.5 Pa and angular frequencies varying from 0.6– 314.2 Hz was performed to determine the storage modulus G’ and the loss modulus G“. The reference surfactant was analysed with a MCR301 rheometer (Anton Paar) under the same measurement conditions.
SANS was measured at the Heinz Maier-Leibnitz Zentrum (MLZ) in Munich, Germany, on the Instrument KWS-1[39]and at the
Labora-toire L8on Brillouin (LLB) in Saclay, France, on the instrument PAXY. KWS-1 was operated at a wavelength of 5 a and a sample-to-de-tector distances (SDD) of 1.5 to 20 m, to cover a q-range of 0.015– 4 nm@1. Sample transmissions were measured at a SDD of 8 m. For
all scattering data, the intensities were divided by the correspond-ing transmission and sample thickness (1 mm), corrected for the empty cell, and normalized with respect to the scattering of a 1 mm sample of light water, according to standard procedures.[40]
The incoherent background was determined by a Porod plot. The SANS measurements performed at PAXY were performed at a wavelength of 4 a for SDDs of 1.2 and 5 m, and a wavelength of 12 a for an SDD of 6 m, thereby covering a q-range of 0.02– 6 nm@1.
ChemSusChem 2020, 13, 601 – 607 www.chemsuschem.org 606 T 2019The Authors. Published by Wiley-VCH Verlag GmbH & Co. KGaA, Weinheim
Acknowledgements
This work has been carried out within the project “Dream Re-source’’ (033RC002C). The project is funded by the German Feder-al Ministry of Education and Research (BMBF) within the funding priority ”CO2Plus—Stoffliche Nutzung von CO2zur Verbesserung
der Rohstoffbasis“. Covestro Deutschland AG is much thanked for providing the surfactants and M. Sebastian and M. Weinkraut for input regarding this manuscript. In addition, we are grateful to the LLB and JCNS for allocating SANS beam times. This work is based upon experiments performed at the KWS-1 instrument op-erated by JCNS at the Heinz Maier-Leibnitz Zentrum (MLZ), Garching, Germany and at the PAXY instrument at the Labora-toire L8on Brillouin (LLB, CEA-CNRS). Additionally, we would like to thank Professor Auhl for the use of the MCR301 Rheometer.
Conflict of interest
The authors declare no conflict of interest.
Keywords: carbon dioxide · liquid crystals · low viscosity · nonionic surfactants · small-angle neutron scattering
[1] Nonionic Surfactants: Physical Chemistry (Ed.: M. J. Schick), Marcel Dekker, New York, 1987.
[2] Industrial Application of Surfactants IV, Vol. 4 (Ed.: D. R. Karsa), Royal So-ciety of Chemistry, London, 1999.
[3] H. Janshekar, E. Greiner, T. Kumamota, Y. (Eva) Zhang, Surfactants - Spe-cialty Chemicals Update Program (SCUP), IHS Chemicals, 2015, https:// ihsmarkit.com/products/chemical-surfactants-scup.html.
[4] H. Wenk, J. Meyer, SOFW J. 2009, 135, 25 –30.
[5] P. Heunemann, S. Pr8vost, I. Grillo, C. M. Marino, J. Meyer, M. Gradzielski, Soft Matter 2011, 7, 5697.
[6] S. Klaus, M. W. Lehenmeier, C. E. Anderson, B. Rieger, Coord. Chem. Rev. 2011, 255, 1460– 1479.
[7] G. Trott, P. K. Saini, C. K. Williams, Philos. Trans. R. Soc. London Ser. A 2016, 374, 20150085.
[8] S. J. Poland, D. J. Darensbourg, Green Chem. 2017, 19, 4990 – 5011. [9] B. Grignard, S. Gennen, C. J8rime, A. W. Kleij, C. Detrembleur, Chem.
Soc. Rev. 2019, 48, 4466 – 4514.
[10] Y. Wang, J. Fan, D. J. Darensbourg, Angew. Chem. Int. Ed. 2015, 54, 10206 –10210; Angew. Chem. 2015, 127, 10344 –10348.
[11] J. Hilf, A. Phillips, H. Frey, Polym. Chem. 2014, 5, 814–818.
[12] J. Langanke, A. Wolf, J. Hofmann, K. Bçhm, M. A. Subhani, T. E. Meller, W. Leitner, C. Gertler, Green Chem. 2014, 16, 1865 –1870.
[13] A. M. I. Stute, M. Meuresch, C. Gertler, A. Wolf, R. Schom-cker, M. Grad-zielski, M. Tupinamba Lima, V. J. Spiering (Covestro AG, Leverkusen, Ger-many), WO2019076862, 2018.
[14] D. J. Mitchell, G. J. T. Tiddy, L. Waring, T. Bostock, M. P. McDonald, J. Chem. Soc. Faraday Trans. 1 1983, 79, 975.
[15] T. Kato, N. Taguchi, T. Terao, T. Seimiya, Langmuir 1995, 11, 4661– 4664. [16] S. Radiman, C. Toprakcioglu, T. McLeish, Langmuir 1994, 10, 61–67. [17] G. T. Dimitrova, T. F. Tadros, P. F. Luckham, Langmuir 1995, 11, 1101 –
1111.
[18] M. T. Lima, V. J. Spiering, S. N. Kurt-Zerdeli, D. C. Breggemann, M. Grad-zielski, R. Schom-cker, Colloids Surf. A 2019, 569, 156– 163.
[19] K. Shinoda, T. Yamaguchi, R. Hori, Bull. Chem. Soc. Jpn. 1961, 34, 237 – 241.
[20] M. J. Rosen, A. W. Cohen, M. Dahanayake, X. Y. Hua, J. Phys. Chem. 1982, 86, 541– 545.
[21] A. W. Cohen, M. J. Rosen, J. Am. Oil Chem. Soc. 1981, 58, 1062 –1066. [22] P. H. Elworthy, C. B. Macfarlane, J. Pharm. Pharmacol. 1962, 14, 100T –
102T.
[23] J. M. Corkill, J. F. Goodman, R. H. Ottewill, Trans. Faraday Soc. 1961, 57, 1627 –1636.
[24] S. Yada, T. Suzuki, S. Hashimoto, T. Yoshimura, Langmuir 2017, 33, 3794 –3801.
[25] M. J. Rosen, Surfactants and Interfacial Phenomena, Wiley, New York, 2004
[26] P. Sakya, J. M. Seddon, R. H. Templer, R. J. Mirkin, G. J. T. Tiddy, Langmuir 1997, 13, 3706 –3714.
[27] H. Hoffmann, W. Ulbricht, Curr. Opin. Colloid Interface Sci. 1996, 1, 726 – 739.
[28] M. Gradzielski, H. Hoffmann, G. Oetter, Colloid Polym. Sci. 1990, 268, 167– 178.
[29] K. L. Walther, M. Gradzielski, H. Hoffmann, A. Wokaun, G. Fleischer, J. Colloid Interface Sci. 1992, 153, 272– 284.
[30] K. Fontell, Adv. Colloid Interface Sci. 1992, 41, 127–147. [31] K. Mortensen, Y. Talmon, Macromolecules 1995, 28, 8829– 8834. [32] N. F. Carnahan, K. E. Starling, J. Chem. Phys. 1969, 51, 635 –636. [33] R. Kjellander, E. Florin, J. Chem. Soc. Faraday Trans. 1 1981, 77, 2053 –
2077.
[34] P. G. Nilsson, B. Lindman, J. Phys. Chem. 1983, 87, 4756– 4761. [35] J. Zhao, Z. N. Wang, X. L. Wei, F. Liu, W. Zhou, X. L. Tang, T. H. Wu, Indian
J. Chem. Sect. A 2011, 50, 641– 649.
[36] B. von Szyszkowski, Z. Phys. Chem. 1908, 64U, 385– 414. [37] E. Matijevic´, B. A. Pethica, Trans. Faraday Soc. 1958, 54, 587– 592. [38] J. N. Phillips, Trans. Faraday Soc. 1955, 51, 561.
[39] A. V. Feoktystov, H. Frielinghaus, Z. Di, S. Jaksch, V. Pipich, M.-S. Appa-vou, E. Babcock, R. Hanslik, R. Engels, G. Kemmerling, H. Kleines, A. Ioffe, D. Richter, T. Breckel, J. Appl. Crystallogr. 2015, 48, 61– 70. [40] S.-H. Chen, T. L. Lin, Methods Exp. Phys. 1987, 23B, 489– 543. Manuscript received: October 16, 2019
Revised manuscript received: November 22, 2019 Accepted manuscript online: November 25, 2019 Version of record online: December 30, 2019