HAL Id: hal-01458841
https://hal-amu.archives-ouvertes.fr/hal-01458841
Submitted on 5 Oct 2018
HAL is a multi-disciplinary open access
archive for the deposit and dissemination of
sci-entific research documents, whether they are
pub-lished or not. The documents may come from
teaching and research institutions in France or
abroad, or from public or private research centers.
L’archive ouverte pluridisciplinaire HAL, est
destinée au dépôt et à la diffusion de documents
scientifiques de niveau recherche, publiés ou non,
émanant des établissements d’enseignement et de
recherche français ou étrangers, des laboratoires
publics ou privés.
Active basement uplift of Sierra Pie de Palo
(Northwestern Argentina): Rates and inception
from10Be cosmogenic nuclide concentrations
Lionel Siame, Michel Sébrier, O. Bellier, D. Bourles, C. Costa, E.A. Ahumada,
C.E. Gardini, H. Cisneros
To cite this version:
Lionel Siame, Michel Sébrier, O. Bellier, D. Bourles, C. Costa, et al..
Active basement uplift
of Sierra Pie de Palo (Northwestern Argentina): Rates and inception from10Be cosmogenic
nu-clide concentrations. Tectonics, American Geophysical Union (AGU), 2015, 34 (6), pp.1129-1153.
�10.1002/2014TC003771�. �hal-01458841�
HAL Id: hal-01458841
https://hal-amu.archives-ouvertes.fr/hal-01458841
Submitted on 5 Oct 2018
HAL is a multi-disciplinary open access
archive for the deposit and dissemination of
sci-entific research documents, whether they are
pub-lished or not. The documents may come from
teaching and research institutions in France or
abroad, or from public or private research centers.
L’archive ouverte pluridisciplinaire HAL, est
destinée au dépôt et à la diffusion de documents
scientifiques de niveau recherche, publiés ou non,
émanant des établissements d’enseignement et de
recherche français ou étrangers, des laboratoires
publics ou privés.
Active basement uplift of Sierra Pie de Palo
(Northwestern Argentina): Rates and inception
from10Be cosmogenic nuclide concentrations
Lionel Siame, Michel Sébrier, O. Bellier, D. Bourlès, C. Costa, E.A. Ahumada,
C.E. Gardini, H. Cisneros
To cite this version:
Lionel Siame, Michel Sébrier, O. Bellier, D. Bourlès, C. Costa, et al..
Active basement uplift
of Sierra Pie de Palo (Northwestern Argentina): Rates and inception from10Be cosmogenic
nu-clide concentrations. Tectonics, American Geophysical Union (AGU), 2015, 34 (6), pp.1129-1153.
<10.1002/2014TC003771>. <hal-01458841>
RESEARCH ARTICLE
10.1002/2014TC003771 Key Points:
• Tectonic rates for basement uplift • Magnitude and regional denudation
pattern
• Scenario from basement exhumation to uplift for the Sierra Pie de Palo
Supporting Information:
• Tables S1–S4
• Text S1 and Captions of Tables S1–S4
Correspondence to:
L. L. Siame, siame@cerege.fr
Citation:
Siame, L. L., M. Sébrier, O. Bellier, D. Bourlès, C. Costa, E. A. Ahumada, C. E. Gardini, and H. Cisneros (2015), Active basement uplift of Sierra Pie de Palo (Northwestern Argentina): Rates and inception from10Be cosmogenic nuclide concentra-tions, Tectonics, 34, 1129–1153, doi:10.1002/2014TC003771.
Received 30 OCT 2014 Accepted 1 MAY 2015
Accepted article online 26 MAY 2015 Published online 6 JUN 2015
Active basement uplift of Sierra Pie de Palo (Northwestern
Argentina): Rates and inception from
10
Be cosmogenic
nuclide concentrations
Lionel L. Siame1,2,3, Michel Sébrier4, Olivier Bellier1, Didier Bourlès1, Carlos Costa5,
Emilio A. Ahumada5, Carlos E. Gardini5, and Hector Cisneros5
1Aix-Marseille Université, CNRS-IRD-Collège de France, UM34 Centre Européen de Recherche et d’Enseignement des
Géosciences l’Environnement, Technopôle de l’Arbois, Aix-en-Provence, France,2Institute of Earth Sciences, Academia
Sinica, Taipei, Taiwan,3Institute of Geophysics, National Central University, Chungli, Taiwan,4Institut des Sciences de la
Terre de Paris UMR 7193, CNRS, Université Pierre et Marie Curie, Paris, France,5Department of Geology, Universidad
Nacional de San Luis, San Luis, Argentina
Abstract
Quaternary tectonic and denudation rates are investigated for an actively growing basement anticline: the Sierra Pie de Palo range, which belongs to the Andean foreland of Northwestern Argentina (28◦S–33◦S). In this study, a detailed morphometric analysis of the topography is combined with in situ-produced cosmogenic10Be concentrations measured in (1) surface boulders abandoned on alluvial terraces affected by fault activity (along the north bounding fault) and growth of the basement fold (along the southeastern border), (2) bedrock outcrops corresponding to an exhumed and folded, regional erosion surface, and (3) fluvial sediments sampled at the outlets of several watersheds. Along the eastern and northern borders of the range, incision and uplift rates have been estimated at approximately 0.5 and 1 mm/yr when integrated on Holocene and Pleistocene time scales, in close agreement with both long-term (structural and basin evolution data) and short-term (GPS-derived velocity field) analyses. Cosmogenic-derived denudation and uplift rates combined with geomorphic characteristics of watersheds and river channels allows estimating the onset of the uplift at 4–6 Ma, followed by a more recent period of topographic rejuvenation at roughly 1–2 Ma, probably synchronous with steepening of the eastern and northern flanks of the anticline.1. Introduction
Quantification of relief creation is an important step in studying mountain building processes. Because relief development is mainly the result of complex interactions between tectonics and climate [Molnar, 2009], exam-ining relief changes with time not only requires quantification of tectonic deformation but also insights into the location and magnitude of erosional processes [Champagnac et al., 2014; Godard et al., 2014]. In active tectonic settings, faults grow by repeated coseismic displacements, increasing their cumulative offsets with time. In compressional domains, most reverse or thrust faults are commonly associated with folds; their lat-eral propagation and vertical movement produce deformation of the Earth’s surface in the form of flexures, which can be directly used to identify major areas of crustal or lithospheric deformation. Where reverse or thrust faults are hidden or even blind, the topographic disturbances caused by fold growth may be identified in the landscape, such as in the drainage network incising the uplifting structures [Molnar et al., 1994; Jackson et al., 1996]. However, there are only few cases for which the growth rates have been successfully determined using a well-constrained chronological framework [e.g., Jackson et al., 2002].
Located in the Andean foreland of Northwestern Argentina, the Sierra Pie de Palo (SPDP) range is a case study to quantify relief creation. The SPDP is an active basement anticline, the growth of which is controlled by crustal-scale reverse faults [Régnier et al., 1992; Smalley et al., 1993; Zapata, 1998; Ramos et al., 2002] and evidenced by the folding of a regional erosional surface exhumed from the Andean foreland Bermejo basin [Jordan et al., 1989]. In this region, a desert climate combined with high rates of tectonic deformation provides high-preservation potential of deformed geomorphic features. Indeed, the growth of the SPDP interfered with the impact of fluvial activity, resulting in stepped fluvial terraces that are uplifted, tilted, and/or faulted. Dating such geomorphic features using cosmic ray exposure (CRE) techniques has become a common method to estimate rates of tectonic deformation [e.g., Gosse and Phillips, 2001]. Even if this approach has been applied
to several sectors in this Andean region [Siame et al., 1997, 2002; Meigs et al., 2006; Schmidt et al., 2011, 2012; Hedrick et al., 2013], this area still lacks of a well-constrained chronological framework for alluvial deposition and abandonment.
In this study, we present new in situ-produced cosmogenic10Be data from this actively deforming and arid region of Northwestern Argentina. Thanks to a combination of detailed geomorphic and topographic analy-ses with CRE dating and quantification of denudation rates, we investigated the Plio-Quaternary uplift history of the SPDP. In situ-produced10Be concentrations were measured in (1) surface boulders abandoned on stepped alluvial surfaces affected by fault activity along the eastern and northern borders of the SPDP, (2) bedrock outcrops corresponding to the exhumed regional erosional surface, and (3) fluvial sediments sam-pled at the outlets of several watersheds that incised this erosional surface. The obtained results constrain the incision rates and provide minimum estimates on the Holocene and Pleistocene uplift rates associated with the growth of the SPDP. We also determined catchment-wide denudation rates that are 1 order of magnitude higher than bedrock denudation rates. Cosmogenic-derived denudation and uplift rates combined with geo-morphic characteristics of watersheds and river channels allows estimating the onset of the uplift at 4–6 Ma, followed by a more recent period of topographic rejuvenation at roughly 1–2 Ma, probably synchronous with steepening of the eastern and northern flanks of the anticline.
2. Regional Setting of the Andean Foreland of Northwestern Argentina
The Andean foreland of Northwestern Argentina (28◦S–33◦S) is located above the flat subduction of the Nazca Plate beneath the South American lithosphere [Cahill and Isacks, 1992; Yá˜nez et al., 2001; Anderson et al., 2007] ongoing at a rate of about 8 cm/yr with an azimuth of N74◦E (Figure 1a) [DeMets et al., 1990]. In this region, two compressional, opposite verging structural provinces are facing: the east verging, thin-skinned Argentine Precordillera (AP) fold-and-thrust belt and the west verging, thick-skinned Sierras Pampeanas (SP) basement uplifts (Figures 1b and 1c) [Ortiz and Zambrano, 1981; Ramos et al., 2002; Vergés et al., 2007].
The progressive shallowing of the Nazca slab induced a change in the geochemical properties of the Neo-gene volcanic rocks and subsequently the cessation of volcanic activity at roughly 7–6 Ma in the AP [Kay and Abbruzzi, 1996] and between 4.7 and 2 Ma in the SP [Gordillo and Linares, 1981; Kay et al., 1991; Kay and Gordillo, 1994; Urbina et al., 1997]. It also induced enhanced plate coupling [Jordan et al., 1983; Jordan and Allmendinger, 1986; Smalley et al., 1993] as well as thermal weakness of the crust associated with eastward migration of the magmatic arc [Ramos et al., 2002], which have long been considered to be responsible for thick-skinned basement uplifts in the SP.
In the AP, the timing of the craton-ward fold-and-thrust belt development has been determined through detailed magnetostratigraphic and growth strata studies of the synorogenic materials deposited within intramountain basins and the Bermejo Valley [Jordan et al., 1993; Zapata and Allmendinger, 1996]. In the West-ern AP, this deformation started at 19–20 Ma and propagated to the Central AP from 10–12 Ma to roughly 5 Ma [Jordan et al., 1993; Zapata and Allmendinger, 1996; Perucca and Onorato, 2011]. During the last 5 Ma, regional deformation concentrated along the west verging Eastern AP thrusts and folds, synchronous with the basement uplifts in the western SP [Jordan et al., 1993; Zapata and Allmendinger, 1996; Ramos et al., 2002]. In the northern SP (28◦S), stratigraphic data [Strecker, 1987] and apatite fission track [Coughlin et al., 1998] studies allows bracketing the main uplift of the Sierra Aconquija between 7.6–6.0 and 4.0–3.4 Ma [Ramos
et al., 2002]. Farther south (29◦S), magnetostratigraphic [Tripaldi et al., 2011] and isotopic [Tosselli, 1996;
Losada-Calderón et al., 1994] studies suggest an uplift inception between 4.5 and 4.2 Ma in the Sierra Famatina [Ramos et al., 2002]. To the south (Sierra de Còrdoba and Sierra de Chepes), ages of volcanic series (Figure 1b) [Kay and Abbruzzi, 1996; Kay and Gordillo, 1994; Gordillo and Linares, 1981] suggests an uplift timing between 6.0 and 5.5 Ma [Ramos et al., 2002].
For the SPDP, the thermal modeling of apatite fission tracks and (U-Th)/He ages supports an onset of final cooling and exhumation of this western Pampean range between Cretaceous and Paleogene time (at about 60 Ma), in relation with an early phase of Andean compression [Löbens et al., 2013b]. These authors also pro-posed that the relief associated with the SPDP may have existed since the Mesozoic [e.g., Carignano et al., 1999]. Conversely, Ramos et al. [2002] suggested that the exhumation of the SPDP started at roughly 3 Ma (Figure 1b), controlled at depth by a midcrustal wedge, with average shortening and uplift rates of about 4 and 1 mm/yr, respectively. Finally, the exhumation of this range has alternatively been described as a result
Figure 1. (a) Geodynamic setting of Central Andes at30◦S. Red dots show the earthquake distribution (U.S. Geological Survey, National Earthquake Information
Center; Preliminary Determination of Epicenter catalog, 1973 to 2014, depth≤70 km, magnitude≥4.0). Yellow solid triangles correspond to Plio-Quaternary and
active volcanoes. Black and white arrows represent the relative convergence of the Nazca and South American Plates following NUVEL-1 [DeMets et al., 1990] and continuous GPS observation [Brooks et al., 2003], respectively. Numbers are given in mm/yr. Isodepth contours of the subducted Nazca Plate are shown after Cahill and Isacks [1992]. (b) Schematic regional structural map locating the Argentine Precordillera (AP) and the western Sierras Pampeanas (SP). White and red numbers (given in Ma) refer to inception of deformation [Jordan et al., 1993; Zapata and Allmendinger, 1996; Ramos et al., 2002]. (c) Structural regional map of AP and SP from SPOT and Landsat image analysis (modified after Siame et al. [2005]). Structures bounding the Sierra Pie de Palo (SPDP) are highlighted in red. Seismicity
frequency grid derived from the Preliminary Determination Epicenter catalog (100×112, 4 km large cells). Orange solid circles show the epicenter distribution
of relocated seismic events [Engdahl and Villase˜nor, 2002]. Black squares locate historical seismic events [Instituto Nacional de Prevencòn Sísmica (INPRES), 2014].
Light blue stars locate 15 January 1944 (Mw= 7.0) and 11 June 1952 (Mw= 6.8) earthquakes with focal mechanism solutions after Alvarado and Beck [2006]. Black
solid stars locate foreshore and main shocks of the Caucete 23 November 1977 (Ms= 7.4) earthquake (focal mechanism solutions after Langer and Hartzell [1996]).
(d) Close-up on the seismic activity of the SPDP. Large red solid circles locate the focal mechanism solutions from Harvard Centroid Moment Tensor Catalog (1973
to 2014). Lower left number indicates the focal depth (km). Lower right number indicates theMwvalue. Locations are from the National Earthquake Information
Center Preliminary Determination Epicenter catalog (U.S. Geological Survey). Red dots correspond to the seismicity recorded by Régnier et al. [1992]. Solid black stars locate the foreshock and the main shock of the 23 November 1977 Caucete earthquake [Langer and Hartzell, 1996]. Black solid squares locate the two main aftershocks [Kadinsky-Cade et al., 1985]. A1 and A2 aftershocks correspond to the Harvard events 112877C and 120677A, respectively. Keys: CAP, Central Argentine Precordillera; CF, Las Chacras Fault; CT, Chilean terrane; CuT, Cuyania terrane; EAP, Eastern Argentine Precordillera; EPF, Eastern Pie de Palo Fault; ETF, El Tigre Fault; GEM, Grande El Molle lineament; GL, Guayaupa-Lima lineament; JFR, Juan Fernandez Ridge; LF, La Laja Fault; LPF, Los Pajaritos Fault; MB, Matagusanos Basin; NPF: North Pie de Palo Fault; PFS, Pampean flat slab segment; PR, Perdida Ridge; PT, Precordilleran terrane; RF, Rinconada Fault; SA, Sierra Ambato; SC, Sierra de Chepes; SFa: Sierra de Famatina; SFi, Sierra Fiambalà; SH, Sierra de la Huerta; SHF, Sierra de la Huerta Fault; SMa: Sierra Morada; SMz, Sierra La Maz; SPDP, Sierra Pie de Palo; SU: Sierra Umango; SV, Sierra Velasco; SVF, Sierra de Valle Fértil; TFS, Tullum Fault System; TFZ, Tucumán fault zone; UB, Ullùm Basin; VPF, Villicùm-Pedernal Fault; WAP, western Argentine Precordillera.
Figure 2. Geomorphic characteristics of the Sierra Pie de Palo. (a) Morphometric map of watersheds and piedmont deposits of the SPDP. Watersheds contours have been extracted from the SRTM90 DEM and are colored according to their hypsometric integral values. Alluvial fans have been mapped using Landsat and SPOT images, as well as SRTM90 DEM and derived slope grid. They are colored according to their slope values, averaged over alluvial area around the sample
pixel. Both≈N-S (A-A′) and≈E-W (B-B′) topographic cross sections have been extracted from the SRTM90 DEM (thick solid lines) and the reconstructed regional
erosion surface (thick dotted lines). (b) Map of the topographic ridges extracted from the SRTM90 DEM. (c) Map of the surfaces with local slope lower than 10° extracted from the SRTM90 DEM. (d) DEM of the surface envelope of the SPDP (overlaid on the SRTM90 DEM) reconstructed by interpolation of the elevation points extracted from the ridges (Figure 2b) and low-slope areas (Figure 2d). (e) Map of the vertical incision derived from the subtraction of the envelope surface
and the SRTM90 DEM. Spatial integration of these vertical incision values yield to the estimation of a minimum eroded volume of roughly 135 km3. Keys: GEM,
Grande El Molle lineament; GL, Guayaupa-Lima lineament.
of cataclastic diapirism, which is proposed to produce dome-like topography at the surface due to lateral compressive forces and density differences [Vita-finzi, 2009].
Since roughly 150 years ago, this region experienced several large earthquakes, with the most recent events in 1944 (Mw7.0), 1952 (Mw6.8), and 1977 (Mw7.4) (Figure 1c) [Kadinsky-Cade et al., 1985; Langer and Hartzell, 1996; Alvarado et al., 2005; Alvarado and Beck, 2006; INPRES, 2014; Perucca and Vargas, 2014]. The regional high level of crustal seismic activity is characterized by hypocentral depths ranging between 5 and 35 km [Smalley et al., 1993]. Most historical and large instrumental earthquakes are located to the east of the AP, with two main clusters of seismic activity centered below the Tullùm-Ullùm basins, close to the San Juan city, and around the SPDP, particularly along its eastern edge (Figure 1c). This seismicity pattern is also underlined by epicen-ter distributions from local seismic networks [Régnier et al., 1992; Smalley et al., 1993], relocated teleseismic events [Engdahl and Villase˜nor, 2002], and is in good agreement with the location of the regional active faults (Figures 1c and 1d). Close to the city of San Juan, it has been proposed that the fault responsible for the 1944 San Juan earthquake could be either the west verging thrusts associated with the Eastern AP [Siame et al., 2002; Alvarado and Beck, 2006] or an east verging, deep crustal thrust located beneath the Eastern AP thrust system [Meigs et al., 2006; Meigs and Nabelek, 2010; Rockwell et al., 2014]. Combining the relative locations of the double main shock and its aftershocks with observed coseismic elevation changes, Kadinsky-Cade et al. [1985] concluded that most of the coseismic slip associated with the 1977 Caucete earthquake occurred on a west dipping fault, buried beneath the eastern flank of the SPDP. However, a common characteristic of these two large earthquakes is that only limited surface coseismic ruptures were produced.
3. Methods
In this study, the regional geomorphic characteristics of the SPDP have been investigated at the regional scale using an extract of the 3 arc sec (roughly 90 m) resolution digital elevation model (DEM) from the Shut-tle Radar Topography Mission (SRTM) database (ftp://e0srp01u.ecs.nasa.gov/srtm/version2/SRTM3/), which has been postprocessed according to Reuter et al. [2007] to remove the no-data regions due to insufficient textural detail, characteristic of mountainous regions such as the Andes (http://srtm.csi.cgiar.org). The topo-graphic grid has been processed in a Geotopo-graphical Information System (Mapinfo), combined with Rivertools and Vertical Mapper softwares, to derive slope maps or vector objects like stream segments and watershed boundaries. Together with topographic and slope grids, a combination of SPOT panchromatic images and Landsat TM satellite images was used to map the alluvial landforms that skirt the piedmonts of the SPDP. Figure 2a presents a combination of these different geographic layers, with the main watersheds and the alluvial units mapped as a function of their hypsometric integral values and average slopes, respectively. At selected sites (see section 5), topographic surveys were performed with a total station (Leica TC 805), using the reference point 14-059 of the PASMA network (National Geographic Institute of Argentina), and planar coordinates (Gauss Krüger, Zone 2, and WGS84 datum).
To provide chronological constraints on alluvial terraces affected by fault activity and to estimate bounds on the denudation rates associated with the SPDP development, we used in situ-produced10Be concentra-tions resulting from spallation and muonic reacconcentra-tions on Silicon and Oxygen in quartz minerals. For complete reviews of in situ-produced cosmogenic techniques, one can refer to Gosse and Phillips [2001] and Balco et al. [2008] as well as to the supplemental material associated with this article. Measurements of in situ-produced 10Be concentrations were performed at the French AMS national facility ASTER (CEREGE, Aix-en-Provence) [Arnold et al., 2010]. The in situ-produced10Be results and derived minimum CRE ages and denudation rates are summarized in Table 1.
To examine the statistical significance of the cosmogenic nuclide-derived minimum CRE ages and maximum denudation rates, outliers were first identified applying the reduced chi-square statistic [Ward and Wilson, 1978] and the mean square weighted deviation (MSWD) for each group of samples. This allows accounting for the relative importance of both the internal and external reproducibility and comparing the observed variability defined by the uncertainties of the data [McIntyre et al., 1966]. To downplay the weight of high or low outliers, another approach consists of applying a nonparametric bootstrap calculation of the central value for a given population of samples and its associated uncertainties. This bootstrap technique is particu-larly suitable for small data sets and/or when probability distributions are nonnormal [Efron, 1979; Efron and Tibshirani, 1986, 1993; Davison and Hinkley, 1997]. More importantly, it has the particularity of being sta-tistically law independent. The numerical results of the MSWD and bootstrap analyses are presented in the supporting information associated with this article.
4. The Sierra Pie de Palo Range
4.1. Geomorphic Characteristics of the Sierra Pie de Palo Range
Located in the westernmost SP (Figure 1c), the SPDP is a NNE striking ellipsoid basement block (80 km long and 40 km wide) that reaches up to 3162 m elevation at Cerro Mogote (Figure 2a). As described above, it is an actively growing basement anticline [Ramos et al., 2002] associated with a high level of crustal seismic-ity [Régnier et al., 1992; Smalley et al., 1993], which forms a dissymmetrical arch with steeper slopes along its northern and eastern sides compared to its western and southern sides (Figures 2b and 2c) [Siame et al., 2006]. The western long limb is dissected by two main gorges, superimposed on ENE-WSW basement lineaments (Guayaupa-Lima and Grande El Molle) (Figures 1c and 2a) [Baldis et al., 1979; Instituto Nacional de Prevencòn Sísmica (INPRES), 1982]. However, at least at a first order, neither NNW striking topographic sections nor the eastern front reveal any significant vertical or horizontal displacements associated with these basement structures, which probably remained inactive during Cenozoic times.
The relatively flat areas that comprise most of the SPDP topography define a convincing surface envelope along both N-S and E-W directions (Figures 2b and 2c). These flat surfaces are characteristic of most of the Pampean ranges and have long been referred to as the “Pampean peneplain” [Jordan et al., 1989]. This ero-sion surface is probably polygenic, and its age is still a matter of debate, with stratigraphic data indicating that it may have formed after Middle Paleozoic to Cretaceous [e.g., Jordan et al., 1989; Carignano et al., 1999]. According to Jordan et al. [1989], this regional erosion surface has been deformed and exhumed during the
Ta b le 1 . Sample List and A ssociat ed C osmogenic Nuclide -Deriv ed Denudation R a te or Exposur e A ges a C osmogenic P roduc tion Sample P osition P roduc tion R a te (a t/g/yr) Denuda tion Exposur e Sample Geomor phic Plac e Long itude Latitude Elevation P ressur e St one Shielding Slo w Fast C onc entration R a te (m/M yr) A ge (k yr) ID P osition Name ( ◦WGS84) ( ◦WGS84) (m) (mbar) S caling Fa ct or Total S palla tion Muons Muons V a lue E rr or V a lue Err or V alue Err or Bedr ock D enudation PDP2 Summit M ogot e − 67.92 − 31.31 3072 695 7.26 0.99 32.41 31.72 0.49 0.21 4,755,360 172,620 4.4 0.7 NA b NA PDP3 Summit M ogot e − 67.92 − 31.31 3071 695 7.25 0.99 32.39 31.69 0.49 0.21 3,660,650 134,086 5.9 1.0 NA NA PDP4 Summit M ogot e − 67.92 − 31.31 3092 693 7.34 1.00 32.97 32.26 0.49 0.21 2,133,655 85,529 10.9 1.8 NA NA PDP12a Er osional sur fac e N iquizanga − 67.88 − 31.58 890 911 1.70 1.00 7.64 7.47 0.11 0.05 1,543,986 50,363 3.0 0.5 NA NA PDP14a Er osional sur fac e N iquizanga − 67.88 − 31.58 890 911 1.70 1.00 7.64 7.47 0.11 0.05 1,229,901 74,251 3.9 0.7 NA NA PDP50 Er osional sur fac e N iquizanga − 67.88 − 31.58 897 910 1.71 1.00 7.68 7.51 0.12 0.05 1,013,402 39,403 4.9 0.8 NA NA W at ershed D enudation PDP10 Outlet Salinas Grandes − 68.16 − 31.37 1960 799 3.73 0.98 16.43 16.08 0.25 0.11 194,773 10,922 64.5 11.0 NA NA PDP20 Outlet Quebrada − 67.87 − 31.06 1320 864 2.32 0.96 10.05 9.83 0.15 0.07 70,512 11,333 109.9 25.1 NA NA PDP32 Outlet Quebrada − 67.87 − 31.58 1419 854 2.54 0.99 11.30 11.06 0.17 0.07 204,060 8,432 41.8 7.0 NA NA PDP84 O utlet A gua B ra va − 67.85 − 31.07 1994 796 3.80 0.98 16.70 16.34 0.25 0.11 118,210 5,571 108.9 18.3 NA NA Alluvial Exposur e A ges PDP41 Alluvial unit (T2) N iquizanga − 67.87 − 31.58 755 926 1.54 1.00 6.90 6.76 0.10 0.04 207,478 9,742 NA NA 30,275 5,093 PDP42 Alluvial unit (T2) N iquizanga − 67.87 − 31.58 755 926 1.54 1.00 6.91 6.76 0.10 0.04 196,827 13,178 NA NA 28,705 5,020 PDP43 Alluvial unit (T2) N iquizanga − 67.87 − 31.58 754 926 1.54 1.00 6.90 6.75 0.10 0.04 65,933 13,530 NA NA 9,574 2,500 PDP62 Alluvial unit (T2) N iquizanga − 67.87 − 31.58 755 926 1.54 1.00 6.91 6.76 0.10 0.04 191,115 17,253 NA NA 27,859 5,156 PDP63 Alluvial unit (T2) N iquizanga − 67.87 − 31.58 754 926 1.54 1.00 6.90 6.76 0.10 0.04 264,801 10,783 NA NA 38,729 6,453 PDP37 Alluvial unit (T6) N iquizanga − 67.87 − 31.58 811 920 1.60 1.00 7.20 7.04 0.11 0.05 737,009 29,054 NA NA 105,128 17,482 PDP38 Alluvial unit (T6) N iquizanga − 67.87 − 31.58 808 920 1.60 1.00 7.18 7.03 0.11 0.05 465,421 61,998 NA NA 65,861 13,791 PDP39 Alluvial unit (T6) N iquizanga − 67.87 − 31.58 807 920 1.60 1.00 7.18 7.02 0.11 0.05 700,490 29,369 NA NA 100,075 16,703 PDP56 Alluvial unit (T6) N iquizanga − 67.87 − 31.58 809 920 1.60 1.00 7.19 7.03 0.11 0.05 1,309,751 49,768 NA NA 191,001 31,699 PDP34 Alluvial unit (T8) N iquizanga − 67.87 − 31.58 850 915 1.65 1.00 7.41 7.25 0.11 0.05 568,330 18,697 NA NA 78,174 12,889 PDP35 Alluvial unit (T8) N iquizanga − 67.87 − 31.58 851 915 1.65 1.00 7.42 7.26 0.11 0.05 528,818 40,457 NA NA 72,592 12,976 PDP28 H ighest reg ional sur fac e N iquizanga − 67.87 − 31.57 797 921 1.58 1.00 7.11 6.95 0.11 0.05 941,106 36,285 NA NA 136,989 22,753 PDP29 H ighest reg ional sur fac e N iquizanga − 67.86 − 31.57 818 919 1.61 1.00 7.24 7.08 0.11 0.05 676,993 26,448 NA NA 95,816 15,926 PDP31 H ighest reg ional sur fac e N iquizanga − 67.86 − 31.57 828 918 1.62 1.00 7.30 7.14 0.11 0.05 1,150,289 44,365 NA NA 164,226 27,277 PDP70 A lluvial u nit (T1) A gua B ra va − 67.84 − 31.06 849 915 1.63 1.00 7.31 7.15 0.11 0.05 181,859 25,076 NA NA 25,029 5,316 PDP71 A lluvial u nit (T1) A gua B ra va − 67.84 − 31.06 850 915 1.63 1.00 7.32 7.16 0.11 0.05 55,292 20,442 NA NA 7,573 3,055 PDP72 A lluvial u nit (T1) A gua B ra va − 67.84 − 31.06 851 915 1.63 1.00 7.32 7.16 0.11 0.05 102,881 5,408 NA NA 14,101 2,396 PDP74 A lluvial u nit (T1) A gua B ra va − 67.85 − 31.06 846 916 1.63 1.00 7.29 7.14 0.11 0.05 53,276 7,649 NA NA 7,317 1,581 PDP75 A lluvial u nit (T2) A gua B ra va − 67.84 − 31.06 852 915 1.63 1.00 7.33 7.17 0.11 0.05 205,171 18,329 NA NA 28,183 5,203
Ta b le 1 . (c ontinued) C osmogenic P roduc tion Sample P osition P roduc tion R a te (a t/g/yr) Denuda tion Exposur e Sample Geomor phic Plac e Long itude Latitude Elevation P ressur e St one Shielding Slo w Fast C onc entration R a te (m/M yr) A ge (k yr) ID P osition Name ( ◦WGS84) ( ◦WGS84) (m) (mbar) S caling Fa ct or Total S palla tion Muons Muons V a lue Err or V alue Err or V alue Err or PDP76 A lluvial u nit (T2) A gua B ra va − 67.84 − 31.06 854 915 1.64 1.00 7.34 7.18 0.11 0.05 227,071 18,787 NA NA 31,182 5,660 PDP77 A lluvial u nit (T2) A gua B ra va − 67.84 − 31.06 854 915 1.64 1.00 7.34 7.18 0.11 0.05 1,825,251 70,050 NA NA 265,540 44,093 PDP78 A lluvial u nit (T2) A gua B ra va − 67.84 − 31.06 862 914 1.65 1.00 7.38 7.22 0.11 0.05 125,947 8,708 NA NA 17,133 3,011 PDP79 A lluvial u nit (T3) A gua B ra va − 67.85 − 31.06 931 906 1.73 0.99 7.70 7.53 0.12 0.05 319,336 14,500 NA NA 41,932 7,037 PDP80 A lluvial u nit (T3) A gua B ra va − 67.85 − 31.06 927 907 1.73 0.99 7.69 7.52 0.12 0.05 383,954 15,133 NA NA 50,572 8,410 PDP81 A lluvial u nit (T3) A gua B ra va − 67.85 − 31.06 931 906 1.73 0.99 7.70 7.53 0.12 0.05 256,779 18,892 NA NA 33,634 5,971 PDP82 A lluvial u nit (T3) A gua B ra va − 67.85 − 31.06 914 908 1.71 0.99 7.64 7.48 0.11 0.05 272,386 15,311 NA NA 35,971 6,153 PDP85 A lluvial u nit (T3) A gua B ra va − 67.85 − 31.07 916 908 1.71 1.00 7.67 7.50 0.12 0.05 387,578 15,208 NA NA 51,189 8,510 PDP87 A lluvial u nit (T3) A gua B ra va − 67.84 − 31.06 860 914 1.64 1.00 7.38 7.22 0.11 0.05 318,244 20,846 NA NA 43,609 7,602 aMe a su re d 10 Be / 9Be ratios and 10 B e co nc entrations u sed for det er mining minimum C RE ages and maximum denudat ion rat es in the Sier ra P ie de P alo ar ea. Samples p reparation fo llo w ed a pr ot oc ol adapt ed af ter Bro w n et a l. [1991]. M easur ements b y ac celerat o r mass spec tr o metr y (A MS) w er e p er fo rmed at the Fr ench A MS National Facilit y ASTER (CEREGE, Aix-en-P ro v enc e) [A rnold et al ., 2010]. 10 Be / 9Be ratios w er e calibrat ed dir ec tly against the National Institut e of Standar ds and Technology standar d ref er enc e mat erial 4325 using an assig ned 10 Be / 9Be value of (2.79 ± 0.03) × 10 − 11 [Nishiizumi et al ., 2007] and a 10 Be half-liv e o f (1.39 ± 0.01) × 10 6years as rec ommended b y K orschinek et al .[2010] and Chmeleff et al .[2010] ac cor ding to their independent measur ements .T his standar dization is equivalent to 07KNSTD within rounding err or .I n this study ,38 samples w er e p repar ed in tw o separat ed b at ches .A first series of 16 sampled w er e pr epar ed using a commer cial carrier solution (Plasmanorm) leading to a pr oc ess blank isot opic ratio of (1.11 ± 0.11) × 10 − 14 (suppor ting inf orma tion and sec tion 3). A sec ond series of 22 samples w er e pr epar ed using a n in-house car rier solution pr epar ed fr om deep mined phenak it e [Mer chel et al ., 2008], leading to a pr oc ess blank isot opic ratio of (4.54 ± 0.61) × 10 − 15 (suppor ting inf orma tion). T hick ness of samples was compr ised b et w een 3 and 5 cm. Sur fac e p roduc tion rat es w er e calculat ed follo wing Stone [2000] a nd corr ec te d for geomorphic shielding a cc or d ing to D unne et al .[1999]. Muonic and spallogenic co mponent p aramet ers ar e those det er mined b y Br aucher et al .[2011]. Unc er tainties on 10 B e co nc entrations ar e calculat ed u sing the standar d er ro r p ro pagation method u sing the quadratic sum of the relativ e er rors associat ed to the number of counts dur ing 3600 s of measur ement ( N ), AMS int ernal err or (0.5% for ASTER), and err or associat ed to pr oc edural blanks [A rnold et al ., 2010]. Unc er tainties o n C RE ages and denudation rat es p ro pagat e the 10 Be conc entration unc er tainties together with a conser v ativ e 15% err or to ac count for variabilit y of the pr oduc tion rat es with time [Lal ,1991]. bNA: Not a v ailable .
Neogene. Conversely, Carignano et al. [1999], Rabassa et al. [2010], Löbens et al. [2011, 2013a, 2013b], Bense et al. [2013], and Enkelmann et al. [2014] considered that Pampean reliefs may have persisted since the Meso-zoic. Nowadays, the SPDP is only constituted by Paleozoic and Precambrian basement rocks, without any younger outcropping geological formations [Ramos and Vujovich, 2000]. East of the Bermejo Valley, at the same latitude as the SPDP, the southern tip of Sierra de la Huerta is partly covered by Triassic deposits that are affected by Quaternary deformation along the Las Chacras Fault [Costa et al., 2000; Siame et al., 2005] (Figure 1c). To the south, the SPDP is covered by the Late Quaternary sand dunes field of Medanos Grandes [Tripaldi et al., 2010]. To the east and northeast of the SPDP, Pliocene deposits including materials derived from the AP suggest that the SPDP was once covered by Andean foreland deposits before being exhumed during the regional Neogene deformation [Ramos and Vujovich, 2000; Ramos et al., 2002]. Whether the regional ero-sion surface formed during one or several denudation cycles is beyond the scope of this paper. However, it is an important regional geomorphic marker that allows gauging the deformation that has affected the SPDP. The lithological characteristics and semiarid climate contributed to good preservation of the surface enve-lope of the basement fold. Consequently, considering that these conditions are fairly constant throughout the range, any tectonic perturbation should be discriminated using geomorphic indices associated with the drainage network. Among such indices, the hypsometric integral value, which is related to the degree to which a landscape is dissected, is commonly used to discriminate between tectonically active against inactive areas [Strahler, 1952]. This morphometric approach shows that the watersheds with higher integral hypsometric values are preferentially located along the northern and eastern flanks of the SPDP (Figure 2a). The elongated, almost rectilinear shape of the watersheds that dissect the northern and eastern flanks also correlate well with the steep slopes in these areas. Another line of geomorphic evidence for tectonic activity is the distribution pattern of the alluvial terraces that skirt the mountain periphery, with more alluvial generations along the northern and eastern flanks than at the toe of both the western and southern flanks. Furthermore, the aver-age slope of these alluvial units increases up to 8–11◦along the northeastern corner of the range, whereas it is elsewhere restricted to less than 4◦, close to the original depositional slope (Figure 2a). All together, these geomorphic observations strongly suggest that most of the Quaternary deformation associated with this basement fold is concentrated along its northern and eastern flanks [Siame et al., 2006].
To reconstruct the surface envelope of the SPDP, the ridges and local summits have been extracted from the SRTM DEM together with the areas where the local slope is lower than 10◦(Figures 2d and 2e). This resulted in a database of elevation points that was then interpolated (Inverse Distance Weighting) to produce a theoretical surface envelope that can be considered as a relatively good proxy for the shape of the SPDP fold (Figure 2f ). The difference between this theoretical envelope and the present-day topography represents the minimum volume of rocks that has been eroded by fluvial and hillslope processes since the SPDP has been uplifted. In Figure 2g, the present-day vertical incision is shown in map view and unveils total vertical incision as high as 700 m for the main valleys. The spatial integration of these vertical incision heights allows estimating a total eroded volume of about 135 km3.
4.2. Structural Model for the Sierra Pie de Palo Range
The SPDP is bounded by three regional tectonic structures (Figure 3). The major structure controlling the east-ern border of the SPDP is a matter of debate. One possibility is the Ampacama-Nikizanga Fault, which runs for roughly 65 km with an average strike of N21◦E, and has been described as an east dipping fault that splays at about 20 km depth off a midcrustal décollement in connection with the west verging, thick-skinned mas-ter fault bordering the Sierra de la Huerta, south of the Sierra Valle Fértil System [Langer and Bollinger, 1988; Costa et al., 2000; Ramos et al., 2002]. However, leveling surveys including after the 1977 Caucete earthquake [Kadinsky-Cade et al., 1985; Reilinger and Kadinsky-Cade, 1985] as well as crustal reconstructions from shallow and deep seismic profiles [Zapata, 1998] favor a west dipping, east verging blind fault below the eastern bor-der of the SPDP (Figure 3). This hypothesis is in good agreement with the observed first-orbor-der topographic signature of a steeper eastern flank and with the fact that, along most of the eastern flank length, the Neogene strata generally dip to the east and the Plio-Quaternary deposits are not affected by any major fault (Figure 4). To avoid any confusion with the previously described Ampacama-Niquizanga Fault, we refer to this crustal, antithetic thrust as the Eastern Pie de Palo Fault (EPF).
The northern boundary of the range is delimited by the North Pie de Palo Fault (NPF), a roughly E-W trans-pressive, left-lateral fault that extends over 80 km from the Matagusanos basin, south of the Mogna Anticline in the Eastern Precordillera [Zapata, 1998], to the Sierra de Valle Fértil Fault (Figure 3). This regional structure
Figure 3. Tentative structural model for the Sierra Pie de Palo. (a) Schematic structural map showing the major faults in
vicinity of the SPDP. Same fault abbreviations than in Figure 1. (b) Schematic cross section (B-B′) at about31.5◦S latitude
showing the thick-skinned deformation front (modified after Vergés et al. [2007]); Central Precordillera after Von Gosen [1992]; Eastern Precordillera after Zapata [1998], Siame et al. [2002], and Alvarado and Beck [2006]; and structure at depth modified after Régnier et al. [1992], Smalley et al. [1993], and Ramos et al. [2002].
coincides with a major northward change in the basement depth across the southern boundary of the Bermejo basin [Jordan and Allmendinger, 1986]. The NPF runs along the northern edge of the SPDP for approx-imately 26 km at the contact between the metamorphic basement and the Neogene foreland strata. This part of the NPF, referred as the Pajaritos Fault [Costa et al., 2000], has a rectilinear trace, suggesting a relatively high dip to the south (at least 50–60◦). At the northeastern corner of the SPDP, the Pajaritos Fault affects a series of alluvial landforms and exhibits a well-developed, 4 km long, north facing fault escarpment with a right-stepping relay that agrees well with a horizontal left-lateral component (Figure 5).
Finally, the southern half of the western SPDP side is bounded by the Tullum Fault System (TFS) [Zambrano and Suvires, 2008], which extends over 120 km farther south (Figures 1c and 3). This fault system is described as superimposed on the suture between the Cuyania and Precordillera terranes [Ramos et al., 2002] and shows to the south of the SPDP limited and isolated bedrock (e.g., Cerro Salinas) exposures along strike (Figure 1c). Con-sidering that the western border of the SPDP is relatively linear only along its southwestern termination and
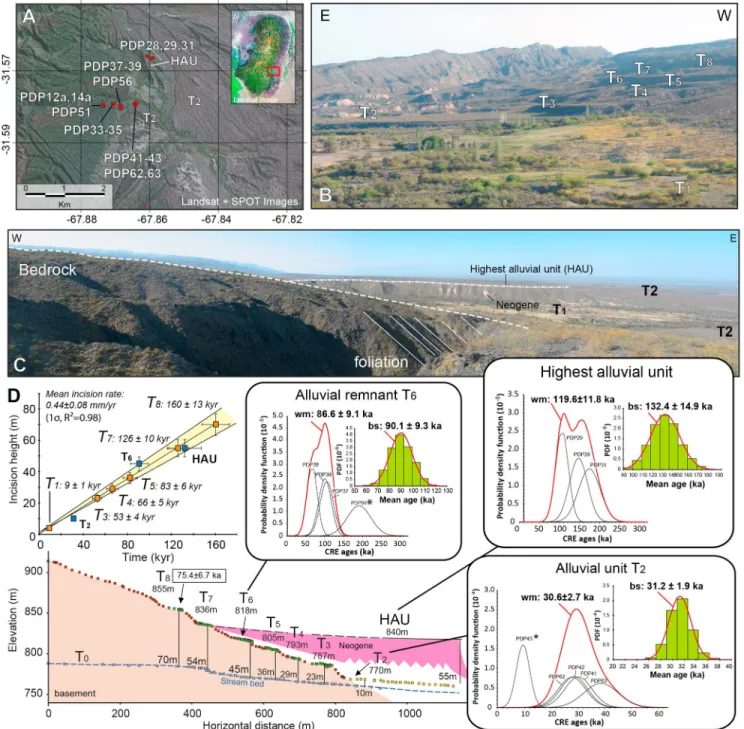
Figure 4. Niquizanga area (southeastern SPDP). (a) Sample location map overlain on a combination of SPOT and Landsat images. (b) Field photograph toward
the southwest showing the alluvial remnants stepped onto the SPDP lowermost topography. Alluvial units are labeled from T0corresponding to the present-day
streambeds. (c) Panoramic photograph showing the dipping paleoerosion surface and its lateral relationships with the highest alluvial unit (HAU). (d) Topographic cross section constructed across the stepped alluvial remnants from field topographic survey. The HAU’s elevation is projected onto the cross section for correla-tion. Numbers give the local river incision measured vertically below the alluvial remnants to the present-day streambed. Statistical analysis of CRE ages obtained
for the alluvial units (T2, T6, and HAU). For each group of samples, outliers are identified (*); weighted mean (wm) and bootstrap mean (bs) are shown in the form
of probability function plots (see also supporting information and section 3). Local incision rate derived from vertical incision measurements and CRE dating of
the T2, T6, and HAU (solid blue squares). Assuming constant incision rate allows estimating the age bracketing (italic numbers) of the other alluvial units (solid
Figure 5. Agua Brava area (northern SPDP). (a) Geomorphic map of the Los Pajaritos Fault along the northern border of the SPDP showing the distribution of the alluvial units overlaid on to a Quickbird satellite image. Alluvial units are
labeled from T0corresponding to the present-day streambed. Inset shows the location of Figure 5a. (b) Sample location
map overlain on an extract of the Quickbird image. (c) Map view of the data acquired during the topographic survey (solid grey circles) locating the topographic profiles (thick red lines). The topographic profiles are depicted in Figure 6.
(e) Field photograph of the 3 m high topographic escarpment affecting the younger T1alluvial unit. (Figures 5e and 5f )
Bird’s eye view photographs taken from a plane during a reconnaissance survey showing the different alluvial units and the topographic escarpment associated with the Pajaritos Fault.
the first-order topographic signature in both E-W and N-S directions, the TFS is likely to have been reactivated to accommodate the propagation of the SPDP toward the south.
To account for the geomorphic and topographic signatures presented in this paper and previously published geophysical interpretations [Volponi et al., 1983; Kadinsky-Cade et al., 1985; Reilinger and Kadinsky-Cade, 1985; Zapata, 1998], we consider that the development of the SPDP basement anticline should have been mainly controlled by (1) a blind, antithetic, east verging thrust fault located at depth below the eastern basement fold forelimb (EPF) and (2) a reverse, left-lateral crustal ramp (Pajaritos Fault) running along the northern border of the SPDP, which prevented its northward propagation.
5. Uplift and Denudation Rates
In the following sections, the morphotectonic settings of the sites selected for quantifying Quaternary rates of vertical incision and surface uplift are presented together with the obtained minimum CRE ages. The first
series of alluvial terraces is located along the southeastern border of the SPDP (Niquizanga) and allows deci-phering rates of river incision and basement uplift associated with the growth of the fold above the buried EPF. The second series of alluvial terraces is located at the northeastern corner of the SPDP (Agua Brava) and allows estimating uplift rates associated with the eastern segment of the NPF (Pajaritos Fault). Finally, the selected sites for quantifying denudation rates associated with the growth of the SPDP basement anticline are pre-sented together with the cosmogenic nuclide-derived denudation rates, allowing discussion of the influence of denudation processes on inferred tectonic rates.
5.1. Rates of Vertical Incision and Surface Uplift (SE Flank of SPDP, Niquizanga)
At Niquizanga (Figure 4), the Neogene strata plunge roughly 15–20◦toward the east at the toe of the moun-tain range, in conformity with the plunge of the erosion surface cutting the basement rocks. Upward and eastward, the Neogene strata plunge diminishes, leaving only a slight angular unconformity with the over-lying Quaternary alluvial deposits that skirt the mountain piedmont. This alluvial material derived from the SPDP form thin (<3–5 m) sedimentary deposits that overly the Neogene foreland strata exposed within incised cuts of the streambeds and can be arranged into two distinctive groups. The first group consists of alluvial terraces, labeled T1and T2with respect to the present-day streambeds (T0), and a high alluvial unit, labeled HAU in Figure 4. Alluvial terraces T1and T2merge downstream with the bajada to the east of the mountain front. While alluvial terraces T1and T2generally stand less than several meters above T0, the HAU rises more than 50 m above the present-day streambeds (Figure 4). The alluvial terrace T2extends widely and exhibits relatively well-preserved, large boulders and subdued surface features like bars and swales. The second group consists of stepped, thin (<1 m) veneers of proximal alluvial material that have been abandoned and partly notched onto the slope of the mountain range (Figure 4). These alluvial remnants have been labeled upward from T3to T8with respect to the present-day streambed. From T3to the HAU, the surface morphologies consist of deflated stony desert pavements with rare boulders, relatively more frequent cobbles, and well-developed dark rock varnish. Actually, besides the higher degree of dissection characterizing the HAU with respect to the regional T2, nothing much is left on these surfaces to help distinguish them except their respective topo-graphic position relative to the present-day streambeds. Another important observation is that the HAU apparently connects laterally to the mountain range, making it a probable equivalent of the preserved alluvial remnant T7(Figure 4).
To precisely define the chronological framework of this series of alluvial units, we measured the cosmogenic in situ-produced10Be concentrations within boulders and cobbles sampled from the surface of the alluvial T
2 and the HAU, as well as from the alluvial remnants T6and T8. From the alluvial terrace T2, four quartzite boul-ders (PDP41, PDP42, PDP62, and PDP63) and one quartz vein cobble (PDP43) were analyzed (Table 1). Except for the smallest quartz vein cobble, which shows a significantly younger minimum CRE age, all the analyzed boulders agree with an abandonment at roughly 30 ka (Table 1). For these four samples, the weighted mean is 31 ± 3 ka (Figure 4). Even if it cannot be strictly discarded from a statistical point of view, the boulder PDP63 is slightly older, maybe due to some10Be content inherited from previous exposure(s) before its deposition. Excluding PDP43 from the data set (low outlier), and bootstrapping the other CRE ages allows tuning down the contribution of sample PDP63, yielding a mean value of 31 ± 2 ka (Figure 4). From the HAU, two quartz vein boulders (PDP28 and PDP29) and one quartz vein cobble (PDP31) were analyzed and all agree on a weighted mean value of 120 ± 12 ka (Figure 4). Within these three samples, PDP29 seems slightly younger than the oth-ers even if it cannot be excluded from a statistical point of view. Bootstrapping this data population allows tuning down its contribution, yielding a mean value of 132 ± 15 ka (Figure 4). From the alluvial remnant T6, we analyzed two quartz vein boulders (PDP37 and PDP38), one granitoid boulder (PDP39), and one quartz vein cobble (PDP56). This last sample exhibits a significantly higher minimum CRE age of 191 ± 32 ka, prob-ably due to some10Be content inherited from previous exposure(s) before its deposition, whereas the other three samples agree on a abandonment age at roughly 90 ka, with a weighted mean of 87 ± 9 ka and a boost-strap mean of 90 ± 10 ka (Figure 4). From the alluvial terrace T8, two quartz vein boulders (PDP34 and PDP35) exhibit consistent minimum CRE ages of 78 ± 13 and 73 ± 13 ka, respectively (Table 1).
The CRE ages obtained for these different alluvial terraces are relatively consistent and increase with the topographic position of the terraces above the streambed, with the exception of the alluvial remnant T8. Considering the bootstrapped central values of our groups of minimum CRE ages, the alluvial terrace T2was abandoned at 31 ± 2 ka, while the HAU and the alluvial remnant T6were abandoned at 133 ± 15 ka and 90 ± 10 ka, respectively. The younger CRE age derived from the alluvial remnant T8compared to that of T6is
not surprising. This highest alluvial remnant is poorly preserved with rare boulders and cobbles and has prob-ably been reworked by postabandonment processes and/or contaminated by cobbles and boulders derived from the surrounding bedrock. Indeed, if the correlation of the HAU with T7is correct, then T8should be older than 133 ka.
At the outlet of Quebrada Niquizanga, we performed a detailed topographic survey to determine the amount of vertical incision with respect to the present-day streambed (Figure 4). From this data set, the present-day streambed is incised 10 m and 45 m below T2and T6, respectively. Considering that T2and T6were aban-doned at 31 ± 2 ka and 90 ± 10 ka, respectively, these incision values imply rates of 0.3 ± 0.2 mm/yr and 0.5 ± 0.1 mm/yr (Figure 4). The HAU is hanging roughly 50 m above the present-day streambed, which implies an incision rate of 0.4 ± 0.1 mm/yr since it was abandoned at 133 ± 15 ka (Figure 4). All together, these esti-mates agree within their uncertainties, suggesting a fairly constant incision rate through time, with a mean value of 0.4 ± 0.1 mm/yr (R2= 0.95) (Figure 4). Assuming such a constant incision rate allows us to estab-lish a tentative chronological framework for the abandonment of the levels identified as T3, T4, T5, T7, and T8 at 53 ± 4, 66 ± 5, 83 ± 6, 126 ± 10, and 160 ± 13 ka, respectively (Figure 4). The 35 m elevation difference between the surfaces of T2and T6can be regarded as a proxy for surface uplift during the time span between their respective abandonments, which is over 60 ± 7 ka. These elevation and time differences lead to a surface uplift rate of 0.6 ± 0.1 mm/yr.
In summary, along the southeastern border of the SPDP, the landscape evolution seems to be a direct response to the progressive exhumation of the basement above the buried EPF fault, with an incision of the stream net-works at a relatively constant rate of 0.4 ± 0.1 mm/yr. Even if the precise geometry of the EPF is still speculative at depth, the projection of a minimum incision rate of 0.3 mm/yr on a reverse fault plane dipping between 45 and 60◦suggests a minimum fault slip rate of 0.4–0.6 mm/yr, which is a lower bound because fluvial incision might not have reached equilibrium. The upper bound of the incision rate, together with the 0.6 ± 0.1 mm/yr surface uplift rate determined from the differential elevation between T2and T6, suggest the possibility for higher fault slip rates of 0.4–1.2 mm/yr.
5.2. Rates of Vertical Incision and Surface Uplift (Northern Flank of SPDP, Agua Brava)
At Agua Brava, along the northeastern corner of the SPDP (Figures 5 and 6), the alluvial materials form thin
(<3 m) sedimentary deposits that skirt the mountain piedmont, unconformably overlying the Neogene
fore-land strata exposed in incised banks along the stream network. These alluvial terraces can be arranged into four generations based on their topographic positions with respect to present-day streambeds (T0) and are labeled, from younger to older, T1to T4(Figure 5). First, the dissection degree of the different alluvial units increases with their relative topographic positions (Figure 5). Alluvial terrace T1has a well-preserved surface morphology with bars and swales formed by abraded boulders and subangular cobbles and obvious rill-wash features. Relative to the topographic positions, the other alluvial terraces are characterized by diminishing preservation of streambed features together with increasing development of desert pavement and dark rock varnish as well as lack of large boulders. Among the alluvial generations that skirt the piedmont, the three younger ones (T1, T2, and T3) are clearly affected by fault activity, showing increasing escarpment heights with relative age of the alluvial terraces (Figure 6).
To constrain the chronology of the terrace abandonment, we sampled well-preserved cobbles and boulders from atop the alluvial terraces T1, T2, and T3(Figure 5), avoiding areas close to terrace risers or incised gul-lies. Regarding alluvial terrace T3, we sampled the best preserved upstream part of the surface to prevent any complication due to postabandonment processes (Figure 5). The sampling was also performed on both sides of the mainstream to verify isochronicity of the surface (Figure 5). The sample population comprises two boul-ders of dark quartzite (PDP79 and PDP81), one cobble of quartzite (PDP87), one quartz vein cobble (PDP85), and one amalgam of quartz vein pebbles (PDP80). Within their uncertainties, all the samples delivered consis-tent minimum CRE ages and yield a weighted mean age of 41 ± 3 ka. Among these samples, the quartz vein cobble and the amalgam of quartz vein pebbles lead to minimum CRE ages that seem slightly older than the rest of the population (Table 1). For this group of samples, the bootstrap calculation of the mean value yields 43 ± 3 ka for the T3terrace (Figure 6).
On top of terrace T2, we sampled one gneiss boulder (PDP75), two quartzite boulders (PDP76 and PDP78), and one quartz vein cobble (PDP77). Both minimum CRE ages determined for PDP75 and PDP76 agree within their uncertainties, their mean value being 30 ± 4 ka. The quartz vein cobble yielded a much older minimum CRE age of 266 ± 44 ka. Conversely, one of the quartzite boulders (PDP78) delivered a much younger minimum
Figure 6. Agua Brava area (continued). (a) Topographic profiles parallel to the fault (Profiles 1 to 3) and topographic profiles orthogonal to the fault (Profiles 4
and 5). (b) Statistical analysis of CRE ages obtained for the alluvial units (T1, T2, and T3). For each group of samples, outliers are identified (*); weighted mean (wm)
and bootstrap mean (bs) are shown in the form of probability function plots (see also supporting information and section 3). (c) Vertical rates of incision (up) and surface uplift (down) derived from the combination of surface dating and topographic survey.
CRE age of 17 ± 3 ka. The most obvious interpretation regarding the quartz vein cobble PDP77 is that it bears a significant amount of cosmogenic10Be acquired during previous exposure(s) before its deposition on alluvial T2. Regarding PDP78, no clear evidence for postabandonment disturbance was noted in the field. The young age might thus result either from unrecognized postabandonment processes or overbank flooding during Late Glacial Maximum. Without further constraints, we bootstrapped the data population, excluding PDP77, to estimate a conservative mean value of 26 ± 3 ka for terrace T2abandonment (Figure 6).
On top of terrace T1, we sampled one gneiss boulder (PDP71) and three granitoid boulders (PDP70, PDP72, and PDP74). Two samples (PDP71 and PDP74) agree with a CRE age of 7 ± 1 ka, whereas the other two samples are significantly older, yielding minimum CRE ages of 25 ± 5 ka (PDP70) and 14 ± 2 ka (PDP72). One sample (PDP74) was taken on the surface downstream from the topographic escarpment, whereas the other three samples were taken from above it. Thus, one cannot argue that the youngest CRE ages are due to boulders previously shielded and reworked from the degradation of the topographic escarpment. One possible inter-pretation is that the two older boulders are reworked from alluvial materials cannibalized by the alluvium capping alluvial T1during its deposition. Indeed, the minimum CRE ages associated with the samples PDP70 and PDP72 are close to those of the samples measured on T2top. Given the observed dispersion of the min-imum CRE ages, we considered that abandonment age for the alluvial T1can be bracketed between a lower
bound given by the youngest CRE ages (7 ± 1 ka) and an upper bound given by the bootstrapped central value of the whole data population (14 ± 3 ka), which is between 6 and 17 ka.
Using the topographic data acquired in the field (Figure 5), we determined incision values of the present-day streambed along three profiles that are located 150 m (Figure 6, profile 1), 300 m (Figure 6, profile 2), and 500 m (Figure 6, profile 3) upstream of the topographic escarpment. The vertical incision of T0with respect to alluvial terraces T3and T2increases upstream from 12 to 19 m and from 8 to 13 m, respectively (Figure 6). Integrated over the last 43 ± 3 ka and 26 ± 3 ka, these measurements yield vertical incision rates of 0.4 ± 0.1 mm/yr, which are similar to those determined at Niquizanga. Upstream of the topographic escarpment, the alluvial terrace T1is roughly 5 m above the present-day streambed (Figure 6). Considering the fairly large bracketing of terrace T1abandonment (6–17 ka), this height implies an incision rate ranging from 0.3 to 0.8 mm/yr. To determine the topographic height of the escarpment affecting the alluvial terraces T3and T2, we extracted long profiles from the topographic data acquired in the field (Figure 5). The profile for terrace T3crosses well-preserved remnants on both the footwall and the hanging wall and indicates a vertical offset of 27 ± 2 m (Figure 6, profile 4). The profile for terrace T2indicates a vertical offset of 13 ± 1 m (Figure 6, profile 5). Along the same profile, the escarpment for T3is smaller (19 ± 1 m) than that measured on profile 4. However, given that (1) the topographic escarpment tends to diminish toward the eastern tip of the fault, and (2) terrace T3is covered and probably partially eroded by terrace T2downstream of the escarpment, this lower height is con-sistent with that determined using the profile to the west. When combined with the CRE abandonment ages discussed above, the topographic heights determined for T2and T3lead to surface uplift rates of 0.5 ± 0.1 and 0.6 ± 0.1 mm/yr, respectively (Figure 6). The alluvial surface T1is offset 3 m by the Pajaritos Fault (Figure 6). Considering the fairly large bracketing of terrace T1abandonment (6–17 ka), this height implies a surface uplift rate ranging from approximately 0.2 to 0.5 mm/yr.
In summary, local uplift rates estimated from the escarpment heights are similar for terraces T2and T3(over the last 23–46 ka), while the rate seems slightly slower for terrace T1(over the last 6–17 ka). This discrepancy might result from an incomplete upward propagation of coseismic surface ruptures through the very coarse torrential material, which is mainly made of boulders, and/or an insufficiently long time window with respect to the seismic cycle, particularly if a mid-Holocene age is considered. This latter possibility is also suggested by the absence of an obvious knickpoint affecting the streambed profile. Both possibilities may result in a surface displacement deficit for terrace T1. Finally, assuming a simple pure reverse movement on the Pajaritos Fault dipping at (50–60◦), a minimum slip rate of 1.0 ± 0.4 mm/yr can be calculated over the last 23 to 46 ka and of 0.6 ± 0.4 mm/yr for the period postdating terrace T1abandonment (6–17 ka).
5.3. Denudation Rates
To determine denudation rates, we sampled bedrock outcrops located close to the SPDP summit (Cerro Mogote, 3162 m) and along the southeastern border of the range at Niquizanga (Figure 7). The samples comprise quartzite, gneiss, and quartz veins that correspond to the erosional envelope of the fold. The only exception is sample PDP3, which consisted of an amalgam of quartz vein pebbles scattered around the sam-pling site of PDP2. The measured10Be concentrations of samples PDP2, PDP3, and PDP4 samples correspond to maximum denudation rates of 4 ± 1, 6 ± 1, and 11 ± 2 m/Ma, respectively (Table 1). At Niquizanga, the bedrock samples (PDP12a, PDP14a, and PDP50) yielded similar maximum denudation rates ranging from 3.0 ± 0.5 to 5 ± 1 m/Ma. The MSWD analysis identified sample PDP4 as a high outlier with respect to the other bedrock samples (Figure 7). This sample was taken from a patch of bedrock hardly outcropping at the surface, close to the antenna of the meteorological station of Mogote, and may have been affected by more locally active surface processes. With the exception of PDP4, all the bedrock samples converge toward maxi-mum bedrock denudation rates of 4–5 m/Ma. Bootstrapping all the data but PDP4 also yields a central value of 4.5 ± 0.4 m/Ma (Figure 7), which can be regarded as a conservative estimate of maximum denudation rates affecting the bedrock in the area of the SPDP.
To determine spatially integrated denudation rates, we sampled modern river-borne sediments at the out-lets of four watersheds draining the SPDP. Sample PDP10 corresponds to the Quebrada Salinas Grandes watershed, the largest one draining the SPDP to the west, which developed within the Grande El Molle fault zone (Figure 1). Along the northern border, we sampled two watersheds in the area of Agua Brava (PDP20 and PDP84). Along the southeastern border, we sampled the outlet of the quebrada draining the SPDP at Niquizanga (PDP32). The catchment-wide denudation rates are 65 ± 11 m/Ma (PDP10), 42 ± 7 m/Ma (PDP32), 110 ± 25 m/Ma (PDP20), and 109 ± 18 m/Ma (PDP84) (Table 1). As such, it appears that catchment-wide
Figure 7. Cosmogenic nuclide-derived denudation rates for Sierra Pie de Palo. (a) Landsat image of the SPDP locating (1) the two bedrock sampling sites (blue solid circles) at Cerro Mogote (3162 m) on top of the surface and at Niquizanga on the southeastern flank of the range, respectively, and (2) the watershed outlets where river-borne sands were sampled (red solid circles, watersheds are highlighted in light red). (b) Field photographs of the sampling site at Cerro Mogote (upper left: PDP2-3; upper right: PDP4) and Niquizanga (lower left: PDP12a; lower right: PDP14a). (c) Statistical analysis of denudation rates obtained for the bedrock samples. Outliers are identified (asterisk); weighted mean (wm) and bootstrap mean (bs) are shown in form of probability function plots (see also supporting information and section 3).
denudation rates could be as much as 30 times higher than bedrock denudation rates. Located along the active northern border of the SPDP, samples PDP20 and PDP84 exhibit the highest catchment-wide denuda-tion rates, which is not surprising because their watersheds are more likely to be more rapidly uplifted. When compared to PDP84 and PDP20, sample PDP10 exhibits a catchment-wide denudation rate that is roughly 30% lower. Another interesting feature is that northern watersheds’ catchment-wide denudation rates are apparently not different, whereas the watershed of PDP84 is roughly 4 times larger than that of PDP20 (Table 2). Finally, located along the southeastern border of the SPDP, sample PDP32 exhibits the lowest catchment-wide denudation rate. The difference between the high catchment-wide denudation rates deter-mined along the northern border and that of the PDP32 watershed along the southeastern border might well reflect a difference in tectonic activity between the two areas.
Table 2. Excavation Times Estimated From Cosmogenic Nuclide-Derived Denudation Rates (Measured
Watersheds)a
Volume (Surf-SRTM) Area Ratio V/S Denudation (m/Ma) Excavation Time (Myr)
(km3) (km2) (km) Value Error Value Error
PDP10 15.9 82.7 0.19 65 11 3.0 0.5
PDP20 0.2 2.5 0.08 110 25 0.7 0.2
PDP32 0.4 10.0 0.04 42 7 0.9 0.1
PDP84 1.2 13.7 0.09 109 18 0.8 0.1
aMinimum eroded volumes are estimated subtracting the present-day topography (SRTM DEM) to
the surface envelope model (Figure 2) according to Champagnac et al. [2014]. Watershed areas have been extracted from the digital elevation model (SRTM DEM) using RivertoolsTM software. Denuda-tion rates correspond to cosmogenic nuclide-derived estimates, and excavaDenuda-tion times are determined assuming that denudation rates are constant with time.
5.4. Influence of Denudation Rates on Inferred Tectonic Rates
In situ-produced10Be concentrations measured in boulders or cobbles deposited onto the surface of alluvial terraces have been interpreted as minimum exposure ages assuming rapid exposure and no burial or erosion after the beginning of the exposure. As described in sections 5.1 and 5.2, most of the studied alluvial sur-faces exhibit the characteristics of deflated stony desert pavements through winnowing with well-developed desert varnish. If the sampled boulders were deposited at the surface of the alluvial terraces during the last alluviation episode before abandonment, they should have remained fully exposed to cosmic rays, even dur-ing surface lowerdur-ing through deflation of the fine materials and compaction of the alluvial material. The denudation rates of about 4–6 m/Ma derived by Hedrick et al. [2013] from two cosmogenic concentration depth profiles within alluvial materials in the Eastern Precordillera actually estimate such a surface lowering rate. Within this context, the denudation processes affecting the exposed boulders themselves should still be regarded as negligible. However, if a denudation rate of about 4–6 m/Ma is considered to be active on the boulders themselves, then those showing CRE ages of roughly 30 ka should be roughly 10% older, those with CRE ages of 40–60 ka should be roughly 15–20% older, and those with CRE ages older than 70–90 ka should be 30–40% older. Under such an assumption, the samples showing CRE ages older than ≈140 ka appear saturated from the cosmogenic nuclide production point of view (see supporting information). Finally, the tectonic rates should be lowered by a factor of about 15% under the assumption that a denudation rate of roughly 5 m/Ma applies to the cobbles and boulders themselves.
6. Discussion
6.1. The Pampean Paradox
In the western SP, there is a paradox between the lack of Cenozoic cooling ages and the structural reconstruc-tions and basin analyses that suggest several kilometers of exhumation [Dávila and Carter, 2013]. Neogene to Quaternary evidence for tectonic activity associated with the Pampean thrusts is described by Costa et al. [2000], Ramos et al. [2002], Richardson et al. [2013], and this study. For example, to the north of the NPF, the first 10 km below the surface corresponds to the Neogene units of the Bermejo foreland basin [Zapata, 1998]. Therefore, there is a maximum structural relief of about 13 km, assuming that the summit of SPDP was at the same topographic datum as the bottom of the Bermejo basin at the beginning of the Neogene sedimentation [Smalley et al., 1993].
On the other hand, the exhumation of the Pampean ranges have long been studied using multiple ther-mochronometric methods, including apatite and zircon fission tracks, (U-Th)/He, and zircon U-Pb [Jordan et al., 1989; Coughlin et al., 1998; Sobel and Strecker, 2003; Carrapa et al., 2008; Löbens et al., 2011, 2013a, 2013b; Enkelmann et al., 2014]. In the westernmost SP, no Cenozoic cooling ages have been reported [Jordan et al., 1989; Coughlin et al., 1998; Löbens et al., 2011, 2013b], contrasting with the northern Pampean ranges, where the most recent exhumation episode started during the Miocene and the Pliocene [Sobel and Strecker, 2003; Carrapa et al., 2008]. In the case of the SPDP, Löbens et al. [2013b] used apatite fission track data and (U-Th)/He measurements of zircon and apatite and proposed that its final cooling and exhumation possibly started


![[PDF] Créer Bulletin de paie avec Excel PDF](data:image/gif;base64,R0lGODlhAQABAIAAAP///wAAACH5BAEAAAAALAAAAAABAAEAAAICRAEAOw==)