HAL Id: hal-01713901
https://hal.archives-ouvertes.fr/hal-01713901
Submitted on 13 Dec 2018
HAL is a multi-disciplinary open access
archive for the deposit and dissemination of
sci-entific research documents, whether they are
pub-lished or not. The documents may come from
teaching and research institutions in France or
abroad, or from public or private research centers.
L’archive ouverte pluridisciplinaire HAL, est
destinée au dépôt et à la diffusion de documents
scientifiques de niveau recherche, publiés ou non,
émanant des établissements d’enseignement et de
recherche français ou étrangers, des laboratoires
publics ou privés.
Kinetic Modeling of the Polychloroprene Pyrolysis
Under Nitrogen Atmosphere
Yannick Soudais, Cristina Serbanescu, Florent Lemont, Jean-Claude Poussin,
Gheorghe Soare, Grigore Bozga
To cite this version:
Yannick Soudais, Cristina Serbanescu, Florent Lemont, Jean-Claude Poussin, Gheorghe Soare, et al..
Kinetic Modeling of the Polychloroprene Pyrolysis Under Nitrogen Atmosphere. Waste and Biomass
Valorization, Springer, 2011, 2 (1), pp.65-76. �10.1007/s12649-010-9054-2�. �hal-01713901�
Kinetic Modeling of the Polychloroprene Pyrolysis
Under Nitrogen Atmosphere
Yannick Soudais•Cristina S¸erba˘nescu• Florent Lemont •Jean-Claude Poussin• Gheorghe Soare• Grigore Bozga
Abstract In the present work it was performed the pyrolysis of polychloroprene (produced by Aldrich) in two types of experimental apparatus differentiated by the sample size they could work with. The first experimental device was a TG-DTA analyzer and the second one was a higher capacity thermo-balance placed inside a furnace (so-called ‘‘Aubry’’). The experimental conditions were the following: temperatures up to 1,000!C and atmospheric pressure (1 bar), atmosphere of flowing nitrogen, three different heating rates (5, 10 and 15 K/min for the ‘‘Au-bry’’ furnace and 10, 20 and 30 K/min for the TG-DTA) and two different quantities of samples (10 g for the first set-up and 10 mg for the second one). The mass loss of solid samples showed similar time evolutions for both devices. It indicated a first period of dehydrochloruration in the temperature range 300 - 400!C followed by the pyro-lysis of intermediary products in the temperature range 400–550!C yielding gaseous and liquid volatiles fraction and a black carbonaceous char. Two kinetic models from literature were tested in order to describe the weight loss kinetics of polychloroprene during the pyrolysis process: an empirical one which considered three organic fractions decomposing separately and a more detailed one involving 191 reactions and 38 species (molecules and radicals). It
was found that for the TG-DTA experiments both models are appropriate while for the ‘‘Aubry’’ furnace it would be necessary to use a modified kinetic model which takes into account the heat transfer.
Keywords Polychloroprene! Pyrolysis ! Kinetic
Introduction
The plastic materials from wastes represent a danger for the environment because they are not biodegradable. For example, the nature takes 100–1000 years to degrade a plastic bottle. Among the waste treatment techniques used nowadays (recycling, material valorization, energetic val-orization, composting) the incineration is the most impor-tant one for wastes with polymeric structure in Europe. This one is considered more and more inadequate due to the toxic nature of the compound released i.e. dioxins or polycyclic aromatic hydrocarbons. Thus, the pyrolysis, as a solid waste processing technique started to be in the recent years a real alternative to the incineration of solid wastes [1]. It is preferred because of its environmental friendlier character and its potential of material and energy savings (monomers for the chemical industry, combustible gases and oils, high calorific power char).
Polychloroprene
Structure and Properties of Polychloroprene
The polychloroprene is a polymer that can be found in an important number of solid wastes (cables insulation, gloves, transmission belts etc.). Nowadays it is obtained by Y. Soudais! C. S¸erba˘nescu (&) ! J.-C. Poussin
Ecole des Mines d’Albi-Carmaux, ‘‘RAPSODEE’’ Center, Albi, France
e-mail: crst28@gmail.com F. Lemont
Comisariat d’Energie Atomique, Albi, France G. Soare! G. Bozga
Faculty of Applied Chemistry and Materials Science, ‘‘Politehnica’’ University of Bucharest, Bucharest, Romania
radical emulsion polymerization of chloroprene (2-chlor-1,3-butadiene) [2] when a stereospecific 1–4 structure is obtained. However, other different structures are to be found in its final structure (see Fig. 1) [2–4]. Generally speaking, polychloroprene (CR-‘‘chloroprene rubber’’, Neoprene) is and will remain an important elastomer due to a favorable combination of technical properties.
Polychloroprene Pyrolysis
Generally, the polychloroprene pyrolysis was studied by the thermogravimetric technique using different types of experiments on TG-DTA analyzers: only dynamic runs [5–
7], dynamic and isothermal runs [7] or only isothermal runs [5] under nitrogen, He [6] or a mixture of air and nitrogen [7]. The mass sample was very small: 4–5 mg [6,7], 1.5 g [8] and even ca. 10lg [9]. The samples prepared in presence of air are less stable than the ones prepared in its absence [10]. For the experiments made the authors always neglected the heat transfer.
There are two main degradation steps during polychlo-roprene pyrolysis: firstly a dehydrochlorination between 200 and 350!C [5–9] and secondly the depolymerization. For the commercial polychloroprene there are three mass loss intervals during its thermal degradation, the first one corresponding to the additive degradation [6,7].
The dehydrochlorination step is considered to follow a non radical intramolecular mechanism [8]. There are three steps mentioned in literature for the dehydrochlorination stage. An explanation given is that this phenomenon is due to different monomer structures existing within the poly-mer chain. Two mechanisms may be responsible for this process [9]: an intramolecular reaction with re-arrange-ments or a reaction of the active zones of the polymer which don’t participate 100% to the process. For the
neoprene, i.e. a polychloroprene with predominant 1,4-trans structure, the dehydrochlorination step is assumed to be initiated at the structural defects of the polymer chain. These defects are represented by the 1,2 units which are less stable due to the presence of the most labile chlorine i.e. chlorine bonded to a tertiary carbon [7]. It is important to mention that the hydrogen chloride evolved from this degradation step has not a catalysis role [11].
The second degradation step (temperatures higher than 450!C) is due to condensation reactions and other chemical transformations i.e. the decomposition and dealkylation of the condensed structures.
The quantities of products obtained expressed in weight percentage relative to the sample are usually 20% for the ‘‘char’’ (solid residue) [5–8] and around 35% for the hydrogen chloride [5]. From the FT-IR spectrum of a char obtained from polychloroprene pyrolysis at 400!C in a TG-DTA analyzer it was found that, on average, it has a structure of tri-substituted phenyl rings but also 12 or more double bonds in conjugation [12].
Polychloroprene Pyrolysis Kinetic Models
There is a broad literature regarding the mathematical modeling of polymer pyrolysis, in order to predict the time dependence of solid weight as well as the nature of solid and gaseous products, see for example [13]. Usually the mathematical models were obtained by fitting the experi-mental data with different kinetic expressions, more or less empirical [14–16].
The parameter estimation of a mathematical model for a given process aims to obtain in each experimental point, values for the dependent variable (y) as near as possible the experimental ones (yobs) [17]. In this purpose, the estimator most commonly used in literature is the least squares method, for example in [6].
Due to the particularities in the working conditions, a comparison between the results published by different scientists is difficult these being highly dependent on the experimental conditions used in each case.
Experimental study Materials
The material used was pure Polychloroprene (Sigma– Aldrich) with a structure of 85% trans and 10% cis. The rest of 5% is of an unknown structure, as the producer affirms. The product is typically delivered as ‘‘chips’’ with a density of about 1.23 g/cm3. It is considered to be a pure polychloroprene i.e. without additives included. It is a white material with elastic properties.
C C H Cl C C H2 H2 * * n 1 4 C C Cl H C C H2 H2 * n* 1 4 * C H2 C Cl CH CH2 * n 1 2 * C C H H2 C Cl CH2 * n 3 4 a b c d
Its chemical composition was determined by the com-plementary technique of elemental analysis. It was deter-mined by this technique the volume percentage of C, H, S and N with a ‘‘NA 2100 Protein’’ instrument (‘‘Thermo Finnigan’’). The results are shown in Table1. As it can be seen the measured percentages are in very good agreement with calculated ones and literature [18].
The gaseous reagent was pure nitrogen (0.8 wt% O2). Experimental Apparatus
The thermogravimetric experiments were performed in two apparatus: (a) a TG-DTA analyzer (‘‘Setaram’’, model ‘‘ATG-ATD 92’’) coupled, in some of the runs, to a FT-IR (‘‘Perkin Elmer’’, model ‘‘System 2000’’) with role in monitoring the gases evolved and (b) a larger scale set-up based on a thermobalance having the plateau mounted inside an electrically heated furnace called ‘‘Aubry furnace’’. Both devices were equipped with a thermobalance as an essential element for this study. In neither cases the material of the crucible didn’t catalyze nor react with the sample.
The TG-DTA analyzer was a laboratory-scale furnace provided with a graphite resistance. The instrument had the following characteristics: a cylindrical vertical furnace of high temperature (1,750!C), 30 K/min maximum heating rate, an electronic microbalance (20 mg maximum weight and 1 lg the limit of detection), possibility of coupling with an FT-IR analyzer by a heated line (200!C) and all the logistic material necessary for registering the experimental results. The furnace was cooled by a water circuit. The nitrogen entered firstly into the microbalance and after-wards into the furnace in order to assure an inert atmo-sphere necessary for the balance. The crucibles used were platinum made ones of small capacity (0.1 ml).
The ‘‘Aubry’’ furnace was a pilot-scale furnace provided with Super Kanthal electrical resistances. The instrument had the following characteristics (see Fig. 2): a cylindrical vertical furnace of high temperature (1,600!C), 34 K/min maximum heating rate at low temperatures (1,100!C), a thermobalance (6,100 g maximum weight and 0.1 g the
limit of detection) and a capacity of 8 l. The thermobalance was placed in the lower part of this device. The nitrogen entered the furnace by two openings, one feeding the gas inside the furnace and the other keeping an inert atmo-sphere around the arm of the balance. Unfortunately, even with these precautions, there was a small amount of O2 (*4% vol) present in the gaseous mixture inside the reaction chamber, due to imperfect sealing of the opening around balance arm. For this reason further oxidation of the residue is to be expected with this device.
Experimental Conditions
The experimental conditions were differentiated by the device’s scale as can be seen in Table2. The experiments carried out were dynamic ones from room’s temperature to 1,000!C in both devices. The sample was previously cut Table 1 Elemental analysis of pure polychloroprene from
‘‘Sigma-Aldrich’’ Composition %Weight measured %Weight calculated %Weight literature [18] C 54.5 ± 10.1 54.2 54.0 H 6.2 ± 0.6 5.7 5.8 S 0 0 0 N 0.038 ± 0.09 0 0 Autres (O, Cl) 39.3* 40.1 39.8 Total 100 100 *100 * By difference 155 mm 100 mm 85 mm 40 mm 40 mm 230 mm Ø210 mm 155 mm 100 mm 85 mm 40 mm 40 mm 230 mm Ø210 mm a b
Fig. 2 The ‘‘Aubry’’ furnace’s chart: a schema of elements of the furnace: 1-electrical resistance, 2-platinum thermocouple, 3-charger of the balance, 4-chimney, 5-balance, 6-crucible, b furnace nitrogen entries: 1-furnace, 2-balance
into powder. This represents a dimension small enough to assume that any thermal effect could be neglected in the case of the TG-DTA analyzer experiments.
The temperature was not the theoretical one which was assigned to the thermobalance but a temperature recorded in different manners for the two cases considered: (a) for the TG-DTA it was measured just under the crucible with sample and (b) for the ‘‘Aubry furnace’’ it was measured with a thermocouple placed at about 80 mm above the crucible with sample.
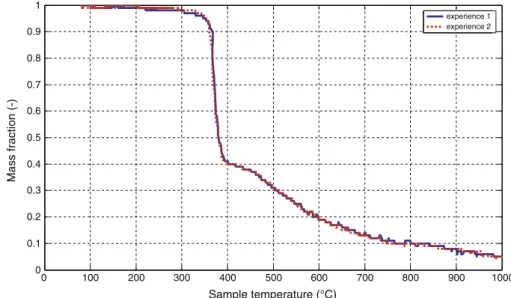
The buoyancy effect of the carrier gas in each thermo-balance was eliminated by subtracting the blanks for each run. The experimental data presented in this paper for the ‘‘Aubry’’ furnace are usually the mean values for runs performed twice and the results obtained for the duplicates were very similar in all the cases (see Fig.3). A maximum error of 2% was estimated in the measurements performed in the case of highest heating rates used in the ‘‘Aubry’’ furnace. For the TG-DTA analyzer the reproducibility [14] was very good so only one run was performed each time. Results and Discussions
Figure 4 show the variation of experimental weight loss with temperature. The curves are obtained at different heating rates for runs performed in both devices. As
expected, an increase in the heating rates produces a shift of the decomposition curve toward higher temperatures [19] and a decrease of the quantity of char obtained [8]. This observation is true for the results obtained on both devices. It can be also observed that the experimental curve obtained in the ‘‘Aubry’’ furnace is rather different from the one obtained in the TG-DTA analyzer. A possible explanation may be the heat transfer limitation and the higher error in the measurement of working temperature.
Thus the experimental results in the ‘‘Aubry’’ furnace were affected by noise. Figures5 show the results of fil-tering the experimental results of the mass loss and of temperature by the Savitzky-Golay algorithm (the filtered value, at any time, represents a fitting of certain number of points placed in the vicinity of a given point).
The TG analysis of the pure polychloroprene pyrolysis gives a curve with three main mass loss intervals for the results obtained in the TG-DTA analyzer and with four main mass loss intervals for the ‘‘Aubry’’ furnace (see Fig.4a, b). This is in agreement with literature which mentions a mass loss of two stages [5–9] and three stages only for the dehydrochlorination [9]. The derivatives of experimentally measured thermogravimetric (DTG) curves are presented in Fig.4a. As it can be seen, an increase in the heating rate produces a modification in the DTG curve. This is the reason why at 10 K/min the last two processes (B and C) are well differentiated, at 20 K/min there is a partial superposition of these decomposition steps and finally at 30 K/min there is nearly only one decomposition process that appears. Also it can be seen that the first degradation step doesn’t give a DTG peak. Table3 gives all the information read on the TG and DTG curves. From the DTG ones it can be seen that the mass loss that occurs during the second decomposition step (Process B) is larger and faster than the ones observed during the other steps Table 2 Experimental conditions for polychloroprene pyrolysis in
our work
Experimental conditions Aubry furnace TG-TDA
Initial mass of sample 10 g 10 mg
Temperature interval (!C) 25–1000 25–1000
Nitrogen flow 10 l/min 50 ml/min
Heating rate (K/min) 5, 10, 15 10, 20, 30
0 100 200 300 400 500 600 700 800 900 1000 0 0.1 0.2 0.3 0.4 0.5 0.6 0.7 0.8 0.9 1 Sample temperature (°C) Mass fraction (-) experience 1 experience 2 Fig. 3 Duplicated runs in the
0 100 200 300 400 500 600 700 800 0.1 0.2 0.3 0.4 0.5 0.6 0.7 0.8 0.9 1 Temperature (°C) Mass fraction (-) 10 K/min 20 K/min 30 K/min 100 200 300 400 500 600 700 800 -20 -15 -10 -5 0 Temperature (°C)
Mass derivative (%/min)
100 200 300 400 500 600 -10 0 10 20 30 40 Temperature (°C) DTA signal (µV) A A A B B B C C C DTG DTG DTA exo 0 200 400 600 800 1000 1200 0 0.1 0.2 0.3 0.4 0.5 0.6 0.7 0.8 0.9 1 Temperature (°C) Mass fraction (-) 5 K/min 10 K/min 15 K/min A B C D 100 200 300 400 500 600 700 800 900 1000 0.1 0.2 0.3 0.4 0.5 0.6 0.7 0.8 0.9 1 Temperature (°C) Mass fraction (-)
10 K/min, Aubry furnace 10 K/min, TG-ATD A B C D a b c Fig. 4 Experimental results
(our work) for polychloroprene pyrolysis: a TG-DTA analyzer at 10, 20 and 30 K/min , b ‘‘Aubry’’ furnace at 5, 10 and 15 K/min, c comparison between experimental results obtained in the two types of devices
(Processes A and C) [9]. At higher heating rates, the second mass loss step is slower and the third one becomes almost invisible. The DTA curves confirm the existence of double bonds in the material’s structure which are responsible for the exothermic effects observed (Processes B and C) [6].
The second mass loss corresponds also to the chlorine loss (dehydrochlorination). As already mentioned above, the polychloroprene has a good thermal stability, beginning to decompose around 200–300!C. This result is evidenced from the FT-IR spectrums presented in Fig. 6 which give the intensities of evolved gases during polychloroprene pyrolysis. The HCl spectrum is delimited between 2,500 and 3,100 cm-1which are representative frequency values for this gaseous product. The process is delimited between 300 and 400!C but it continues until a temperature of 500!C in parallel with the evolution of other gases.
The stoichiometry of the first degradation step can be described by the Eq. 1below:
ðC4H5ClÞn ! 0:1ðC4H4ClÞnþ 0:9nHCl þ 0:9ðC4H4Þn
ð1Þ This equation considers that 90% of the chlorine atoms found in the initial sample are lost as HCl during this step [8,10,11].
This dehydrochlorination process corresponds to a mass loss calculated by the following relation: Dmð%Þ ¼ 1000:9 MHCl
Mmonomere¼ 38: The result is in agreement with the with literature (35–37%) [5] and slightly inferior with our results (43% in the TG-DTA for 10 K/min). The temper-ature ranges of the dehydrochlorination step specified in literature are the same as those in our work [5,7–9].
The amount of char obtained in the TG-DTA analyzer is higher than the one obtained in the ‘‘Aubry’’ furnace (see Table3). This phenomenon is due to the presence of oxygen in the furnace which consumes the carbonaceous
0 5 10 15 20 25 30 35 -0.4 -0.35 -0.3 -0.25 -0.2 -0.15 -0.1 -0.05 0 Time (min) Mass loss (g) experimental curve filtered curve
a
b
0 5 10 15 20 25 30 35 -50 0 50 100 150 200 250 300 350 Time (min) Furnace temperature (°C) experimental curve filtered curve Fig. 5 Results of filtration ofthe experimental results for the runs effectuated in the ‘‘Aubry’’ furnace at 10 K/min, the first mass loss for process A: a filtration of experimental data for the mass loss, b filtration of experimental data for the temperature
residue formed during the pyrolysis process. Also there is a difference between the amounts of chars obtained at dif-ferent heating rates for the same experimental device: for both devices an increase in the heating rate produces a higher amount of carbonaceous char.
Mathematical Modeling of the Process Empirical Kinetic Model
A simplified scheme of the pyrolysis process was proposed by Caballero et al. [6] considering three organic fractions in the structure of the material, with different kinetic par-ticularities, as well as an inert fraction (I). Each organic fraction (F) decomposes into volatiles (G) as it can be seen in Scheme1.
In a thermogravimetric experiment it is impossible to differentiate between the non-decomposed fraction of the initial product and the solid residue (‘‘char’’) formed. Such an experiment gives information only about the global weight loss. For this reason we used the same approxi-mation as Caballero and al i.e. we assumed that the inert, ‘‘I’’, designates the inorganic fraction of the initial polymer and the solid residue. The first two mass losses assumed by
this model are considered to be due to the
dehydrochlorination.
The model represents the time dependence of the mass loss by the power law expressions:
dFi dt ¼ &ki! F ni i i ¼ 1; 2; 3 ð2Þ t ¼ 0; Fi¼ wi0 w10þ w20þ w30þ I ¼ 1 ð3Þ
The temperature dependences of reaction rate constants, ki, are considered of Arrhenius type:
kiðTÞ ¼ k0i exp &
Ei
RT ! "
¼ kr;i exp &
Ei R 1 T & 1 Tref ! " # $ ; kr;i¼ kiðTrefÞ ð4Þ The last expression is often used in order to diminish the correlation that exists between the estimated values of Ai and Ei. In this expression, Tref is usually taken as the average of the working temperature interval.
The mathematical calculations have been done using the software Matlab 7.0 (the functions lsqcurvefit and ode). The pyrolysis simulation results obtained with the kinetic parameters given by Caballero et al., do not agree Table 3 Polychloroprene pyrolysis results
Instrument Heating rate
(K/min) Degradation step Ti(!C) Tmax(!C) Tf(!C) DTGmax (%/min) Dm (wt %) Dmchar (wt %) TG-DTA 10 Process A 190 – 304 – 5.0 18.0 Process B 304 370 404 -8.0 43.0 Process C 404 455 574 -3.9 33.0 20 Process A 245 – 325 – 5.0 20.0 Process B 325 380 426 -13.3 48.0 Process C 426 467 588 -6.1 27.0 30 Process A 265 – 345 – 5.0 20.0 Process B 345 389 436 -16.9 49.0 Process C 436 483 611 -6.9 26.0 ‘‘Aubry’’ furnace* 5 Process A 182 – 318 – 5.0 0 Process B 318 – 365 – 50.0 Process C 432 – 622 – 24.0 Process D 622 – 1000 – 14.9 10 Process A 194 – 354 – 5.0 4.5 Process B 354 – 380 – 44.0 Process C 458 – 700 – 24.0 Process D 700 – 1000 – 7.5 15 Process A 302 – 359 – 3.0 9.0 Process B 359 – 409 – 51.0 Process C 450 – 678 – 21.0 Process D 678 – 1000 – 10.4
Fig. 6 The FTIR spectrums of HCl in gaseous form: a evolved gas spectrum in our work showing the beginning of the formation of HCl for a pyrolysis at 30 K/min (316!C), b evolved gas spectrum in our work showing the end of the formation of HCl for a pyrolysis at 30 K/min (411!C),
satisfactorily with our experimental data. This can be explained by the differences existing in the working con-ditions and the initial material composition. Consequently we fitted the parameters of the same model to our experi-mental results.
There were three parameters to be optimized for each fraction of solid: the pre-exponential factor, the activation energy and the reaction order (9 parameters in total). Besides the nine parameters model presented above, we also tested simplified versions, considering a lower number of solid fractions or, correspondingly, a smaller number of parameters. The results for the data obtained using TG-DTA analyzer at 10 K/min are the best obtained and are shown in Fig. 7. As it can be seen the nine parameter model with three fractions decomposing simultaneously is in good agreement with the experi-mental data. The results, presented in Table4 show that for the case of 10 K/min the correlation with literature values is good for the case of nine parameters, or three fractions decomposing simultaneously. For the case of two fractions, the results are not good, seen the value of the reaction order (1.6 9 10-14). For the case of one fraction the value founded is not very good, seen the value of the reaction order which is twice bigger than the literature.
In the case of the ‘‘Aubry’’ furnace the results are not very good even after optimizing the model. They were not given because they are very wrong. An explanation may be due to the heat transfer that cannot be neglected for this experimental device.
Radical Kinetic Model
The true reaction mechanism of the pyrolysis process is involving formation and consumption of organic radical species. Therefore, a more realistic process model should explain the transformation of the initial polymeric struc-ture to the final products, by the intermediate of radical reactions. A kinetic model of this type was proposed by Faravelli et al. [5]. Accordingly, as seen in the Appendixes A and B of this article [5], the thermal decomposition of the polychloroprene takes place by 191 elemental reac-tions that involve 38 species (molecules and radicals). The chemical species are polymer segments, placed between the brackets, and also reaction products having well known chemical structures. The reactions considered in
the atomic balance calculations involve all these 38 spe-cies. It is important to mention, as the authors also do [5], that the polymer rest called ‘‘P’’ has no significance for the atomic balance. This rest has only the purpose of an indication of the phase; more precisely the presence of ‘‘P’’ indicates melt phase specie while its absence indi-cates gas species. The initial specie is the monomer formed in the first reaction (R1), the chloroprene radical ð _CC ¼ CClCÞ & P: Other hypothesis for this model are as follows: the melting mass decreases continuously while gases are formed, the solid residue (‘‘char’’) and the inert fractions remain in the reaction mixture, the reactions are considered elementary (the reaction orders equal to molecularities) and the reaction rates are expressed by power law expressions. The time dependencies of con-centrations (mass fractions) in the melt mixture are given by the mass balance equations:
dwj
dt ¼ Mj
qam
! vRj; ½s&1(; j ¼ 1. . .38 ð5Þ where: wj¼mmjðsÞ0j; the mass fraction [adim]; mj (s) = the mass of the specie j at moments and m0j= the initial mass of the specie j; Mj= the molecular mass of the specie j; qam= the density of liquid polychloroprene (considered 1,340 g/ml).
vRj¼ P191
i¼1ðtij! VRiÞ; the reaction velocity [mole/l s]
for every specie j = 1…38 of the system of i = 1…191 reactions; tij = the stoechiometric matrix of the reaction system. VRi¼ k0iTbie& Eatti R T wn 0 i
j ; the rate of reaction i, [mole/l s];
k0i= the pre exponential factor [s -1
], Eatti = the activa-tion energy [J/mole]; n0
i = the reaction order [adim];
bi = a temperature coefficient [adim];
T ¼ T0þ b ! t; the temperature [!C]; b = the heating
rate [K/s], t = the time [s].
The values of the pre exponential factor Ai, the activa-tion energy Eattiand of the coefficient biare those given in the article of Faravelli, Appendix B [5].
Nevertheless, the kinetic model of Faravelli was mod-ified in order to obtain correct mass balances. The coef-ficients for all the 191 equations of the proposed model were recalculated in order to fulfill the atomic balances on each reaction. Also there was a specie that could not be found in the equations of Appendix B and that was replaced by another which was present in these equations but absent in the list of Appendix A. It is the case of the specie P& ð _C10H8ClÞ & P from Appendix A that was
replaced by the specie P& ð _C8H8ClÞ & P found in
Appendix B. The mathematical treatment consisted in fitting the experimental data to the model by the Matlab function ‘lsqcurvefit’. The results for TG-DTA analyzer
F
iG
i,
i=1,2,3
I
I
Scheme 1 F organic fraction of the initial polymer, G gases formed, I inert fraction of the initial polymer [6]
0 100 200 300 400 500 600 0.1 0.2 0.3 0.4 0.5 0.6 0.7 0.8 0.9 1 Temperature (°C) Mass fraction (-) experimental curve simulated curve 100 200 300 400 500 600 0.1 0.2 0.3 0.4 0.5 0.6 0.7 0.8 0.9 1 Temperature (°C) Mass fraction (-) experimental curve simulated curve 100 200 300 400 500 600 0.1 0.2 0.3 0.4 0.5 0.6 0.7 0.8 0.9 1 Temperature (°C) Mass fraction (-) experimental curve simulated curve
a
b
c
Fig. 7 Results of themathematical modeling with the empirical kinetic model for runs in the TG-DTA analyzer at 10 K/min: a considering one fraction and three optimization parameters, b considering two fractions and six optimization parameters, c considering three fractions and nine optimization parameters
experiments at 10 K/min are presented in the Fig. 8. As it can be seen this model offers a good correlation with experimental values but not better than the three fractions one presented above.
Comparison Between the Two Models Considered The three fraction model is a very versatile one which reproduces well the runs performed at different heating rates and even isothermal runs [5]. It gives a good repre-sentation for the mass loss.
The radical model is also good and versatile in describing the char and gases formation. It offers a more detailed model for the process. Thus offers a better explanation of the insights of this pyrolysis process.
The first kinetic model has the advantage of simplicity but the disadvantage of great generality. The second one offers better qualitative results but his major disadvantage is his great complexity.
An optimal kinetic model will be a combination between the two-ones proposed. This more appropriate model was not an objective of the present work.
Conclusions
Pure neoprene pyrolysis under nitrogen atmosphere was realized in two experimental devices differentiated by the capacity of sample that they could work with. The present study approached only the weight loss kinetics of the solid during polychloroprene pyrolysis. For the TG-DTA device there were two literature kinetic models tested. It was found that the model with three fractions which decompose independently has the advantage of simplicity but the dis-advantage of a great generality while the second one offers better qualitative results but his major disadvantage is his great complexity. An optimal kinetic model will be a combination of the two-ones tested in this work. For the case of the ‘‘Aubry’’ furnace it was found that the kinetic models where not adequate. For this device it is necessary to take into account also the heat transfer phenomenon and the presence of oxygen. Further studies are necessary in order to identify the physico-chemical mechanism of the pyrolysis process and to improve the kinetic model struc-ture. More detailed experimental runs could help in founding a more precise kinetic model especially if there could be possible to monitor the evolved gas evolution. Table 4 Optimized values for the kinetic parameters of the empirical model at 10 K/min (the three fractions model)
No fractions Paramètrecinétique F.O . A1 (min-1) E1 (kJ.mol-1) n1 A2 (min-1) E2 (kJ.mol-1) n2 A3 (min-1) E3 (kJ.mol-1) n3 1 2,4 × 10¹³ 160,0 4,3 - - - - - - 0,309 2 1,7 × 10⁷ 97,2 1,6× 10⁻¹⁴ 3,9 × 10¹² 152,4 4,8 - - - 3,315 × 10-2 0,286 3 3,4 × 10²⁰ 99,1 3,8 3,2 × 10⁷ 37,0 0,3 2,7 × 10¹⁰ 153,3 0,9 3,52 × 10⁻³ 0,309 0,792 0 100 200 300 400 500 600 700 800 0.1 0.2 0.3 0.4 0.5 0.6 0.7 0.8 0.9 1 1.1 Temperature (°C) Mass fraction (-) experimental curve simulated curve Fig. 8 Results of simulation for
the thermal degradation of polychloroprene in the TG-DTA analyzer at 10 K/min (the radical kinetic model)
References
1.http://www.techniques-ingenieur.fr/dossier/dechets_et_risques_ pour_la_sante/G2450
2.http://www.iisrp.com/WebPolymers/04FinalPolychloropreneIISRP. pdf
3. Encyclopedia of polymer science and technology. Wiley, USA (2005)
4. Locatelli, Jean-Louis, ‘‘Techniques de l’inge´nieur’’, traite de «ge´nie des proce´de´s», J6530
5. Mehl, M., Marongiu, A., Faravelli, T., Bozzano, G., Dente, M., Ranzi, E.: A kinetic modeling study of the thermal degradation of halogenated polymers. J. Anal. Appl. Pyrolysis 72, 253–272 (2004)
6. Caballero, J.A., Conesa, J.A., Martin-Gullon, I., Font, R.: Kinetic study of the pyrolysis of neoprene. J. Anal. Appl. Pyrolysis 74, 231–237 (2005)
7. Aracil, I., Font, R., Conesa, J.A., Fullana, A.: TG-MS analysis of the thermo-oxidative decomposition of polychloroprene. J. Anal. Appl. Pyrolysis 79, 327–336 (2007)
8. Dick, C.M., Liggat, J.J., Snape, C.E.: Solid state13C NMR study of the char forming processes in polychloroprene. Polym. Degrad. Stab. 74, 397–405 (2001)
9. Lehrle, R.S., Dadvand, N., Parsons, I.W., Rollinson, M., Horn, I.M., Skinner, A.R.: Pyrolysis-GC-MS used to study the thermal degradation of polymers containing chlorine. III. Kinetics and mechanisms of polychloroprene pyrolysis. Selected ion current plots used to evaluate rate constants for the evolution of HCl and other degradation products. Polym. Degrad. Stab. 70, 395–407 (2000)
10. Gardner, G.L., McNeill, I.C.: The thermal degradation of chloroprene-I. Thermal analysis studies of the stability of poly-chloroprene samples and measurements of the kinetics of degradation. Eur Polym Journal 7(6), 569–591 (1971)
11. Jaroszynska, D., Kleps, T., Gdowska-Tutak, D.: Investigation of thermal degradation of polymers containing chlorine by ther-mogravimetry. J. Therm. Anal 19, 69–78 (1980)
12. Gardner, D. L., McNeill, I. C.: The thermal degradation of polychloroprene—II study of the products of degradation Eur. Polymer J. (1971). doi:10.1016/0014-3057(71)90089-9
13. Caballero, J.A., Conesa, J.A.: Mathematical considerations for nonisothermal kinetics in thermal decomposition. J. Anal. Appl. Pyrolysis 73, 85–100 (2005)
14. Blazek, J.: Study of the reaction kinetics of the thermal degra-dation of polymers. Doctoral thesis, EMAC, France, Sept 2005 15. Maciejewski, M.: Computational aspects of kinetic analysis. Part
B: The ICTAC kinetics project-the decomposition kinetics of calcium carbonate revisited, or some tips on survival in the kinetics minefield. Thermochim. Acta 355, 145–154 (2000) 16. Wendlandt Wesley, W.M.: Thermal analysis. Wiley, USA (1986) 17. Maria, Gh.: «Metode de estimare a parametrilor modelelor ma-tematice ale proceselor chimice», course of University «Po-litehnica» from Bucharest, Chemical Engineering Faculty (1999) 18. Kameda, T., Watabe, Y., Grause, G., Yoshioka, T.: Dehydro-chlorination behaviour of polychloroprene during thermal deg-radation. Thermochim. Acta 476, 28–32 (2008)
19. Wendlandt, W.W.: Thermal analysis, 3rd edn. Wiley, New York (1986)