HAL Id: hal-03005338
https://hal.archives-ouvertes.fr/hal-03005338
Submitted on 18 Nov 2020
HAL is a multi-disciplinary open access
archive for the deposit and dissemination of sci-entific research documents, whether they are pub-lished or not. The documents may come from teaching and research institutions in France or abroad, or from public or private research centers.
L’archive ouverte pluridisciplinaire HAL, est destinée au dépôt et à la diffusion de documents scientifiques de niveau recherche, publiés ou non, émanant des établissements d’enseignement et de recherche français ou étrangers, des laboratoires publics ou privés.
Bernardo Strassburg, et al.
To cite this version:
Sean Maxwell, Victor Cazalis, Nigel Dudley, Michael Hoffmann, Ana Rodrigues, et al.. Area-based conservation in the twenty-first century. Nature, Nature Publishing Group, 2020, 586 (7828), pp.217-227. �10.1038/s41586-020-2773-z�. �hal-03005338�
Area-based conservation in the 21
stcentury
1Sean L. Maxwell1,*, Victor Cazalis2, Nigel Dudley1,3, Michael Hoffmann4, Ana S.L.
2
Rodrigues2, Sue Stolton3, Piero Visconti5,6,7, Stephen Woodley8, Martine Maron1,
3
Bernardo B.N. Strassburg9, Amelia Wenger1, Harry D. Jonas8,10, Oscar Venter11 &
4
James E.M. Watson12
5
1Centre for Biodiversity and Conservation Science, School of Geography, Planning and Environmental
6
Management, University of Queensland, St Lucia, Queensland 4072, Australia.
7
2CEFE, CNRS, Univ Montpellier, Univ Paul Valéry Montpellier 3, EPHE, IRD, Montpellier, France.
8
3Equilibrium Research, The Quays, Cumberland Road, Spike Island, Bristol BS1 6UQ, UK.
9
4Conservation and Policy, Zoological Society of London, Regent’s Park, London NW1 4RY, UK
10
5Institute of Zoology, Zoological Society of London, London NW1 4RY, UK.
11
6Centre for Biodiversity and Environment Research, University College London, London C1E6BT, UK.
12
7International Institute for Applied Systems Analysis (IIASA), Schlossplatz 1, A-2361 Laxenburg, Austria
13
8World Commission on Protected Areas, International Union for Conservation of Nature, 1196 Gland,
14
Switzerland.
15
9Department of Geography and the Environment, Pontifical Catholic University of Rio de Janeiro (PUC-Rio)
16
and International Institute for Sustainability, Rio de Janeiro, Brazil
17
10Future Law, Lot 2, Lorong Pokok Kapas, Taman Faber, Kota Kinabalu, 88300, Sabah, Malaysia
18
11Ecosystem Science and Management, University of Northern British Columbia, Prince George, Canada
19
12Wildlife Conservation Society, Global Conservation Program, Bronx, New York 10460, USA.
20
* to whom correspondence should be addressed: [email protected]
21
2
Abstract
22
Humanity will soon define a new era for nature – one that seeks to correct decades of 23
underwhelming responses to the global biodiversity crisis. Area-based conservation efforts, 24
which include both protected areas and other effective area-based conservation measures, are 25
likely to extend and diversify. But persistent shortfalls in ecological representation, 26
management effectiveness and measurable biodiversity outcomes diminish the potential role 27
of area-based conservation in stemming biodiversity loss. Here we show how protected area 28
expansion by governments since 2010 has had limited success in increasing biodiversity 29
coverage, and identify four emergent issues that –if addressed – will enhance the performance 30
of area-based conservation post-2020. We close with recommendations for a broad 31
biodiversity agenda that maximises the potential of area-based conservation. Parties to the 32
Convention on Biological Diversity must recognise that area-based conservation primarily 33
focuses on local threats to species and ecosystems, and needs enhanced emphasis on 34
biodiversity outcomes to better track and fund its contribution to global conservation efforts. 35
3
Introduction
36
Governments, policy makers and much of the conservation community have long heralded 37
protected areas as a fundamental cornerstone of biodiversity conservation1,2 (Box 1). The 38
importance of other effective area-based conservation measures (OECMs) is also beginning 39
to be recognised3-7. OECMs were defined by the Convention on Biological Diversity (CBD) 40
in 2018 as places outside the protected area estate that provide effective biodiversity 41
conservation, such as some private conservation initiatives, water catchment areas and 42
territories conserved by Indigenous peoples and local communities. Both protected areas and 43
OECMs (collectively referred to herein as ‘area-based conservation’) are acknowledged in 44
the 2030 Agenda for Sustainable Development8 and the CBD. In particular, the CBD’s 45
current ten-year Strategic Plan for Biodiversity9 – agreed by 168 countries in 2010 – has an 46
explicit target (Aichi Target 11) that calls for “at least 17 per cent of terrestrial and inland 47
water areas and 10 per cent of coastal and marine areas, especially areas of particular 48
importance for biodiversity and ecosystem services, are conserved through effectively and 49
equitably managed, ecologically representative and well-connected systems of protected 50
areas and OECMs, and integrated into the wider landscape and seascape” by 2020. 51
Since 2010, protected areas have expanded from covering 12.7% to 15.0% of global land and 52
freshwater environments and from 1.6% to 7.8% of the marine realm10. While it is not yet 53
possible to track their global extent systematically, OECMs have also expanded since 201011.
54
Yet amongst the encouraging expansion of area-based conservation, there is growing concern 55
that nations are paying less attention to the qualitative elements of Aichi Target 11 – such as 56
the need for area-based conservation to be representative, connected and effectively 57
managed12-17. Moreover, some long-standing issues, including poor resourcing and 58
4 governance and lack of management effectiveness, continue to compromise the ability of 59
protected areas to conserve biodiversity and ecosystems18-24. As a consequence, there is a 60
risk that humanity could meet the areal components of Aichi Target 11 but fail to deliver on 61
the overall strategic goal for which it was established - to “improve the status of biodiversity 62
by safeguarding ecosystems, species, and genetic diversity”9. 63
A post-2020 Global Biodiversity Framework will be agreed at the fifteenth Conference of the 64
Parties to the CBD in China in 2020. This new strategic plan will likely be humanity’s last 65
chance to halt global biodiversity loss10. The urgency to act has emboldened calls for a 66
substantial expansion of area-based conservation globally25-28 and fundamental changes in
67
how environmental targets are framed and implemented18,23,29-31. It is therefore timely to 68
assess the achievements and failures of national area-based conservation efforts over the past 69
decade and place these findings within the wider context of the global biodiversity crisis. We 70
then identify emergent issues that will influence area-based conservation policy and 71
performance post-2020 and conclude with views on how the targeting and tracking of area-72
based conservation must be redefined to ensure it remain relevant in the 21st century. 73
74
The performance of protected areas since 2010
75
It is clear that Aichi Target 11 has encouraged some nations to expand area-based 76
conservation efforts, particularly in the marine realm. Australia, Gabon and Brazil for 77
instance have all grown their protected area estates by >20% since 2010 (Fig. 1). Here, we 78
review how the recent expansion of protected areas globally has affected the qualitative 79
components of Target 11. Where possible, we also provide an up to date temporal analysis 80
5
(between 2010 to 2019) on the performance of protected areas against the qualitative 81
components of Target 11 (Fig. 2). We omit reference to OECMs in this section as a database 82
showing the global extent of these sites is not yet available11 (see Supplementary Methods for 83
details of calculations). 84
Protected areas being “ecologically representative”
85
The concept of being “ecologically representative” has been interpreted as the coverage of 86
species or ecoregions (areas containing geographically distinct assemblages of species32,33), 87
especially those that threatened with extinction13,16,32,34-37. Most evidence to date suggests 88
significant shortfalls in either approach. For species, Butchart and colleagues16 showed that
89
less than half of all known mammals, amphibians, lobsters, crayfish, mangroves, seagrasses, 90
bony fishes, cartilaginous fishes and threatened birds had a sufficient proportion of their 91
distributions covered by protected areas in 2013. An additional analysis showed that coverage 92
of migratory bird species was particularly poor, with only 9% having their migratory flyway 93
adequately protected38 in 2013. The global marine protected area estate also had noticeable
94
coverage shortfalls for mammalian species diversity (62% covered), taxonomic diversity 95
(74% covered), functional diversity (78% covered) and threatened species (37% covered) in 96
201639. 97
We re-analysed how expansion of the global protected area estate between 2010 and 2019 98
affected coverage of 4,854 vertebrate species listed as Vulnerable, Endangered or Critically 99
Endangered (herein ‘threatened’ species) on the IUCN Red List40 (Figure 2). Eighty-two
100
(1.7%) of these species gained some level of protection for the first time in the last decade, 101
and 87.8% (n = 4,264) of all species assessed had some portion of their geographic rage 102
6 protected by 2019 (a change from 85.0% in 2010). While the majority of species assessed had 103
some level of protection, only one-quarter had adequate representation in the global protected 104
area estate in 2019 (from 23.7% in 2010) (representation targets for individual species were 105
set according to their geographic range16,35,36; see Supplementary Methods for details of
106
calculations). 107
Seventy-four threatened species had their representation target met between 2010 and 2019, 108
and 43.2% (n = 16) of threatened marine mammal species received adequate representation in 109
the global protected area estate in the last decade. However, 74.8% of threatened birds, 110
amphibians and terrestrial mammals were still inadequately protected as of 2019, and 605 111
threatened species remain without any representation at all (Table S1). In the last decade, the 112
proportion of species with adequate protection grew by only three percent for birds (to 113
34.5%; n = 462 to 499) and just one percent for amphibians (to 13.0%; n = 255 to 276) and 114
terrestrial mammals (to 36.9%; n = 406 to 423), suggesting that the vast majority of new 115
protected areas have not been established in locations that would safeguard species that had 116
poor levels of protection in 201013,14. Importantly, these coverage shortfalls are not solely 117
driven by antecedent placement of protected areas – terrestrial and marine protected areas 118
established post-2010 do not appear to have targeted species at risk of extinction14,41,42. 119
To assess coverage of ecoregions, we followed previous studies16,34,37 that contrasted 120
coverage of ecoregions against targets of 17% protection for terrestrial ecoregions and 10% 121
for coastal and shelf marine ecoregions or off-shelf pelagic regions. We found that 40.4% (n 122
= 351) of ecoregions were at least 17% protected in 2019 (from 36.4% in 2010), and 38 123
ecoregions transitioned from zero to at least 17% coverage over the last decade (Figure 2; 124
Table S2). We also found that over one-fifth (21.5%) of land protected since 2010 covered 125
7
tropical and subtropical grassland ecoregions (Table S3) – a critically endangered biome32 - 126
while 34.4% of land protected since 2010 covered dry or desert ecoregions, which are 127
relatively species poor and over-represented32. In 2019, 128 ecoregions (15.1%) remain <2% 128
protected (Table S2). Tropical and subtropical dry broadleaf forest ecoregions, in particular, 129
remain chronically under-protected (<1% of new land protected covered this biome in the last 130
decade) given their high biodiversity and rapid rate of habitat loss over the last two 131
decades32,43. 132
We also assessed coverage of marine ecoregions33 and off-shelf pelagic regions44 between 133
2010 and 2019. The number of marine ecoregions with ≥10% coverage increased 134
substantially to 56.5% (n = 101) over the past decade (from 38.8% in 2010), with much of 135
this growth occurring over ecoregions within the Southern Ocean (0.6 million km2; 3.9% of 136
all new marine protected area). However, marine protected area expansion could have been 137
more strategic –the number marine ecoregions with ≥10% coverage for every hectare of 138
ocean protected has declined since 2010 (Figure 2). Coverage in off-shelf pelagic regions 139
remain much lower on average, despite 89.0% (13.6 million km2) of new marine protected 140
area targeting these regions since 2010. Eleven percent (n = 4) of off-shelf pelagic regions are 141
now ≥10% protected (from 2.7% in 2010). Much of this new coverage focused on remote 142
Antarctic waters, not areas in the high seas where marine biodiversity faces elevated human 143
pressures41.
8
Protected areas covering “areas of particular importance for biodiversity and ecosystem
145
services”
146
The Key Biodiversity Area (KBA) approach45 offers a global standard for identifying 147
marine, terrestrial and freshwater sites that contribute significantly to the global persistence 148
of biodiversity. Over 15,000 KBAs have been identified, and host nations are encouraged to 149
ensure that these sites are managed in ways that ensure the persistence of their key 150
biodiversity elements, although this does not necessarily mean inclusion within a protected 151
area45. The 2018 Protected Planet report34 found that, between 2010 and 2018, average 152
coverage of marine KBAs increased from 5.0 to 15.9%. This report also found average 153
coverage was greater, but advanced at a much slower rate, for terrestrial (43.3% to 46.6%) 154
and freshwater (41.1% to 43.5%) KBAs34. Our analysis showed similar coverage estimates 155
for terrestrial and freshwater KBAs but higher estimates of average coverage of marine 156
KBAs (20.8% protected on average by 2019) (Figure 2). 157
Wilderness areas are ecologically intact land and seascapes that are predominantly free of 158
human-driven biophysical disturbance46,47. They underpin planetary life-support systems48 159
and are critical for the long-term persistence of imperilled species49, especially in a time of 160
climate change50. Only 4.9% of marine wilderness areas were protected in 201746, and 161
protected areas established between 1990 and 2015 covered just 8.3% of terrestrial 162
wilderness areas51. When compared to these previous studies, our analysis shows coverage
163
for marine wilderness areas has increased in recent years (8.5% protected in 2019 versus 164
2.0% protected in 2010). This is despite marine wilderness areas often being in international 165
waters, making protected area establishment complicated from a legal perspective. Our 166
analysis also shows that the consideration of protected areas established pre-1990 and post-167
9
2015 nearly trebles previous estimates of terrestrial wilderness coverage (22.1% protected by 168
2019) (Figure 2). 169
Aichi Target 11 further requires protected areas to conserve “areas of particular importance 170
for […] ecosystem services”. Among the multitude of services that healthy, functioning 171
ecosystems provide10,52, our ability to track coverage of carbon storage and sequestration is 172
arguably the most advanced. Previous assessments of the amount of carbon stored in 173
protected areas have been confined to national or regional scales34,53. We used a new global 174
dataset (Soto-Navarro, C. et al. pers. comm; see Supplementary Information) to track 175
coverage of biomass and soil carbon over the last decade. In 2010, 22.6% (94.4 gigatonnes) 176
of the world’s biomass carbon was inside protected areas. By 2019, this proportion had 177
increased only slightly to 23.7% (99.0 gigatones), indicating that post-2010 terrestrial 178
protected areas captured less carbon per hectare than those established pre-2010 (Figure 2). 179
Protected areas hold a lower proportion of soil carbon, ranging from 13.9% (379.9 180
gigatonnes) in 2010 to 14.6% (400.5 gigatonnes) in 2019. Large unprotected repositories of 181
soil carbon are prevalent across north-east North America, Russia and south-east Asia (Figure 182
S1). 183
Incomplete mapping of other ecosystem services, including those pertaining to provision (e.g. 184
fisheries, timber), regulation (e.g. coastal armouring, soil stabilisation) and culture (e.g. 185
education, recreation), makes it difficult to track their coverage. The expansion of OECMs 186
will be driven largely by ecosystem services, such as those relating to climate stabilisation 187
and watershed protection, necessitating better understanding and documentation of these 188
values. However, 44% of coral reef tourism value and 20% of coral reef coastal protection in 189
2018 depended on protected areas34. The global protected area estate also holds 190
10 approximately 29% of all coral reef fisheries biomass and contributes to 31% of all mangrove 191
fishery catch34. Moreover, nearly two-thirds of the global population is living downstream of 192
the world’s protected areas as potential users of freshwater provisioned by these areas54.
193
Protected areas being “well connected” and “integrated into the wider landscape and
194
seascape”
195
Well-connected ecosystems are critical for maintaining important ecological and evolutionary 196
processes, including species migration, gene flow and range shifts, especially when species 197
face rapid climatic and environmental changes55,56. In 2016, only 30% of terrestrial 198
ecoregions were at least 17% covered by protected areas that were theoretically reachable by 199
species57. At the global scale, the percentage of connected terrestrial protected areas increased 200
from 6.5% to 8.1% between 2010 and 2014, before decreasing 7.7% in 201858. These 201
assessments did not account for the permeability of unprotected land between protected areas, 202
but show how the global protected area system is becoming increasingly fragmented, akin to 203
land and seascapes generally59,60.
204
Connectivity is an important consideration for marine protected areas because, among other 205
reasons, it helps to maintain networks of local populations61 and to replenish fish populations 206
on fished reefs62. High levels of connectivity also correspond to areas of enriched coral 207
diversity63. Marine protected areas should therefore accommodate movement patterns among 208
habitats that are critical to the life history of marine species (e.g. home ranges, nursery 209
grounds, migration corridors, spawning aggregations)64. There have been no global-scale 210
assessments of connectivity among marine or freshwater protected areas, but regional-scale 211
studies show them to have limited connectivity for species with a dispersive larval stage65. 212
11
Protected area management effectiveness
213
Citizen science, earth observation technology and assessments of individual area-based 214
conservation efforts have all advanced over the last decade66-68. Studies that intersect these 215
data with networks of protected areas (so as to assess their effectiveness) show that, on 216
average, protected areas slow but fail to completely halt human pressures and biodiversity 217
loss within their borders69-73. 218
A recent assessment shows that over 12,000 protected areas established prior to 1995 were, 219
on average, ineffective at reducing human pressures inside their borders between 1995 and 220
201074. An earlier study found that one-third of all protected land was under intense human
221
pressure at the start of this decade73. This study by Jones and colleagues also found that 222
human pressure had increased in 55% of protected areas between 1993 and 200973. As for 223
marine protected areas, 94% of those created before 2014 permit fishing activities75 – a key 224
driver of poor marine protected areas effectiveness76. Moreover, marine protected areas that 225
prohibit the taking of living or dead natural resources (i.e. no-take marine reserves) are 226
subject to illegal fishing activities77. There is, however, clear evidence that many protected 227
areas do effectively abate human pressures. For example, marine protected areas reduce 228
fishing vessel traffic78 and the negative effects of some non-native species79. Terrestrial 229
protected areas have been found to reduce rates of deforestation and forest degradation below 230
those observed in nearby unprotected areas80,81, and to reduce increases in human pressure in
231
wilderness areas82. Protected areas established and managed by Indigenous people are 232
particularly effective at avoiding deforestation in regions with high deforestation pressure83. 233
By lowering rates of deforestation inside their borders, tropical protected areas reduced 234
carbon emissions from land use change by around 29% (4.88 gigatonnes) between 2000 and 235
12 201284. Moreover, 54.8% of studies that assess their role in reducing deforestation show 236
protected areas also reduce deforestation rates in surrounding, unprotected lands, whereas 237
11.8% show protected area establishment increases deforestation in surroundings areas85. 238
In terms of biodiversity outcomes, several studies have reported beneficial effects of 239
protected areas on species abundance and diversity72,86,87. For example, a study of 447 240
terrestrial protected areas showed them to be effectively maintaining populations of birds and 241
mammals within their boundaries88. Another study showed bird and mammal populations 242
between 2007 and 2014 increased in abundance (17% of cases) or exhibited no change (22% 243
of cases) within 15 protected areas (22 % of populations declined while 39% were detected 244
too infrequently to assess occupancy changes)89. A review of 218 marine protected areas 245
found that, on average, fish biomass is nearly double inside protected areas than in matched 246
non-protected areas21. Marine protected areas also promote the recovery of fish 247
populations90,91. No-take marine reserves, in particular, result in significant increases in 248
species richness, density and biomass in both tropical and temperate systems21,92-94, as well as
249
being effective at restoring trophic function95,96 and lowering levels of coral disease97. 250
Equitable management in protected areas
251
Some nations have made clear commitments – beyond those stipulated in Aichi Target 11 - to 252
improve protected area management equity98. Yet few studies have scrutinised the outcomes 253
of such commitments because there is substantial variability in how equitable management is 254
defined and assessed for protected areas99,100. There is evidence showing protected areas that 255
integrate local people as stakeholders often result in higher conservation and socioeconomic 256
outcomes101,102. For example, some community-managed terrestrial protected areas are more 257
13
effective than nationally-designated protected areas at reducing deforestation pressures in 258
Brazil, Namibia and Australia83,103, and community-managed marine protected areas that are 259
long-established and well-enforced enhance economic and social well-being104,105. 260
Furthermore, a recent review of eleven countries across four continents showed terrestrial 261
protected areas do not impinge on efforts to alleviate poverty106. However, limited data on the
262
location and prevalence of equitably managed protected areas currently precludes a more
263
complete understanding of their social and biodiversity outcomes21,107. 264
265
Emerging issues for area-based conservation
266
Our analyses revel that countries will almost certainly fall short on achieving the quality 267
components of Aichi Target 1134. The continued expansion of area-based conservation 268
without addressing these shortfalls will lead to poor outcomes for biodiversity. We argue that 269
at least four emergent issues must be considered and acted upon by governments, scientists, 270
policy makers and other stakeholders to address current failings of area-based conservation in 271
the coming decade. 272
The expanding opportunities for area-based conservation
273
Opportunities to enhance land and water management practices that help to conserve 274
biodiversity are expanding. Private conservation initiatives and Indigenous and community 275
conserved areas (ICCAs) can be formally recognised as protected areas or “other effective 276
area-based conservation measures” (OECMs), or achieve recognition on their own terms. Yet 277
until recently, ICCAs and private conservation initiatives have been overlooked in national 278
conservation policies, strategies and reports4. Indigenous Peoples manage or have tenure 279
14 rights over at least 37% of all remaining intact landscapes on Earth3, and ICCAs have been in 280
existence since humans began to govern and manage landscapes and seascapes 281
purposefully108. A recent study by Schuster and colleagues showed indigenous managed 282
lands support higher concentrations of biodiversity than formal protected areas109, which
283
exemplify the critical role that ICCAs can play in global biodiversity conservation efforts and 284
the importance of working with Indigenous Peoples to increase ICCA coverage in their 285
territories. Private conservation initiatives too have been established in various forms for well 286
over a century4, and in some regions out-number nationally-designated protected areas110. A 287
recent assessment of South Africa’s Cape Floristic region showed 25% of large carnivore 288
species and 22% of mesoherbivores (50-500 kilograms in weight) could only be supported in 289
areas that were at least partly privately managed111. 290
Wider recognition of private conservation and ICCAs are likely to drive rapid expansion in 291
the global protected area and OECM networks over the coming years. Recognition of 292
OECMs is no mere formality (Box 1) as they have stricter benchmarks for biodiversity 293
conservation than many nationally-recognised protected areas, and by formalising their role, 294
owners recognise an obligation to biodiversity conservation and undergo public scrutiny of 295
their management practices5. The wider recognition of OECMs could help address at least 296
four current shortfalls of the global protected area estate. First, Indigenous and community 297
sites could address management equity shortfalls because they are managed by and for the 298
benefit of a diverse set of actors. More diverse management and siting arrangements should 299
also help these areas to address current shortfalls in ecological representation and coverage of 300
important areas for biodiversity. Over 76% of unprotected KBAs were at least partly covered 301
by one or more potential OECMs in 20186, and compared to protected areas with government 302
15
ownership, OECMs may prove to be more socially acceptable in productive land and 303
seascapes112,113 and thus enhance coverage of poorly protected species13,14. Finally, OECMs 304
could enhance the connectivity of protected area networks, helping them to become better 305
integrated within wider landscapes and seascapes113. Recognising and enhancing OECMs in
306
inshore marine habitat, farmlands and managed forests will be particularly valuable in this 307
regard, provided species composition and ecological functions can be restored in such 308
areas114. 309
Expanding the conservation estate provides an opportunity to make meaningful contributions 310
to global biodiversity conservation efforts if new sites can overcome issues currently faced by 311
many protected areas, including inadequate resourcing and monitoring. A switch to a broader 312
interpretation of area-based conservation will also require major changes in how governments 313
and conservation actors uphold human rights and social safeguards, particularly on 314
Indigenous and community areas. It will mean, for example, governments, conservation 315
actors, Indigenous people and private entities working together towards shared goals as equal 316
partners. Conservation outside government-run protected areas may enhance opportunities for 317
private financing of biodiversity conservation, but clear operating procedures will be needed 318
to ensure that involvement from private industry does not compromise the integrity of 319
conservation management115. More generally, efforts must be made to ensure the whole 320
conservation estate contributes substantively to biodiversity conservation globally. National 321
governments cannot, for example, be permitted to view OECMs as a cheap and easy way to 322
reach areal components of global area-based conservation targets, without due assessment of 323
how they deliver positive and sustained biodiversity outcomes23. 324
16
The increasing dynamism of Earth’s protected area estate
326
Throughout much of the 20th century, protected areas were considered permanent features of 327
land and seascapes - legally protected in perpetuity. Today, protected areas face an 328
increasingly uncertain future due to poor management by governments. A recent analysis 329
showed that while 2.5 million km2 of land and sea were added to the global protected area 330
estate annually between 2006 and 2018, around 1.1 million km2 were recorded as removed 331
each year116. While many areal changes were bureaucratic in origin (e.g. changed data 332
sharing policies), some of this loss can be attributed to an increase in protected area 333
downgrading, downsizing, and degazettement (PADDD) events. Over 1,500 PADDD events 334
affected over one-third of Australia’s protected area network (416,740 km2) between 1997 335
and 2014117. Qin and colleagues118 also found 23 PADDD events that have affected 336
UNESCO World Natural Heritage Sites – protected areas with “outstanding universal value”, 337
meaning they are so exceptional as to transcend national boundaries and are important for 338
present and future generations of all humanity (e.g. Virunga, Serengeti and Yosemite 339
National Parks). 340
Official justifications for PADDD events are rarely made transparent, but most (62%) appear 341
to be associated with activities that are in stark conflict with protected areas objectives2, 342
including industrial-scale resource extraction and infrastructure development119. Moreover, 343
only 5% of PADDD events are ever partially or fully reversed120. PADDD events can also
344
accelerate forest loss and fragmentation121 and may restrict dispersal and migration of wide 345
ranging species122. Many PADDD events are also going undocumented, particularly in 346
marine systems123 and in privately protected areas110. Their poor documentation makes it 347
17
difficult to assess risk of future PADDD events and how they will affect the quality of 348
protected area networks, or their capacity to conserve biodiversity in perpetuity. 349
It is important for any review of area-based conservation targets to account for protected area 350
dynamics, particularly if they result in backsliding on commitments to biodiversity. However, 351
dynamism could signal attempts to expand or enhance protected areas, either through 352
improved resourcing and management124,125, or by enacting more conservation-focused 353
regulation126,127. Alongside clear guidelines for documenting PADDD events, there is 354
therefore a clear need to develop a separate protocol that can track and incentivise the 355
continuum of changes to protected areas that can improve their ability to conserve 356
biodiversity. We suggest that such changes be characterised collectively as protected area 357
gazettement, expansion and enhancement (PAGEE). Clear, transparent tracking around both 358
PAGEE and PADDD events will ensure nations address, and not exacerbate, current 359
shortfalls in protected area networks globally. 360
The need for more adequate measures of effectiveness
361
Numerous approaches have been used to track the capacity of area-based conservation to 362
abate human pressures and maintain biodiversity (Table 1). All these approaches have merit, 363
but the conservation community remains too reliant on measures of effectiveness that are 364
coarse or do not capture biodiversity outcomes of area-based conservation. For example, the 365
Global Database on Protected Area Management Effectiveness (GD-PAME) provides useful 366
information on the intention and means (including funding) of protected areas, but the 367
majority of GD-PAME methodologies collect very limited quantitative information on how 368
species and ecosystems have responded to protected area management activities68. The most 369
18 used GD-PAME methodology – the Management Effectiveness Tracking Tool (METT) – 370
was not developed to assess a detailed evaluation of biodiversity outcomes128 and cannot 371
therefore be used to measure the state of biodiversity in protected areas. 372
High resolution maps of ecological change across land and seascapes, including forest cover 373
change129 and changes in cumulative human pressure130,131, have helped to advance some 374
measures of effectiveness for area-based conservation. For example, changes in cumulative 375
human pressure, when available at relatively fine spatial resolution (1km2) and available for 376
multiple time steps130, are significantly correlated with trends in species risk of extinction132. 377
However, ecological changes across land and seascapes do not always explain local 378
biodiversity patterns133. Moreover, the temporal resolution of cumulative human pressure 379
mapping lags behind that of forest cover mapping efforts and some maps of human pressure 380
are at spatial resolutions (e.g. 77sqkm131) that preclude assessments of many small, but 381
crucially important134, protected areas. Coarse measures of effectiveness also arise when only 382
a subset of biodiversity threats is represented in mapping efforts. Threats such as invasive 383
species and hunting pressure are not directly captured in any global maps of cumulative 384
pressure, despite being among the major drivers of biodiversity loss globally135. 385
There are substantial practical challenges to assessing area-based conservation effectiveness 386
more precisely and accurately136. Assessing the local-scale population response of a 387
threatened species to environmental change, for example, in most cases requires long-term 388
field monitoring data. New global-scale citizen science initiatives are rapidly expanding the 389
coverage and increasing the frequency of biodiversity data across the planet67, and will play a 390
crucial role in improving measures of area-based conservation effectiveness. Measures that 391
combine near-real-time change in human pressures with on-ground reporting of management 392
19
capacity and biodiversity trends, will also enable area-based conservation outcomes to be 393
reported with much greater accuracy and reliability. Studies of area-based conservation 394
effectiveness could also make better use of scenario analysis and models to generate more 395
predictive measures of outcomes137 and account for uncertainty in composite indicators of
396
environmental condition138. 397
Resourcing shortfalls in area-based conservation
398
Among the most cited reasons for the poor performance of area-based conservation is a lack 399
of resourcing (or related issues such as weak enforcement77 or inadequate staff capacity21). 400
Studies undertaken nearly two decades ago estimated a shortfall of $1-1.7 billion per year just 401
to manage existing protected areas139,140. More recently, an assessment of more than 2,000 402
protected areas (representing ~23% of the global terrestrial protected area estate by area) 403
found 47% (48% by area) suffer from inadequate staff and budget resources, with inadequate 404
resourcing particularly pronounced in the Neotropics22. Staff and budget capacity shortfalls 405
are also prevalent in the marine realm, and help to explain why many marine protected areas 406
are ineffective or have inequitable management processes21. 407
Compounding resource shortfalls at existing sites are the costs associated with expanding 408
area-based conservation efforts. One estimate suggests that the costs of covering all 409
unprotected and partially protected Important Bird Areas (the avian subset of KBAs) would 410
cost $50.7 billion annually, combined with a further $7.11 billion per annum for managing 411
these sites141. Current and future resourcing needs could be met if the contribution of area-412
based conservation to national economies was fairly recognised. Recent estimates place the 413
direct value generated by visits to protected areas at $600 billion USD, and the indirect value 414
20 from consumer surplus (the net value to visitors from their vast, above what they actually 415
paid) at a further $250 billion annually142. However, there remain issues with how funding for 416
area-based conservation is generated, retained and reinvested143. An emerging approach to 417
financing area-based conservation includes funding from private industry, who in many 418
countries are legally required to offset biodiversity impacts of development projects144. Yet 419
this approach risks simply displacing, rather than supplementing current funding for 420
biodiversity conservation145. There is therefore an urgent need for more transparent tracking 421
of how private industry operations contribute (positively or negatively) to strategic goals for 422
biodiversity146.
423
424
Future-proofing area-based conservation
425
For all the achievements of area-based conservation, biodiversity is still declining globally at 426
rates unprecedented in human history10. Humanity must transform how species and 427
ecosystems are conserved10. In this final section, we define what this transformation could
428
entail and how area-based conservation could play a role within it. This role recognises that 429
area-based conservation acts primarily on local threats to species and ecosystems, and that 430
clear conservation objectives, defined in terms of biodiversity outcomes, are needed to better 431
track and fund the contribution of area-based conservation to global conservation efforts. 432
Placing area-based conservation within a broader conservation agenda
433
No matter how well-sited, resourced or managed, area-based conservation can only act on a 434
subset of drivers of, and pressures contributing to, global biodiversity loss (Figure 3). For 435
example, expecting protected areas to maintain genetic diversity, abundant populations and 436
21
functional ecosystems, as well as contributing to sustainable management of agriculture and 437
forestry, is likely asking too much. First and foremost protected areas must conserve 438
biodiversity2. Many will also conserve ecosystem services and vulnerable human societies, 439
but a large proportion of these wider societal goals will be met by OECMs and other forms of 440
sympathetic land and water management. To stem the global loss of biodiversity, however, it 441
is now clear that effective area-based conservation must be met with transformative change 442
across all sectors of society10,147. Good siting, resourcing and management are themselves 443
dependent on external socio-economic factors, including local and national governance, 444
regulation of natural resource extraction and consumption and other underlying drivers of 445
anthropogenic impacts on the environment14,148. We therefore need a new, bold 446
environmental agenda that will make biodiversity conservation mainstream. 447
Most countries show glimpses of mainstreaming biodiversity conservation across sectors of 448
society. For example, the Chinese government’s “Ecological Red Lines” strategy involves 449
identifying areas that require strict protection within planned development footprints to 450
improve ecological functions and to ensure the sustainable supply of ecological goods and 451
services149. In Portugal, the legally binding “National Ecological Reserve” aims to retain 452
areas of ecological value or defend areas that are susceptible to natural hazards150. And in 453
Brazil, the 2001 Forest Code stipulated that private landowners in the Amazon biome should 454
conserve 80% of their property in native vegetation, and 20% if located in other biomes151.
455
While encouraging, existing efforts to integrate biodiversity into broader land and sea 456
planning frameworks have major limitations. A number of these efforts have been criticised 457
for their superficial integration of biodiversity136, or for containing loopholes that lead to 458
perverse environmental outcomes152. Environmental safeguards that exist in broad planning 459
22 frameworks also remain largely subservient to economic development153 and are subject to 460
frequent policy changes, which create uncertainty in the minds of land and sea 461
managers151,154,155. As a result, many national biodiversity conservation strategies rely almost 462
entirely on networks of protected areas – made evident by nations making progress toward 463
achieving Aichi Target 11, but little or no progress towards the other Aichi targets, such as 464
preventing species extinctions147. This is despite biodiversity conservation underpinning 465
many of the Sustainable Development Goals8. 466
Area-based conservation must be recognised as one essential solution to conservation 467
problems, but not the only solution. The conservation community must elevate the 468
importance of other interventions that work in concert with area-based conservation, such as 469
payments for ecosystem services policies, carbon pricing schemes, legislation that limits 470
industrial encroachment on lands and seas deemed important for biodiversity or ecosystem 471
services, the coordination of restoration efforts on degraded land, coasts and seas, eliminating 472
subsidies for activities harmful to biodiversity, and human development programs aimed at 473
incorporating traditional knowledge and reducing inequalities (Figure 3). Getting these 474
interventions right is just as important for biodiversity globally as addressing shortfalls of 475
area-based conservation, and much can be learnt from what made combinations of 476
conservation interventions successful in the past (e.g. Costa Rica greatly reducing 477
deforestation rates with a suite of cross-sectoral interventions156). Integrating biodiversity
478
more effectively into other conservation interventions would both reduce unrealistic 479
expectations from area-based conservation and provide more effective landscape and 480
seascape-scale responses. 481
23
Rethinking target formulation and evaluation of area-based conservation
483
Once their role in a broad conservation agenda has been defined, post-2020 targets for area-484
based conservation will need to be formulated30. Any such targets will need to recognise that 485
individual protected areas and OECMs are not created equal, and what is required for these 486
areas to be effective is complex - including elements of governance, management and 487
ecological design. As such, we suggest that nations and – when appropriate – other 488
management bodies be required under the CBD to better define, collate and publish the 489
objectives of individual protected areas and OECMs. It will then be possible to assess how 490
individual sites tracking toward their stated objectives, and how area-based conservation 491
contributes to broader national and international biodiversity conservation strategies. Existing 492
repositories (e.g. GD-PAME68; World Database on Protected Areas157; National Biodiversity 493
Strategies and Action Plans) could be augmented to house these objectives, provided the 494
repositories receive sufficient funding and resources. 495
An objective for a protected area or OECM should reflect the responsibility these sites have 496
for species and ecosystems of conservation concern and their potential to maintain or restore 497
them to a favourable conservation status23. Progress towards these objectives should 498
constitute an integral part of area-based conservation effectiveness reports and could be 499
aggregated taxonomically or geographically to assess progress towards broader biodiversity 500
goals23,158. A new standard for recognising protected areas or OECMs that deliver meaningful
501
outcomes for biodiversity – the IUCN Green List of Protected and Conserved Areas159 – 502
could energise progress toward stated objectives, provided the standard is used for systematic 503
assessments and to build capacity in under-performing sites, rather than a mechanism to 504
identify the best based conservation efforts. Nations could be further encouraged if area-505
24 based conservation targets would only be considered achieved if its appropriate contribution 506
to reaching broader biodiversity goals could be clearly demonstrated. 507
508
Conclusions
509
Area-based conservation will remain the cornerstone of conservation long into the 21st 510
century. But governments have dramatically underinvested in protected areas and OECMs 511
and been weak in legally protecting them. In addition to correcting these shortfalls, humanity 512
needs to do more by making biodiversity conservation part of all aspects of life. Governments 513
must define a new, bold era for nature that will make biodiversity conservation mainstream. 514
We then need to invest more resources and intellectual energy in consolidating area-based 515
conservation efforts and ensuring biodiversity conservation is a far stronger part of managed 516
land and seas. 517
518
Acknowledgements
519
We thank B. Williams and R. Venegas for assisting the analytical components of this review. 520
We also thank H.C. Jonas, P. Langhammer and those that attended the CBD’s Thematic 521
Workshop on Area-based Conservation Measures in Montreal in November 2019 for 522
thoughts and discussion around these ideas. 523
25
Display items
524
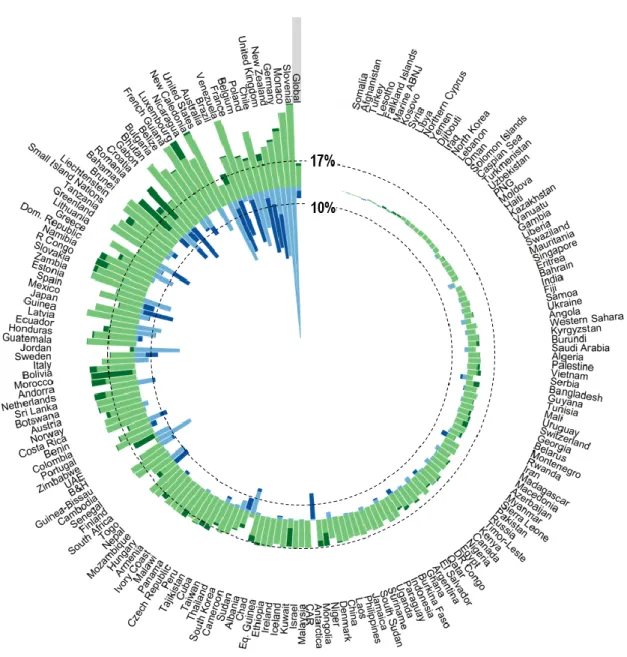
525
Fig. 1. Areal coverage (%) of marine (blue bars) and terrestrial (green bars) protected areas
526
on Earth. For each country of group of countries, protected areas coverage in 2010 (lighter 527
bars) is made distinct from growth in coverage by 2019 (darker bars). Progress toward a 528
globally agreed target - to have 17% of land and inland waters and 10% of coastal and marine 529
areas to protected by 2020 (black dashed circles) - is promising but incomplete. 530
531
26 533
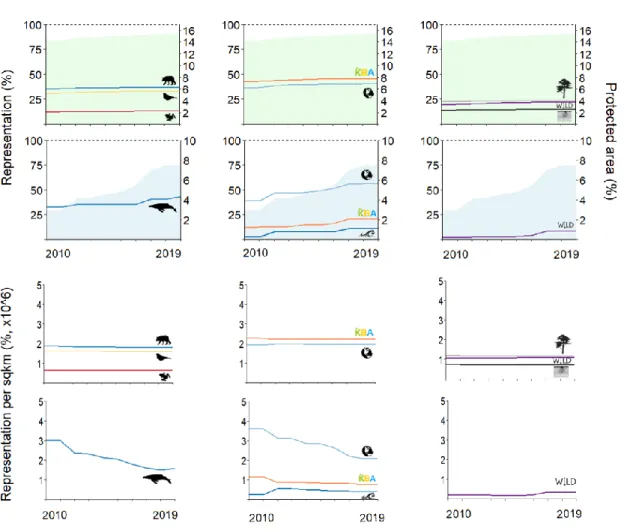
Fig. 2. Representation of biodiversity and ecosystem service values within the global
534
protected area estate between 2000 and 2019. The top panel shows average representation of 535
values as terrestrial (green shading) and marine (blue shading) protected area estates near 536
17% and 10% of global land and sea surfaces, respectively. The bottom panel shows 537
representation of values per area of land or sea protected. For threatened vertebrate species 538
(left-hand plots), trend lines show the proportion of species within each taxonomic group that 539
have had their individual representation targets met (these targets are proportional to species’ 540
geographic range). Trend lines for ecoregions (planet icon; centre plots) and off-shelf pelagic 541
regions (wave icon; centre plots) show the proportion these features that are at least 17% 542
protected (for terrestrial ecoregions) or at least 10% protected (for marine ecoregions or off-543
shelf pelagic regions). Trend lines for all other features, including Key Biodiversity Areas 544
(KBA icon; centre plots), wilderness areas (wild icon; right-hand plots), biomass carbon (tree 545
icon; right-hand plots) and soil carbon (soil icon; right-hand plots) represent global averages. 546
27 548
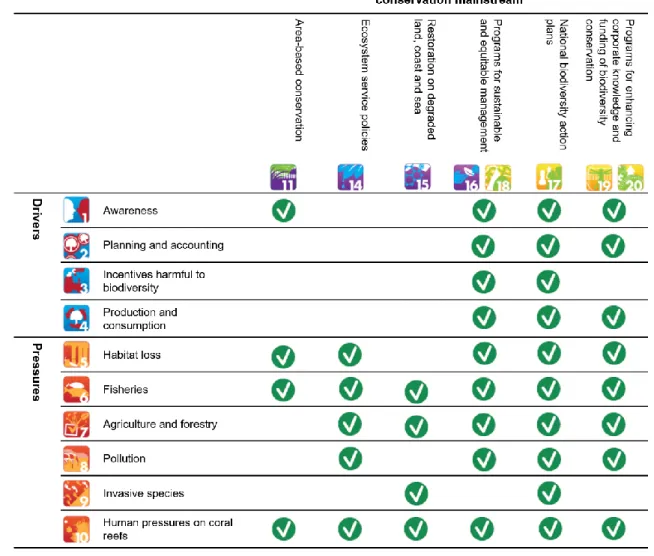
Fig. 3. A role for area-based conservation as part of a suite of conservation strategies in a
549
post-2020 environmental agenda. The post-2020 Global Biodiversity Framework should seek 550
to address all drivers of, and pressures contributing to, global biodiversity loss, including 551
those captured in Aichi Biodiversity Targets contained in the current Strategic Plan on 552
Biodiversity of the Convention on Biological Diversity (blue and orange icons). Area-based 553
conservation is well-suited to play a central role in abating some human pressures – primarily 554
local threats to species and ecosystems (green tick icons). Other conservation interventions 555
mentioned or implied in the Aichi Targets (purple and yellow icons), remain underutilised 556
despite being well suited to abate human pressures or drivers of biodiversity loss that area-557
based conservation is in many cases unable to act on. Post-2020, better integration of 558
biodiversity values into all conservation interventions will see them to contribute more 559
substantively to global goals for nature. 560
28 561
562
Box 1. Protected areas and other area-based conservation measures (OECMs) are
563
complementary area-based conservation measures. Their distinguishing feature is that a 564
protected area has a primary conservation objective2 whereas an OECM delivers the effective 565
in-situ conservation of biodiversity, regardless of its objectives7. (A) Protected areas are
566
playing a central role in conserving the Sundarbans mangroves of Bangladesh and India 567
(©NASA/JPL), (B) the Bamyan Plateau in Afghanistan (©N. Jahed/WCS) and (C) the 568
Shoebill stork (Balaeniceps rex) that ranges from South Sudan to Zambia (©Daniel Field). 569
(D) OECMs can be sites that prioritise conservation but this objective is not legally
570
recognised by the governing body (e.g. a conservation concession in Loreto Region, Peru 571
©Bruno Monteferri), (E) places where conservation is effective but only a secondary
572
management objective (e.g. a locally managed marine area on Totoya Island, Fiji ©Stacy 573
Jupiter), or (F) ancillary conservation where conservation happens more-or-less by accident 574
(e.g., the Hoedspruit Airforce Base, South Africa ©Hoedspruit Airforce Base). 575
29
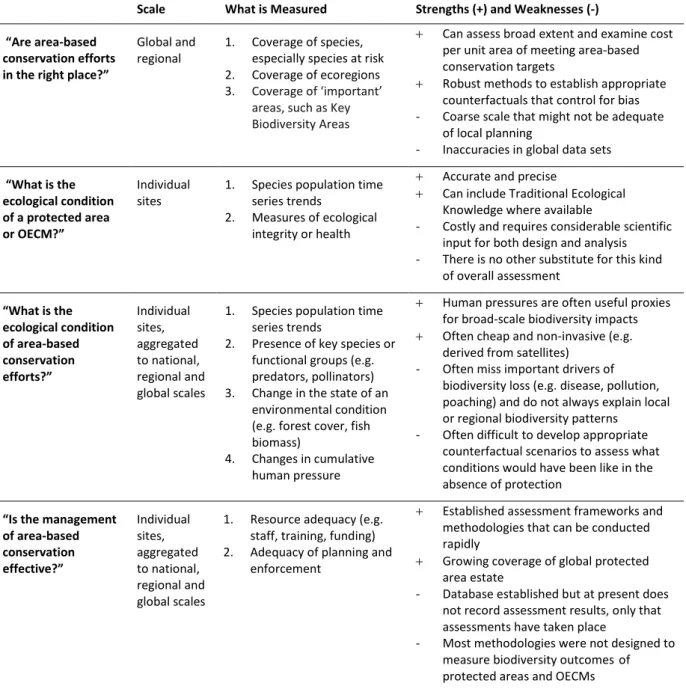
Table 1 Understanding the effectiveness of area-based conservation depends on the question
576
being asked. Commonly asked questions imply different spatial scales and measurements, 577
and are subject to strengths and weakness. Globally we have weak direct measures of the 578
biodiversity outcomes of individual protected areas or OECMs. 579
580
581
Scale What is Measured Strengths (+) and Weaknesses (-) “Are area-based
conservation efforts in the right place?”
Global and regional
1. Coverage of species, especially species at risk 2. Coverage of ecoregions 3. Coverage of ‘important’
areas, such as Key Biodiversity Areas
Can assess broad extent and examine cost per unit area of meeting area-based conservation targets
Robust methods to establish appropriate counterfactuals that control for bias - Coarse scale that might not be adequate
of local planning
- Inaccuracies in global data sets
“What is the ecological condition of a protected area or OECM?” Individual sites
1. Species population time series trends
2. Measures of ecological integrity or health
Accurate and precise
Can include Traditional Ecological Knowledge where available
- Costly and requires considerable scientific input for both design and analysis - There is no other substitute for this kind
of overall assessment “What is the ecological condition of area-based conservation efforts?” Individual sites, aggregated to national, regional and global scales
1. Species population time series trends
2. Presence of key species or functional groups (e.g. predators, pollinators) 3. Change in the state of an
environmental condition (e.g. forest cover, fish biomass)
4. Changes in cumulative human pressure
Human pressures are often useful proxies for broad-scale biodiversity impacts Often cheap and non-invasive (e.g.
derived from satellites) - Often miss important drivers of
biodiversity loss (e.g. disease, pollution, poaching) and do not always explain local or regional biodiversity patterns - Often difficult to develop appropriate
counterfactual scenarios to assess what conditions would have been like in the absence of protection
“Is the management of area-based conservation effective?” Individual sites, aggregated to national, regional and global scales
1. Resource adequacy (e.g. staff, training, funding) 2. Adequacy of planning and
enforcement
Established assessment frameworks and methodologies that can be conducted rapidly
Growing coverage of global protected area estate
- Database established but at present does not record assessment results, only that assessments have taken place
- Most methodologies were not designed to measure biodiversity outcomesof protected areas and OECMs
30
Supplementary figures and tables
582
Figure S1. The terrestrial protected area network overlaid on a global map of biomass and
583
soil carbon. 584
Table S1. Threatened birds, amphibians and mammals who remain without any formal
585
protection as of 2019. 586
Table S2 Protected area coverage (%) of terrestrial ecoregions in 2010 and 2019.
587
Table S3 Growth in coverage of terrestrial ecoregions as the global protected area estate
588
expanded between 2010 and 2019. 589
31
References
590
1 Watson, J. E. M., Dudley, N., Segan, D. B. & Hockings, M. The performance and 591
potential of protected areas. Nature 515, 67-73, doi:10.1038/nature13947 (2014). 592
2 Dudley, N., Shadie, P. & Stolton, S. Guidelines for applying protected area 593
management categories. (International Union for the Conservation of Nature,, 594
Gland, Switerland, 2008). 595
3 Garnett, S. T. et al. A spatial overview of the global importance of Indigenous lands 596
for conservation. Nature Sustainability 1, 369-374, doi:10.1038/s41893-018-0100-6 597
(2018). 598
4 Stolton, S., Redford, K. H. & Dudley, N. The Futures of Privately Protected Areas. 599
(Gland, Switzerland, 2014). 600
5 Dudley, N. et al. The essential role of other effective area-based conservation 601
measures in achieving big bold conservation targets. Global Ecology and 602
Conservation 15, e00424 (2018).
603
6 Donald, P. F. et al. The prevalence, characteristics and effectiveness of Aichi Target 604
11′ s “other effective area‐based conservation measures”(OECMs) in Key Biodiversity 605
Areas. Conservation Letters, e12659 (2019). 606
7 IUCN WCPA. Guidelines for Recognising and Reporting Other Effective Area-based 607
Conservation Measures. (Switzerland, 2019). 608
8 UN General Assembly. Transforming our world : the 2030 Agenda for Sustainable 609
Development, 21 October 2015, A/RES/70/1, available at: 610
https://www.refworld.org/docid/57b6e3e44.html. (2015). 611
9 Convention on Biological Diversity. COP 10 Decision X/2: Strategic Plan for 612
Biodiversity 2011–2020, available at: http://www.cbd.int/decision/cop/?id=12268. 613
(2011). 614
10 IPBES. Summary for policymakers of the global assessment report on biodiversity 615
and ecosystem services of the Intergovernmental Science-Policy Platform on 616
Biodiversity and Ecosystem Services. (IPBES secretariat, Bonn, Germany, 2019). 617
11 UNEP-WCMC & IUCN. World Database on other effective area-based conservation 618
measures (WD-OCEM) [On-line]. (UNEP-WCMC, Cambridge, UK 2019). 619
12 Schulze, K. et al. An assessment of threats to terrestrial protected areas. 620
Conservation Letters 11, doi:10.1111/conl.12435 (2018).
621
13 Klein, C. J. et al. Shortfalls in the global protected area network at representing 622
marine biodiversity. Scientific Reports 5, doi:10.1038/srep17539 (2015). 623
14 Venter, O. et al. Bias in protected‐area location and its effects on long‐term 624
aspirations of biodiversity conventions. Conservation Biology 32, 127-134 (2018). 625
15 Mouillot, D. et al. Global marine protected areas do not secure the evolutionary 626
history of tropical corals and fishes. Nature Communications 7, 627
doi:10.1038/ncomms10359 (2016). 628
16 Butchart, S. H. M. et al. Shortfalls and Solutions for Meeting National and Global 629
Conservation Area Targets. Conservation Letters 8, 329-337, doi:10.1111/conl.12158 630
(2015). 631
32 17 Juffe-Bignoli, D. et al. Achieving Aichi Biodiversity Target 11 to improve the
632
performance of protected areas and conserve freshwater biodiversity. Aquatic 633
Conservation: Marine and Freshwater Ecosystems 26, 133-151,
634
doi:10.1002/aqc.2638 (2016). 635
18 Maron, M., Simmonds, J. S. & Watson, J. E. M. Bold nature retention targets are 636
essential for the global environment agenda. Nature Ecology & Evolution 2, 1194-637
1195, doi:10.1038/s41559-018-0595-2 (2018). 638
19 Geldmann, J. et al. Changes in protected area management effectiveness over time: 639
A global analysis. Biological Conservation 191, 692-699, 640
doi:10.1016/j.biocon.2015.08.029 (2015). 641
20 Di Minin, E. & Toivonen, T. Global Protected Area Expansion: Creating More than 642
Paper Parks. Bioscience 65, 637-638, doi:10.1093/biosci/biv064 (2015). 643
21 Gill, D. A. et al. Capacity shortfalls hinder the performance of marine protected areas 644
globally. Nature 543, 665-669, doi:10.1038/nature21708 (2017). 645
22 Coad, L. et al. Widespread shortfalls in protected area resourcing undermine efforts 646
to conserve biodiversity. Frontiers in Ecology and the Environment 17, 259-264, 647
doi:10.1002/fee.2042 (2019). 648
23 Visconti, P. et al. Protected area targets post-2020. Science 364, 239-241, 649
doi:10.1126/science.aav6886 (2019). 650
24 Barnes, M. D., Glew, L., Wyborn, C. & Craigie, I. D. Prevent perverse outcomes from 651
global protected area policy. Nature Ecology & Evolution 2, 759-762, 652
doi:10.1038/s41559-018-0501-y (2018). 653
25 Dinerstein, E. et al. A Global Deal For Nature: Guiding principles, milestones, and 654
targets. Science Advances 5, eaaw2869 (2019). 655
26 Noss, R. F. et al. Bolder Thinking for Conservation. Conservation Biology 26, 1-4, 656
doi:10.1111/j.1523-1739.2011.01738.x (2012). 657
27 Wilson, E. O. Half-Earth: Our Planet's Fight for Life. (Liveright Publishing Corporation, 658
2016). 659
28 O'Leary, B. C. et al. Effective Coverage Targets for Ocean Protection. Conservation 660
Letters 9, 398-404, doi:10.1111/conl.12247 (2016).
661
29 Bull, J. W. et al. Net positive outcomes for nature. Nature Ecology & Evolution, 662
doi:10.1038/s41559-019-1022-z (2019). 663
30 Mace, G. M. et al. Aiming higher to bend the curve of biodiversity loss. Nature 664
Sustainability 1, 448-451, doi:10.1038/s41893-018-0130-0 (2018).
665
31 Watson, J. E. M. & Venter, O. A global plan for nature conservation. Nature 550, 48-666
49, doi:10.1038/nature24144 (2017). 667
32 Dinerstein, E. et al. An Ecoregion-Based Approach to Protecting Half the Terrestrial 668
Realm. BioScience 67, 534-545, doi:10.1093/biosci/bix014 (2017). 669
33 Spalding, M. D. et al. Marine Ecoregions of the World: A Bioregionalization of Coastal 670
and Shelf Areas. BioScience 57, 573-583, doi:10.1641/b570707 (2007). 671
34 UNEP-WCMC IUCN and NGS. Protected Planet Report 2018. (Cambridge UK; Gland, 672
Switzerland; and Washington, D.C., USA., 2018). 673
33
35 Rodrigues, A. S. L. et al. Global Gap Analysis: Priority Regions for Expanding the 674
Global Protected-Area Network. BioScience 54, 1092-1100, doi:10.1641/0006-675
3568(2004)054[1092:ggaprf]2.0.co;2 (2004). 676
36 Venter, O. et al. Targeting global protected area expansion for imperiled biodiversity. 677
Plos Biology 12, e1001891, doi:10.1371/journal.pbio.1001891 (2014).
678
37 Tittensor, D. P. et al. A mid-term analysis of progress toward international 679
biodiversity targets. Science 346, 241-244 (2014). 680
38 Runge, C. A. et al. Protected areas and global conservation of migratory birds. 681
Science 350, 1255-1258, doi:10.1126/science.aac9180 (2015).
682
39 Brum, F. T. et al. Global priorities for conservation across multiple dimensions of 683
mammalian diversity. Proceedings of the National Academy of Sciences 114, 7641-684
7646 (2017). 685
40 IUCN. The IUCN Red List of Threatened Species. Version 2019-2. Available at: 686
http://www.iucnredlist.org. Downloaded on 10 September 2019. (2019). 687
41 O'Hara, C. C., Villaseñor-Derbez, J. C., Ralph, G. M. & Halpern, B. S. Mapping status 688
and conservation of global at-risk marine biodiversity. Conservation Letters 12, 689
e12651, doi:10.1111/conl.12651 (2019). 690
42 Stevenson, S. L., Woolley, S. N. C., Barnett, J. & Dunstan, P. Testing the presence of 691
marine protected areas against their ability to reduce pressures on biodiversity. 692
Conservation Biology 1, 1-32, doi:10.1111/cobi.13429 (2019).
693
43 Watson, J. E. M. et al. Persistent disparities between recent rates of habitat 694
conversion and protection and implications for future global conservation targets. 695
Conservation Letters 9, 413-421, doi:10.1111/conl.12295 (2016).
696
44 Spalding, M. D., Agostini, V. N., Rice, J. & Grant, S. M. Pelagic provinces of the world: 697
A biogeographic classification of the world’s surface pelagic waters. Ocean & Coastal 698
Management 60, 19-30 (2012).
699
45 IUCN. A Global Standard for the Identification of Key Biodiversity Areas, Version 1.0., 700
(Gland, Switzerland, 2016). 701
46 Jones, K. R. et al. The location and protection status of Earth’s diminishing marine 702
wilderness. Current Biology 28, 2506-2512. e2503 (2018). 703
47 Allan, J. R., Venter, O. & Watson, J. E. Temporally inter-comparable maps of 704
terrestrial wilderness and the Last of the Wild. Scientific Data 4, 170187 (2017). 705
48 Watson, J. E. M. et al. The exceptional value of intact forest ecosystems. Nature 706
Ecology & Evolution 2, 599-610, doi:10.1038/s41559-018-0490-x (2018).
707
49 Di Marco, M., Ferrier, S., Harwood, T. D., Hoskins, A. J. & Watson, J. E. M. Wilderness 708
areas halve the extinction risk of terrestrial biodiversity. Nature 573, 582-585, 709
doi:10.1038/s41586-019-1567-7 (2019). 710
50 Martin, T. G. & Watson, J. E. M. Intact ecosystems provide best defence against 711
climate change. Nature Climate Change 6, 122-124, doi:10.1038/nclimate2918 712
(2016). 713
51 Watson, J. E. et al. Catastrophic declines in wilderness areas undermine global 714
environment targets. Current Biology 26, 2929-2934 (2016). 715
52 Stolton, S. & Dudley, N. Arguments for Protected Areas. (Earthscan 2010). 716