HAL Id: lirmm-00487231
https://hal-lirmm.ccsd.cnrs.fr/lirmm-00487231
Submitted on 28 May 2010
HAL is a multi-disciplinary open access
archive for the deposit and dissemination of
sci-entific research documents, whether they are
pub-lished or not. The documents may come from
teaching and research institutions in France or
abroad, or from public or private research centers.
L’archive ouverte pluridisciplinaire HAL, est
destinée au dépôt et à la diffusion de documents
scientifiques de niveau recherche, publiés ou non,
émanant des établissements d’enseignement et de
recherche français ou étrangers, des laboratoires
publics ou privés.
Large-Scale Studies
Maxime Galan, Emmanuel Guivier, Gilles Caraux, Nathalie Charbonnel,
Jean-François Cosson
To cite this version:
Maxime Galan, Emmanuel Guivier, Gilles Caraux, Nathalie Charbonnel, Jean-François Cosson. A
454 Multiplex Sequencing Method for Rapid and Reliable Genotyping of Highly Polymorphic Genes
in Large-Scale Studies. BMC Genomics, BioMed Central, 2010, 11 (1), pp.296-310.
�10.1186/1471-2164-11-296�. �lirmm-00487231�
Open Access
M E T H O D O L O G Y A R T I C L E
Bio
Med
Central
© 2010 Galan et al; licensee BioMed Central Ltd. This is an Open Access article distributed under the terms of the Creative CommonsAttribution License (http://creativecommons.org/licenses/by/2.0), which permits unrestricted use, distribution, and reproduction inany medium, provided the original work is properly cited.
Methodology article
A 454 multiplex sequencing method for rapid and
reliable genotyping of highly polymorphic genes
in large-scale studies
Maxime Galan*
1, Emmanuel Guivier
1, Gilles Caraux
2,3, Nathalie Charbonnel
1and Jean-François Cosson
1Abstract
Background: High-throughput sequencing technologies offer new perspectives for biomedical, agronomical and evolutionary research. Promising progresses now concern the application of these technologies to large-scale studies of genetic variation. Such studies require the genotyping of high numbers of samples. This is theoretically possible using 454 pyrosequencing, which generates billions of base pairs of sequence data. However several challenges arise: first in the attribution of each read produced to its original sample, and second, in bioinformatic analyses to distinguish true from artifactual sequence variation. This pilot study proposes a new application for the 454 GS FLX platform, allowing the individual genotyping of thousands of samples in one run. A probabilistic model has been developed to demonstrate the reliability of this method.
Results: DNA amplicons from 1,710 rodent samples were individually barcoded using a combination of tags located in forward and reverse primers. Amplicons consisted in 222 bp fragments corresponding to DRB exon 2, a highly polymorphic gene in mammals. A total of 221,789 reads were obtained, of which 153,349 were finally assigned to original samples. Rules based on a probabilistic model and a four-step procedure, were developed to validate sequences and provide a confidence level for each genotype. The method gave promising results, with the genotyping of DRB exon 2 sequences for 1,407 samples from 24 different rodent species and the sequencing of 392 variants in one half of a 454 run. Using replicates, we estimated that the reproducibility of genotyping reached 95%. Conclusions: This new approach is a promising alternative to classical methods involving electrophoresis-based techniques for variant separation and cloning-sequencing for sequence determination. The 454 system is less costly and time consuming and may enhance the reliability of genotypes obtained when high numbers of samples are studied. It opens up new perspectives for the study of evolutionary and functional genetics of highly polymorphic genes like major histocompatibility complex genes in vertebrates or loci regulating self-compatibility in plants. Important applications in biomedical research will include the detection of individual variation in disease susceptibility. Similarly, agronomy will benefit from this approach, through the study of genes implicated in productivity or disease susceptibility traits.
Background
Highly polymorphic genes constitute a major component of the functional genetics of biota. They are involved in many crucial functions including the regulation of self incompatibility in plants [1,2], fungi [3] and marine inver-tebrates [4], immunity in verinver-tebrates [5,6] or insects [7],
sex-determination in insects [8,9] and disease resistance in plants [10]. By definition, such genes display a very high number of alleles/variants within a single population or a single species, and many individuals are heterozy-gous for these genes. For instance, exon 2 of the MHC class II gene DRB has 878 variants in humans and dis-plays an excess of heterozygotes within populations IMGT/HLA database,[11]. Another feature is their mode of evolution, promoting interspecific polymorphism MHC, [12]. This makes them particularly interesting in the study of community genetics e.g. [13,14].
Further-* Correspondence: [email protected]
1 INRA EFPA, UMR CBGP (INRA/IRD/Cirad/Montpellier SupAgro), Campus international de Baillarguet, CS 30016, F-34988 Montferrier-sur-Lez cedex, France
more, the potential involvement of highly polymorphic genes in inter-specific interactions outcomes may pro-mote the emergence/persistence of biodiversity through speciation or diversifying selection processes [14-17].
Despite their important roles in genetics and evolution, in the context of medicine or agronomy, highly polymor-phic genes are seldom studied within population and community genetics. In non-model organisms, one major limitation is the difficulty of genotyping high numbers of individuals. Highly polymorphic genes are, by definition, prone to display numerous, extremely diverse variants as well as many heterozygotes within populations, which can hardly be genotyped using direct sequencing. The direct sequencing of amplicons would often result in the superposition of two very different sequences, giving mostly unreadable electropherograms. Sequencing must therefore be preceded by the separation of the two copies (for diploids) of the gene. For the classical Sanger method, a previous step of cloning is necessary, which is expensive and time consuming. Alternative methods rely on the indirect characterisation of sequence variability and involve capillary electrophoresis single-strand con-formation polymorphism (CE-SSCP), denaturing gradi-ent gel electrophoresis (DGGE), high resolution melting curve analysis (HRMCA), PCR using sequence-specific primers (PCR-SSP), oligonucleotide chips or other related techniques see e.g. [18-23]. However, these indi-rect methods are not fully informative because of the non-negligible rates of homoplasy, i.e. preventing differ-ent variants from being distinguished based on sequence conformation e.g. [24]. Moreover, they do not provide the nucleotide sequences, thus precluding many analyses in evolutionary and functional genetics. Cloning the target sequences into bacteria and sequencing different clones using the Sanger approach, so as to recover the different variants, may be required to further analyze relationships between migration patterns and sequences e.g. [25]. Such approaches are expensive and time consuming and require many clones to be sequenced for each sample in order to guarantee a high probability of including all vari-ants e.g. [26]. Cloning-sequencing is often unaffordable for population and community studies, which require several hundreds of individuals to be genotyped.
Over the last five years, the development of high-throughput genomic sequencing technologies has opened up new and exciting perspectives in evolutionary studies, biomedicine and agronomy [27]. The 454 GS FLX (Roche) platform, for instance, allows the reading of 100 bp- to 500 bp-fragments. Unlike the classical Sanger method, the 454 technology includes an emulsion polymerisation chain reaction (emPCR) before the pyrosequencing step [28]. This stage allows the isolation of each DNA strand before sequencing, just as in the cloning-sequencing approach. This feature is of
particu-lar interest in the characterization of genetic variability of single highly polymorphic and multi-copy genes, for which many very different variants may co-occur within individuals. The main limitation of the 454 methods remains the high cost of each run (between 7,000 and 20,000 euros). This cost is, however, compensated by the high number of reads produced in one run [> 1 million reads (see Table 1 for definition), [29]]. It is thus theoreti-cally possible to genotype a high number of individuals. Such large-scale pyrosequencing of genes has been applied to detect SNPs and small deletions and inser-tions: for example those potentially involved in hereditary diseases and cancers [30]. However, the genetic variation observed in the mentioned study was not reattributed to original samples. Large-scale pyrosequencing is thus a promising approach, provided that each read produced may be reliably attributed to its original sample. In this way, Babik et al. [31] have applied the 454 technology to genotype 96 individuals at the MHC class II DRB gene. Different solutions have been proposed recently to allow a posteriori attribution of the sequences produced. One straightforward way to recover the original sample of a given sequence is to use nucleotide barcodes. They con-sist in short nucleotide sequences called 'tags' fixed at the extremity of DNA strands. These tags must produce a unique barcode for each sample. Those are either ligated to DNA fragments to be sequenced [32], or are included directly in the 5' end of the primers for sequencing ampli-cons (i.e. tagged-primer in [33]). For both approaches, the number of different tags to be synthesized is equal to the number of samples to be genotyped. By contrast, the method designed by Bierne et al. [34] for cloning-sequencing studies is based on the combination of tags in
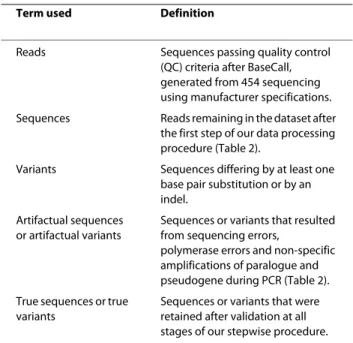
Table 1: Definition of the terms used.
Term used Definition
Reads Sequences passing quality control (QC) criteria after BaseCall, generated from 454 sequencing using manufacturer specifications. Sequences Reads remaining in the dataset after
the first step of our data processing procedure (Table 2).
Variants Sequences differing by at least one base pair substitution or by an indel.
Artifactual sequences or artifactual variants
Sequences or variants that resulted from sequencing errors,
polymerase errors and non-specific amplifications of paralogue and pseudogene during PCR (Table 2). True sequences or true
variants
Sequences or variants that were retained after validation at all stages of our stepwise procedure.
the forward and reverse primers. Only n sets of primers are thus required for the coding of n2 samples. This
approach has recently been applied to 454 sequencing system [35].
Here we describe a 454 approach that shows similari-ties with the one developed by Babik et al. [31], but that is optimized for the analysis of thousands of individuals in a single region of a 454 plate. Using one half of a 454 run, we were able to barcode PCR amplicons from 1710 sam-ples of rodents, corresponding to 24 species. We used combinations of tagged primers, for a nuclear gene that is known to be highly polymorphic in mammals, the MHC class II DRB gene for a review see [36]. Amplicons were multiplexed for the emPCR to produce a high number of reads in a single run. The tagged primers also allowed a posteriori attribution of most reads to their sample of ori-gin. We then proposed a stepwise procedure for data analysis and variant validation. Sequences containing errors have previously been shown to occur in some reads during 454 sequencing [37]. Those needed to be distinguished from correct sequences. We developed a probabilistic model to provide a confidence level for each genotype observed. This model will also be useful for optimizing the number of samples to be multiplexed in one 454 run.
Methods
Samples and DNA extractions
The experiment was based on 1710 rodent tissue samples (either toes or lungs) collected between 2001 and 2008 in Europe, Southeast Asia and Caribbean islands. These samples corresponded to 1614 individual rodents belong-ing to 24 different species and 11 genera. Reproducibility of the genotyping was estimated for 96 samples that had been randomly chosen from the dataset and processed twice for the entire procedure.
DNA was extracted from the 1710 samples using 18 plates of the DNeasy Tissue Kit (Qiagen) following the manufacturer's recommendations. Various steps of the experiment were carried out using rigorous laboratory protocols to prevent contamination by alien DNA and amplicons. PCR plates were prepared in a DNA-free room and under a sterile hood. We systematically used filter tips for the different steps of DNA extraction and PCR. The absence of contamination was checked at this stage and along the whole laboratory procedure using three negative controls per extraction plate. They corre-sponded to one extraction blank (extraction without sam-ple tissue), one PCR blank (a tube with PCR mix without DNA) and one aerosol blank (a PCR blank with the cap open during the whole manipulation).
The total DNA set was then divided into two sets of 855 DNA samples, referred to as Pool A and Pool B. These pools were independently analyzed using the same
com-bination of barcodes. This allowed the relative efficiency of the different barcodes to be determined.
Tagged primer design, PCRs and sequencing
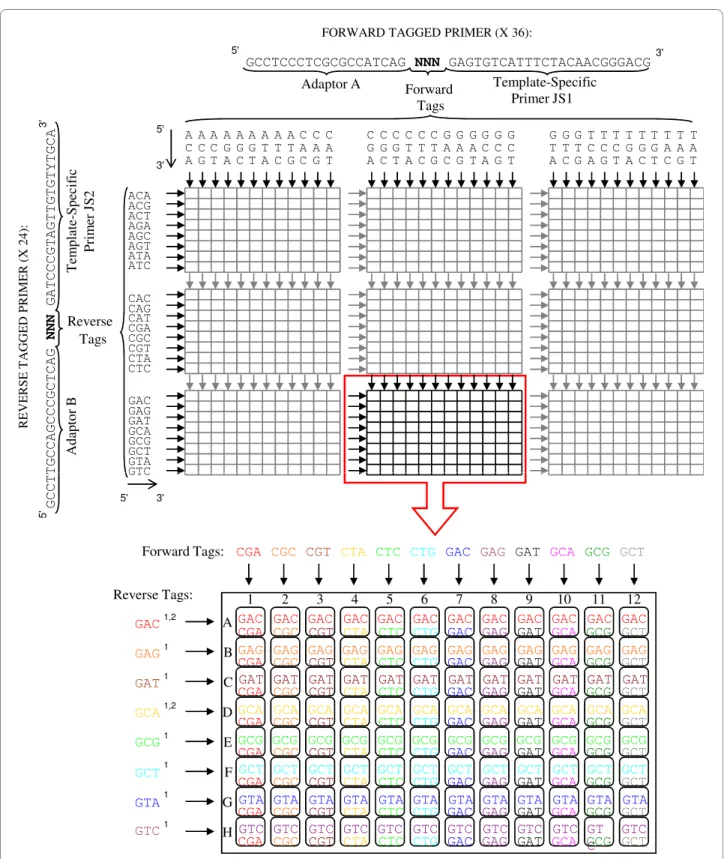
We used the target-specific primers developed by Schad et al. [38] to analyze exon 2 of the DRB gene in rodents. These primers are JS1 (Forward 5'-GAGTGTCATTTC-TACAACGGGACG-3') and JS2 (Reverse 5'-GATCCCG-TAGTTGTGTYTGCA-3'). They amplify a 171 bp fragment (excluding primers) of exon 2 from the DRB gene in several mammal species [38]. One or several cop-ies can be amplified with this set of primers depending on the rodent species considered (e.g. a single copy in Apo-demus sp. [39], duplicated copies in Gerbillurus paeba [40] and M. glareolus [41]). There was no prior knowl-edge on DRB variability and duplication for all species studied except M. glareolus and Apodemus sp. in our experiment. These primers were modified by adding a short 3 bp sequence (the tag) and 19 bp adaptors to the 5' ends of JS1 ('A': 5'-GCCTCCCTCGCGCCATCAG-3') and JS2 ('B': 5'-GCCTTGCCAGCCCGCTCAG-3'). These adaptors were required for the emPCR and 454 pyrose-quencing (see Figure 1). The key sequence TCAG at the 3' ends of both adaptors A and B, which were used during the BaseCall step as a quality control (QC) measure to validate the reads. Primers were synthesized by Eurogen-tec and purified using the standard selective precipitation optimized process (SePOP).
We designed 36 different tags for the forward primers, and 24 different tags for the reverse primers (see details in Figure 1). This leads to 864 potential unique combina-tions of forward and reverse tags. Samples were individu-ally barcoded during the preparation of the PCR plates. Thirty-six forward primers were dispensed into the plates 'vertically', so that each row contained a different forward primer, while the 26 reverse primers were dispensed 'hor-izontally', with wells in each column containing a differ-ent reverse primer (Figure 1). Thus, each well harboured a single, unique 6-bp barcode through the combination of forward and reverse tags.
PCRs were carried out in a 25 μL reaction volumes con-taining 2 mM MgCl2, 100 μM dNTPs, 0.1 μM of each primer and 0.75 U AmpliTaq Gold® (Applied Biosystems)
in the appropriate 1× PCR Buffer II and de-ionized DNA-and RNA-free water. DNA samples were added to this reaction mix in a separate room to avoid DNA contami-nation. DNA (1.5 μL, i.e. nearly 40 ng) was added to each well. The PCR was optimized through touchdown proto-col. Samples were subjected to initial denaturation at 95°C for 15 min, followed by 10 cycles of denaturation at 94°C for 30 s, annealing with touchdown at 65°C to 55°C (-1°C/cycle) for 30 s and extension at 72°C for 30 s, fol-lowed by 30 cycles of denaturation at 94°C for 30 s, annealing at 55°C for 30 s and extension at 72°C for 30 s,
Figure 1 Design of the barcoding system. 36 forward and 24 reverse tags were dispensed into nine 96-well plates producing 864 unique
combi-nations of 6-nucleotide sequences named barcodes. 1: reverse tags forming a homopolymer GG with the "key" sequence. 2: reverse tags that could not be recovered because of homopolymer formation (see text for more details).
5'
GCCTCCCTCGCGCCATCAG NNN GAGTGTCATTTCTACAACGGGACG3' Forward
Tags
FORWARD TAGGED PRIMER (X 36):
Template-Specific Primer JS1 Adaptor A Ada p to r B Tem p late-S pecif ic Pr im er J S 2 R E VER S E T A GGED P R IMER (X 2 4 ): T GCCAGCCCGCTCAG NNN GATCCCGTAGTTGTGTYTGCA 3' Reverse Tags A C A C A C A G A G A G A T A T A T C A C A C A A G T A C T A C G C G T A C T A C G C G T A G T C G C G C G C T C T C T G A G A G A G C G C G C ACA ACG ACT AGA AGC AGT ATA ATC CAC CAG CAT CGA CGC CGT CTA CTC GAC GAG GAT GCA GCG GCT GTA GTC G T A G T C G T G T C A T C G T C T T G A T G C T G T T A C T A G T A T 5' 3' 5' GCCT T Forward Tags: Reverse Tags: GTC
CGA CGC CGT CTA CTC CTG GAC GAG GAT GCA GCG GCT
1 2 3 4 5 6 7 8 9 10 11 12 A B C D E F G H GAC1,2 GAG1 GAT1 GCA1,2 GCG1 GCT1 GTA1 GTC1
GAC GAC GAC GAC GAC GAC GAC GAC GAC GAC GAC GAC
CGA CGC CGT CTA CTC CTG GAC GAG GAT GCA GCG GCT
GAG GAG GAG GAG GAG GAG GAG GAG GAG GAG GAG GAG
CGA CGC CGT CTA CTC CTG GAC GAG GAT GCA GCG GCT
GAT GAT GAT GAT GAT GAT GAT GAT GAT GAT GAT GAT
CGA CGC CGT CTA CTC CTG GAC GAG GAT GCA GCG GCT
GCA GCA GCA GCA GCA GCA GCA GCA GCA GCA GCA GCA
CGA CGC CGT CTA CTC CTG GAC GAG GAT GCA GCG GCT
GCG GCG GCG GCG GCG GCG GCG GCG GCG GCG GCG GCG
CGA CGC CGT CTA CTC CTG GAC GAG GAT GCA GCG GCT
GCT GCT GCT GCT GCT GCT GCT GCT GCT GCT GCT GCT
CGA CGC CGT CTA CTC CTG GAC GAG GAT GCA GCG GCT
GTA GTA GTA GTA GTA GTA GTA GTA GTA GTA GTA GTA
CGA CGC CGT CTA CTC CTG GAC GAG GAT GCA GCG GCT
GTC GTC GTC GTC GTC GTC GTC GTC GTC GTC GT C
GTC
CGA CGC CGT CTA CTC CTG GAC GAG GAT GCA GCG GCT
with a final extension phase at 72°C for 10 min. PCR products (5 μL) were checked on a 1.5% agarose gel. The remaining PCR products were sent to Cogenics™ Genome Express where pyrosequencing was carried out using a 454 GS FLX System (Roche Diagnostics GmbH/454 Life Sciences Corporation).
All PCR products were analyzed using the LabCHIP® 90
system and DNA CHIP 5 K from Caliper Life Science. This microfluidic electrophoresis allows fragment size and individual amplicon concentration, excluding primer and dNTP residues, to be determined. As described above, two equimolar pools (Pool A and Pool B) of ampli-cons were produced. To eliminate unspecific products, the two pools were run on an agarose gel and purified by gel excision of fragments of 260 bp ± 12 bp. The quality of the pools were checked by size range analysis using a DNA 1000 Assay on the 2100 Bioanalyzer (Agilent Tech-nologies) and quantified by fluorescent measurement using the Quant-it™ Picogreen® DNA assay (Invitrogen).
The emPCR, corresponding to clonal amplification of the purified amplicon pool, was carried out using the GS emPCR Kit II (Roche Diagnostics GmbH). Briefly, ampli-cons were immobilized onto DNA capture beads. The amplicon-beads obtained were added to a mixture of amplification mix and oil and vigorously shaken on a Tis-sue Lyser (Qiagen) to create "micro-reactors" containing both amplification mix and a single bead. Emulsion was dispensed into a 96-well plate and the PCR amplification program was run according to the manufacturer's recom-mendations. Following amplification, the emulsion was chemically broken and the beads carrying the amplified DNA library were recovered and washed by filtration. Positive beads were purified using the biotinylated primer A (complementary to adaptor A), which binds to strepta-vidin-coated magnetic beads. The DNA library beads were then separated from the magnetic beads by melting the double-stranded amplification products, leaving a population of bead-bound single-stranded template DNA fragments. The sequencing primer was then annealed to the amplified single-stranded DNA. Lastly, beads carry-ing amplified scarry-ingle-stranded DNA were counted with a Z2™ Cell Counter (Beckman Coulter).
Pools A and B were simultaneously processed in one GS FLX run using one half of a 70 × 75 mm Pico-Titer plate device (Roche Diagnostics GmbH) and one GS LR-70 sequencing kit (Roche Diagnostics GmbH). Briefly, the 70 × 75 mm Pico-Titer plate was divided in four sections (one corresponding to Pool A, one to Pool B and two to another pyrosequencing project) using the Medium Regions Bead Loading Gasket (Roche Diagnostics GmbH). According to the manufacturer's recommenda-tions for amplicon sequencing, 250,000 DNA beads were loaded for each pool mixed with an appropriate volume of packing beads and enzyme beads. After the Pre-Wash
run, the sequencing run was started with the "Full Analy-sis for Amplicon" parameter set.
Bioinformatics and data processing
A non-negligible number of errors are generated during PCR [42] and pyrosequencing [37]. Non-specific amplifi-cation may also occur. We thus developed a stepwise data processing procedure aimed at detecting and discarding most of the reads that exhibit sequencing errors or that correspond to genes other than the targeted gene (see objectives and rationales, Table 2). This procedure relied on three assumptions. First, reads with errors were expected to appear at lower frequencies than reads with-out errors in the whole dataset and for each individual sample. This assumption was validated using a probabi-listic approach. Considering the probability of substitu-tion errors, the probability of artifactual variants (that arose from substitution errors) occurring in our dataset was ≈ 0.11, and the probability of observing three times the same artifactual variant is very low, p1 ≈ 10-8
(Addi-tional Information [see Addi(Addi-tional file 1]). Second, reads exhibiting indels with lengths that are not multiples of three base pairs were considered as artifacts because they would induce shifts in the reading frame. Third, the reli-ability of the genotype obtained for a given individual sample should depends mainly on the number of sequences obtained for this sample and on the number of copies of the gene in the species studied.
Our validation procedure involved four consecutive steps (Table 2). Briefly, the first cleaning step allowed removal of most imperfect reads from the dataset (reads with incomplete primers or barcodes, reads correspond-ing to sequences that were observed only once in the entire dataset and reads exhibiting indels of sizes that were not multiples of three base pairs). The next two steps were based on thresholds under which the number or frequency of sequences obtained per sample was insuf-ficient to provide reliable genotypes. Rationales and pro-cedures for establishing these thresholds are described below. The last step involved the alignment of remaining sequences using Mega 4.0 [43]. This step allowed the detection and elimination of sequences that corre-sponded to pseudogenes, paralogs and recombinant chi-meric sequences originating from a mixture of sequences of two different variants e.g. for chimeric sequences pro-duced during PCR see [42]. Paralogs and pseudogenes were then identified using nucleotide blast against all sequencing data available in Genbank (default parame-ters).
Basic statistics and genetic diversity
We calculated simple statistics for the whole dataset and independently for pools A and B. Statistical parameters took into account the total number of reads (R), the total
number of sequences (N), the total number of variants (A) and the number of sequences obtained for each vari-ant j (Nj). These same statistical principles were applied
for each individual sample i as the total number of sequences (Ni), the number of variants (Ai), the number of sequences for each variant j (Nij) and the frequency of each variant (Fij), corresponding to Nij/Ni.
Thresholds for genotype and variant validation
We then determined a confidence level for each geno-type. The rationales for this was that (i) a minimal num-ber of sequences are required for reliable genotyping; and (ii) true variants must be sequenced several times within the same sample in order to be validated and distin-guished from artifactual variants (Table 1). We first defined the threshold T1, corresponding to the minimal number of sequences required per individual to deter-mine its complete genotype, with a low probability of missing variants. We computed the probability of ampli-fying at least r times all the variants of the gene studied
for a given sample. This probability was based on n, the total number of true sequences obtained for the sample, and m, the maximal number of variants for the gene within a sample. The value m depends on the number of gene copies and on the degree of ploïdy of the studied organism. For instance, m = 2 for a single copy of a nuclear gene within a diploid genome, and m = 4 for a duplicated nuclear gene within a diploid genome, or for a single-copy nuclear gene in a tetraploïd genome, and so on. A program is now freely available on the web http:// www.lirmm.fr/~caraux/Bioinformatics/NegativeMulti-nomial/ to calculate the probability f(r,m,n) of having at least r sequences of each of the m variants potentially observed within the n sequences of a given sample. Here, we considered and discussed different values for r (1, 3, 5 and 10) and for m (2, 4, 6 and 8).
We then defined a second threshold, T2, to eliminate
artifactual variants that arose from substitution errors. Based on our initial assumptions and in accordance with the results of our probabilistic calculations (Additional
Table 2: Objectives and rationales for each step of the data processing procedure to validate variants and genotypes.
Steps Objectives Rationales
1 Remove reads with incomplete barcode information. Reads cannot be assigned to any individual.
Remove reads that display imperfect match with the primers. An imperfect match with primers may cause a shift in the reading frame and/or errors in the barcode.
Remove sequences that are unique within the pool. Unique sequences probably result from sequencing errors (first assumption). This step reduced the dataset and then facilitated subsequent data analyses. Note that this step may be relaxed for small datasets (unique sequences will also be removed during Step 3).
Remove reads that display indels that are not multiples of three base pairs.
Such indels probably result from sequencing errors (second assumption). Note that this step may be relaxed when focusing on non-functional genes.
2 Remove samples with a low number of sequences. A low number of sequences may induce an incomplete genotyping (second assumption).
The minimum number of sequences required to obtain a reliable genotype is estimated taking into account the number of copies amplified for the gene studied (threshold 1).
3 Remove variants with a low number of sequences for a given sample.
Variants represented only rarely within samples probably result from sequencing errors (first assumption).
The minimum number of sequences required to validate a given variants of an individual genotype is estimated from the distribution of variant frequencies for the given sample (threshold 2).
4 Remove variants that do not correspond to the gene studied, using sequence alignment.
Some inconsistencies may still exist in the dataset such as recombinant chimeric sequences originating from a mixture of the sequences of two different alleles, [42], pseudogenes or paralogs, which can occur at high frequencies within individual samples.
Information [see Additional file 1]), artifactual variants should occur at much lower frequencies than true vari-ants. We therefore analyzed the distribution of variant frequencies calculated individually for each sample (Fij, see above). We expected multinomial-shaped distribu-tions with one peak at very low frequency values corre-sponding to artifactual variants and several peaks at medium-high frequency values corresponding to true variants. These peaks should include a very high fre-quency peak (about 90-100%), corresponding to homozy-gous samples, and one or more peaks of medium frequency values (30 to 50%), corresponding to heterozy-gous samples. Ideally, the threshold value T2 should be chosen to discard most of the artifactual variants and none (or very few) of the true variants.
Validation and efficiency of the method
We analyzed the efficiency of barcoding by comparing the number of sequences obtained for each tag between pools A and B. We used a one way ANOVA with the number of sequences as an independent variable, and the reverse tag, the forward tag and the pool as dependent qualitative variables. All two-way interactions were tested and removed when not significant. This analysis was per-formed on the dataset obtained after the first step of the data processing. The number of sequences was log-trans-formed to normalize its distribution. Post-hoc pairwise comparisons were performed with the Tukey-Kramer method. We then compared the genotypes obtained for the 96 replicated samples to investigate the reproducibil-ity of the genotyping. Finally, we examined the distribu-tion of the frequency of true and artifactual variants within samples (Fij). All analyses were performed using GENSTAT 7.1 (Lawes Agricultural Trust, Rothamstead). Results
None of the 54 blanks were found to be positive after PCR amplification. We obtained 221,789 quality control (QC) reads overall (R), with RA = 91,467 for pool A and RB = 130,322 for pool B. This difference between pools was probably attributed to the difference in DNA concentra-tion between pool purificaconcentra-tions, which was 0.83 and 1.84 ng/μL for pools A and B, respectively.
Data processing
Step 1
The first step was the detection and suppression of most of the imperfect reads (Table 2). We had some difficulties in determining sequence using reverse tags starting with base G. These tags formed a homopolymer GG with the "key" sequence (e.g. 5'-TCAG-GNN-3'). In this case it appears that the G of the tag was removed altogether with the key sequence during the data processing with the GS-FLX Data Analysis Software, creating a shift of one base
in tag and sequence reading. This problem was encoun-tered for eight reverse tags (see Figure 1). We performed an ad hoc analysis, focusing on the two last bases of the tags, allowing sequence information to be recovered for six of the eight tags. After the elimination of imperfect reads, the number of sequences per variant displayed an L-shaped distribution (Figure S1 [see Additional file 2]). The number of reads that could be assigned to variants in each pool were 63,841 and 89,508, corresponding to 10,420 and 9,427 variants, in pools A and B, respectively. We found 7,686 variants (74%) and 5,985 variants (64%) to occur only once in datasets A and B, respectively. The minimum and maximum numbers of sequences assigned per variant were 1 and 2,513 sequence(s) per variant in pool A, and 1 and 12,688 in pool B. Variants occurring only once and variants containing indels were then removed from both datasets. This considerably reduced the datasets and facilitated further bioinformatic manip-ulations.
At the end of the first step, we had NA = 53,661 and NB = 81,627 sequences, corresponding to AA = 2,322 and AB = 2,833 variants for pools A and B, respectively. Altogether, about 33% of the reads were eliminated in the first step. Over the 855 samples studied in each pool, we succeeded in assigning sequences for 745 of them in pool A and 764 in pool B. The number of sequences obtained for each sample strongly depended on the sample considered (Fig-ure S2 [see Additional file 2]). Averages of sequences per sample were respectively NAi = 65.6 (min. = 0, max. = 207) and NBi = 82.7 (min. = 0, max. = 297) for pools A and B. Overall we did not obtain any sequence for 201 samples. This was explained for 54 samples by low amplicon con-centrations observed before pooling (< 1 ng/μl) and prob-ably resulting from poor DNA conservation. For the 144 other samples, the reverse tag sequence could not be recovered because of the formation of a homopolymer with the sequencing key (see above).
Step 2
The aim of the second step was to provide a confidence level for each genotype produced. We estimated the probability of amplifying at least r times all the different variants of the gene studied for a given sample. This prob-ability depended on n, the total number of true sequences obtained for the sample, and m, the maximal number of variants for the gene within a sample (see the Materials and Methods section). We then plotted the probability f(r,m,n) against the number of sequences n for different values of r and m (Figure S3 [see Additional file 2]). As expected, we observed that for a given probability, n must be increased when r and m values increase. That means that to achieve a given confidence level, more sequences per sample (n) are required when the number of copies amplified of the gene under study (m) increases, or when
the number of sequences required for validating an vari-ant as true (r) increases. To further analyze our results, we fixed the r-value to three. This value was based on sta-tistical considerations. Actually, we showed that the probability of observing three times the same artifactual sequence was very low, p1 ≈ 10-8 (see Additional
Informa-tion [AddiInforma-tional file 1]). Moreover it also corresponded to the standard procedure in MHC gene studies where three independent observations of the same sequence are rec-ommended to validate a variant that has been identified through a cloning-sequencing approach see [44]. Further-more, our approach allows choosing any other value of r and x, depending on particular characteristics (e.g. num-ber of samples and numnum-ber of sequences for each sample) in other experiments.
The threshold T1 (i.e. the minimal number of sequences required for reliable genotyping) was then calculated for r = 3, giving a confidence level of 10-3 (Figure 2).
Simula-tions showed the threshold value T1 ranged from T1 = 19
for a single copy gene in diploid species to T1 = 104 for an octaploid species, or for a quadruplicated gene in a dip-loid species. In a similar way, T1 = 46 for a single copy gene in tetraploid species or for a duplicated gene in a diploid species. Samples with a number of sequences n <T1 were then removed from the dataset, as their geno-types were not considered to be reliable. At this stage, 75 samples were removed from the dataset, corresponding to 5% of the samples.
Step 3
The third step involved separating true from artifactual variants within each sample, based on the frequency of variants within samples (Fij). We plotted the distribution of Fij after grouping data based either on the number of
copies of the DRB gene (Figure 3) or on taxonomy (Figure S4 [see Additional file 3]). All distributions obtained dis-played the expected multimodal shape, with three peaks corresponding to frequencies of 1-4%, 30-60% and 80-100%. A few exceptions were detected, however. Maxo-mys, in which the DRB gene is quadruplicated, showed no variants in the 80-100% range, consistent with the absence of homozygotes. By contrast, Niviventer showed a low occurrence of variants in the 30-60% range, associ-ated with a high occurrence of homozygotes. For the other species, we fixed the threshold T2 value to 4%. All variants with Fij <T2 in a given sample i were removed from the sample i, being considered as artifactual within the particular sample. By the end of this step, 48,294 sequences, corresponding to 600 variants, were con-served for pool A and 68,413 sequences, corresponding to 354 variants, were conserved for pool B. This step allowed the mean number of variants per sample to be
reduced from 12 to 2.5, suggesting that most of the arti-factual variants had been removed from the dataset.
Step 4
The sequences of the remaining variants were aligned separately for each sample, and analyzed by eye (Figure S5 for illustration [see Additional file 3]). We detected pseudogenes that were orthologous to the RT1-Hb gene of the laboratory rat Rattus norvegicus. We also found variants that were orthologous to the DQB gene, a para-log of the DRB gene, belonging to the same MHC class II multigenic family. Recombinant chimeric sequences were quite common in the dataset, occurring at high frequen-cies (up to 10%) in some samples. They were easily detected in alignments because their sequences origi-nated from a mixture of the sequences of two different, true variants occurring in the same sample. After remov-ing those non-specific variants from the data set, the number of sequences became lower than T1 (see Step 2) for 27 samples. Those samples were then eliminated, as their genotypes were not considered to be reliable.
At the end of our data processing procedure, 1407 sam-ples were reliably genotyped (following our criteria) over the 1710 initially processed (201 samples removed at Step 1, 75 at Step 2 and 27 at Step 4). Moreover, 45,038 sequences and 251 variants had been retained in pool A, as where 65,836 sequences and 147 variants in pool B. Overall, 392 different variants were characterized and sequenced, with an average of 277 sequences per variant (min: 5; max: 12,688). Of the 392 variants finally validated by our data processing for exon 2 of the DRB gene, 36 had been previously reported in GenBank (Myodes: 15; Arvi-cola: 12; Apodemus: 8; Rattus: 1).
Barcode bias
The ANOVA conducted on the numbers of sequences remaining after step 1 (i.e. after removing tags affected by the homopolymer problem) was significant (F112,1394 = 2.857, P < 10-4). The interaction between the two factors,
"forward tags" and "reverse tags", could not be statistically tested in the ANOVA. The analysis showed significant differences between pools (P = 3 × 10⁻⁴) and between
for-ward tags (P < 10-4). The use of forward tags CAC and
CGC resulted in lower numbers of sequences, whereas TCA, TCT and TGT led to higher numbers of sequences (Figure S6 [see Additional file 2]). Interactions between pools and tags were significant and showed that differ-ences between tags were not consistent between pools (Forward tags, P = 6 × 10⁻³; Reverse tags, P < 10-4). The
lower numbers of sequences obtained for the forward tags CAC and CGC were only significant in pool B. Among reverse tags, GCT was associated with the lowest number of sequences in pool A, whereas CAC had the lowest number of sequences of all the other tags in pool
B. Thus, despite finding some significant differences, no systematic bias could be related to tag sequences.
Genotype reliability
Among the 96 replicated samples, only 66 were success-fully genotyped twice by the end of our bioinformatics procedure. Unfortunately, the 30 other samples could not be genotyped twice due to the formation of homopoly-mers by particular tags (see above). Of these 66 samples, 63 displayed the same genotype in both replicates. The three samples showing non-identical genotypes were heterozygous for one replicate and homozygous (with a drop in one of the two variants) for the other. In one case, the 'missing' variant had been amplified, but its frequency within the sample (2%) was lower than the T2 threshold value (4%). Overall, the reproducibility of our genotyping was 95%.
Further analysis allowed the examination of 12,022 sequences, corresponding to 953 variants. True variants
accounted for 84 ± 8% (mean ± S.E.%) of the sequences produced within samples, substitutions (1 or 2 bp) accounted for 6 ± 5%, insertions (1 or 2 bp) for 2 ± 3%, deletions (1 or 2 bp) for 4 ± 9%, chimeras for 6 ± 7% and other genes (pseudogenes and paralogs) for 1 ± 2%.
Efficiency of the method
We were able to genotype 1,407 rodent samples from 24 different species at a confidence level of 10-3. Maxomys
and Niviventer genera showed the lowest genotyping suc-cess rate (18% and 56%, respectively; Table 3). The qua-druplication of the DRB gene in Maxomys (up to 7 variants were observed in some individuals) may account for most of the difficulties in genotyping these animals. However, Niviventer seemed to have a high occurrence of null alleles, with many individuals producing only a small number of sequences, and most other individuals being homozygotes (Table 3). The genotyping success rate was fairly high, generally above 90%, for all other species.
Figure 2 Confidence level of genotyping. f is the probability of amplifying, at least three times, all the different variants of the gene studied for a
given sample. This probability depends on n, the total number of sequences per sample, and m, the maximal number of variants for the gene within a sample. T1 is the threshold value that corresponds to the minimal number of sequences required per individual to determine a complete genotype,
Discussion
Recent development of high-throughput genomic sequencing, considerably reducing the costs of sequenc-ing, has opened up new perspectives for modern biology [45]. Here, we report a new laboratory procedure allow-ing the multiplexallow-ing and sequencallow-ing of one or several PCR amplicons for hundreds of samples in only one 454 run, allowing most of the reads generated to be attributed to their samples of origin. Data processing procedure and probabilistic model were developed for the validation of new variants and the estimation of confidence levels for each genotype produced. These procedures gave promis-ing results, resultpromis-ing in the successful genotyppromis-ing of 1407 rodent samples from 24 different species, and the sequencing of 392 different variants of the DRB gene (exon 2) in only one half of a standard 454 picotiter plate. Replicates confirmed the high reproducibility (over 95%) of this genotyping method.
Comparison with other methods
The method described here is particularly suitable for the determination of genotypes and sequences for highly
variable and potentially multiplicated genes. For example, the high level of variant diversity observed for exon 2 of the DRB gene in Myodes glareolus (71 variants) prevents the use of classical methods like SSCP and DGGE. These methods are based on differences in migratory patterns during electrophoresis. As they do not directly provide information on the variant sequences, they are subject to homoplasy (i.e. the same pattern for different variants), thus preventing complete resolution for variants exhibit-ing a similar conformation or related sequences e.g. [46]. Nevertheless, these methods are useful for datasets con-taining a restricted set of variant forms e.g. in endangered species, [47,48]. They may be inadequate, however, for use in population genomics/genetics, involving large datasets of thousands of individuals. Indeed, in this study, it is unlikely that as many as 392 variants, or even the 71 variants identified for the bank vole Myodes glareolus, would have been distinguishable on the basis of their migratory patterns. Alternatives such as PCR-SSP, which is based on amplification using primers that are specific to a group of variants, were developed to overcome this
Figure 3 Histograms showing the distributions of Fij, the frequency of each variant j within each individual sample i. Data were grouped as
a function of m, the maximal number of variants for the gene within a sample: (A) for m = 2, (B) for m = 4 and (C) for m = 8. Histograms on the right display the distributions for values below ten percent: (D) for m = 2, (E) for m = 4 and (F) for m = 8.
N u mber of seq uence s A B D E 0 2000 4000 6000 8000 10000 12000 14000 0 2000 4000 6000 8000 10000 12000 14000 0 500 1000 1500 2000 2500 3000 3500 0 1000 2000 3000 4000 5000 6000 7000 8000 9000 m = 2 m = 2
Myodes glareolus m = 4 Myodes glareolus m = 4
N u mber of seq uence s A B 0 2000 4000 6000 8000 10000 12000 14000 0 2000 4000 6000 8000 10000 12000 14000 0 500 1000 1500 2000 2500 3000 3500 0 1000 2000 3000 4000 5000 6000 7000 8000 9000 m = 2 m = 2
Myodes glareolus m = 4 E Myodes glareolus m = 4
D C F 0 0 50 100 150 200 250 300 10 20 30 40 50 60 70 80 90 100 0 0 10 20 30 40 50 60 70 80 90 2 4 6 8 10
Maxomys suriffer m = 8 Maxomys suriffer m = 8
C 0 0 50 100 150 200 250 300 10 20 30 40 50 60 70 80 90 100 0 0 10 20 30 40 50 60 70 80 90 2 4 6 8 10
Maxomys suriffer m = 8 Maxomys suriffer m = 8
F
technical constraint e.g. [20,21,49]. However, in addition to a poor resolution (variants within groups cannot be distinguished), PCR-SSP requires a priori knowledge of all the variant forms present in the population under study. As oligonucleotide chips, it is thus not suitable for most studies on non-model organisms. In our study, only 36 of 392 variants reported were already deposited in GenBank. Based on these observations, the reproducibil-ity of our genotyping (estimated at 95%) was very satisfac-tory. The reproducibility of the classical methods described above is unlikely to ever approach this high value. Moreover, at least a part, if not all, of our failed results could be due to the low specificity of our primers for some variants, rather than to our genotyping method. Another disadvantage of using these indirect methods for variant characterization is the difficulties encountered to compare datasets generated in different laboratories, or in the same laboratory but at different times. Such com-parisons require complementary techniques to relate the migration patterns, obtained using different machines or laboratories, to a given allelic form. Such limitations inev-itably preclude meta-analyses. Lastly, indirect methods additionally require many PCR products to be sequenced in order to link the sequence to a particular migration pattern and thus to establish the migration patterns
asso-ciated with particular allelic forms. In cases involving dif-ferent allelic forms in the same individual, or in cases where the genes are duplicated or when selection favours heterozygotes [50], further manipulations are often needed before sequencing, such as gel excision or clon-ing. These additional manipulations are time-consuming and costly.
The 454 system overcomes most of these limitations by making the variant sequences directly available during genotyping. Furthermore, the variant does not need to be isolated before sequencing. Indeed, the 454 methodology includes emPCR, which separates the different DNA strains during the first processing steps. Consequently, the datasets can be studied without limitations concern-ing the number of variants to be detected and without any prior knowledge of the allelic forms present. Datasets from different laboratories may then be easily concate-nated for the purpose of meta-analyses. This approach is suitable for genotyping individuals harboring high num-bers of allelic forms. Other methods based on 454 system have been developed previously and show some similari-ties with ours. Babik et al. [31] carried out a 454 run to genotype 96 rodents Myodes glareolus at exon 2 of the DRB gene. They used 96 different tags and carried out 96 different purifications (i.e. as many tags and purifications
Table 3: Genetic variation in exon 2 sequences of the DRB gene observed for 1,407 rodent samples from 24 species and 11 genera. Rodent Genera Number of DRB copy amplified Number of analysed samples Replicates Genotyped (p = 0.999) Heterozygotes genotyped Number of variant Mean number of sequences per variant Nb % Nb % Nb % Pool A Myodes 2 650 33 5.1 602 93 495 82.2 71 834 Arvicola 1 49 2 4.1 49 100 36 73.5 13 324 Microtus 1 40 2 5.0 36 90 29 80.6 7 403 Apodemus 1 44 3 6.8 42 95 39 92.9 50 70 Pool B Rattus 1 417 19 4.6 388 93 248 63.9 110 233 Mus 1 147 8 5.4 134 91 110 82.1 53 171 Niviventer 1 78 5 6.4 44 56 9 20.5 15 172 Bandicota 1 58 4 6.9 51 88 39 76.5 21 154 Berylmys 1 37 4 10.8 36 97 25 69.4 19 122 Leopoldamys 1 24 1 4.2 21 88 14 66.7 12 121 Maxomys 4 22 2 9.1 4 18 4 100.0 21 37 Total 1,566 83 5.3 1,407 90 1,048 74.5 392 277
as samples). By comparison, our method requires only a single purification step after DNA pooling, and a far smaller number of tags than samples for barcoding. Moreover we did not need to perform a library to ligate the adaptator prior to the emPCR. This reduces the num-ber of steps (and so potential errors) during the labora-tory experiment, and also greatly reduces the total cost of the experiment (probably of a third).
Variants and genotype validation
In contrast to previous studies, our data processing relied on a probabilistic model to establish clear and objective thresholds for sequence and genotype validation. Other studies have described alternative criteria. Babik et al. [31] validated variants on the basis of their frequency within individuals. They considered variants with an observed frequency lower than 3% as artifacts, and thus removed them from the dataset. Variants were also vali-dated based on their dissimilarity with the four most commonly found variant in a given sample. The valida-tion score decreased when the similarity increased. This filter did not include the detection of chimeras, since chi-meras are very dissimilar from both parent variants and may occur at a non-negligible frequency within individu-als. In our study, we found chimeras to occur at a mean frequency of 6%. Such limitations in the variant valida-tion procedure could partly explain the high number of variants per individual reported for Myodes glareolus in the previous study (up to 18 different variants validated in a single individual). Using our data validation procedure, chimeras are discarded in the last step involving sequence alignment and blast analyses. Another validation crite-rion used by Babik et al. [31] was the need for a sequence to occur in at least two different samples. This criterion could lead to the removal of many variants that are rare in populations. Such a bias may lead to misinterpretation of the principal mode of selection operating on the gene under study, or of the demographic tendencies of the population under study. Indeed, rare variants may be indicative of certain types of selection or demographic events. For example, population expansion, purifying selection or selective sweeps may result in an excess of rare variants [51,52]. Our variant validation procedure overcomes the problem of discarding rare variants because it analyzes each sample separately. Our proce-dure should also provide reliable results in cases where a given variant may be an artifact in one sample but a true variant in another sample. Another improvement of our validation process is that we describe a statistically based approach for determining a threshold (number of sequences per sample) for validating genotypes. The value of this threshold T2 may be redefined according to the number of copies of the amplified gene and to the ploidy level of the species studied. Our findings clearly
illustrate this point. Indeed, the number of sequences per sample was sufficient for genotyping most of our rodents with the exception of Maxomys that displays multiple copies of the gene. Finally we recommend the systematic use of replicates for each 454 run, allowing the reproduc-ibility of the genotyping procedure and, thus, the reliabil-ity of the run, to be estimated.
Optimizing tagging and sample numbers
Our barcoding method led to 69% of the reads obtained being assigned to samples. This proportion is lower than the >95% reported by Binladen et al. [33] and Meyer et al. [32], who used alternative barcoding methods. The effi-ciency of our method could probably be improved by using a Titanium kit (Roche Diagnostics GmbH) that pro-vide longer reads. We estimated that 9% of the reads that were unassigned were too short and did not encompass the full length of the sequence for exon 2 of the DRB gene. An estimated 8% of unassigned reads were attrib-uted to the use of tags that form homopolymers GG with the key sequence (i.e. 2 of 24 reverse tag sequences could not be recovered as described above). It should thus be of utmost importance to exclude such tags from the experi-ment. Additionally, our criteria for the validation of reads in the first step of data processing may have been too stringent. The search for perfect matches with the com-plete primer sequences probably led to the elimination of a large number of reads. This criterion was established to discard reads that could present subsequent shifts in the reading frame of the tag (Table 2). Alternatively, a perfect match with only 5 to 10 bp of 5' sequences of the primers may have been sufficient to discard reads associated with reading frame shifts, and may have therefore allowed more reads to be assigned to samples. Finally, it may be possible to reduce the probability of incorrectly assigning reads to a sample due to sequencing errors within the tags. It is widely advised to use tags that differ by more than one substitution [53]. However, this reduces the number of combinations and thus the number of samples that can be multiplexed. Increasing the number of nucle-otides within tags could counterbalance this limitation.
The probabilistic model that we developed may be used for optimizing the 454 run. When designing a 454 run, it is important to take into account the fact that intcreasing the number of samples results in fewer reads being retrieved for each of them. The optimal number of sam-ples to be multiplexed for genotyping with a given level of confidence can be determined by simulating data before the run. The number of copies in the genome for the gene of interest must first be fixed, as well as the confidence level required. The model will then generate the number of sequences required per sample to give this confidence level. The number of reads guaranteed by the provider divided by the number of sequences generated by the
model will then give the optimal number of samples to be multiplexed.
Conclusions
We have described a method for barcoding and multi-plexing hundreds of PCR-amplicons using half of a 454 plate. We were able to reassign about 69% of the reads generated to their sample of origin. The high number of reads obtained for each sample then allowed the geno-type of each sample to be generated. We then used a probabilistic model allowing variant validation and attri-bution of a confidence level for each genotype based on several objective criteria. Using this approach, we obtained genotypes for exon 2 of the DRB gene in 1,407 samples from 1,374 rodents, belonging to 24 species. The DRB gene is a highly variable coding gene that may be duplicated several times in mammalian genomes.
This method may be improved in several ways. First, using longer tags may increase the proportion of reads that are finally assigned to their sample of origin, increase the number of samples multiplexed and decrease the risk of misassignment. Second, the number and order of the different filters (i.e. Steps 1 to 4 of our processing) may be modified and threshold values (T1 and T2) adapted to spe-cific studies and genes. Here we applied three different filters that are very different by nature. The first filter (during Step 1) is related to the occurrence of variants within the whole dataset. It consists in withdrawing all the variants occurring only once in the dataset, which considering our criteria would not have been validated at the end of the process in any case. The second filter (dur-ing Step 2, T1) is related to the number of sequences yielded for each sample. It allows the elimination of sam-ples (not variants) displaying too few sequences to be reli-ably genotyped according to our probabilistic model. The third filter (during Step 3, T2) is related to the number of sequences obtained for each variant within each sample. It consists in withdrawing variants that are present in low frequency within the samples. It should be noted that we decided to withdraw all variants occurring only once in the data set at the very beginning of our processing mainly for practical reasons. This considerably reduced the size of the dataset (13,671 variants could be with-drawn over a total of 19,847, i.e. a reduction of 69% in size of the data set) and greatly facilitated further manipula-tions. Yet this filter may be unnecessary because unique sequences will be in any case removed during Step 3. Besides we found logical to remove samples with too low numbers of sequences (that would not have been consid-ered in the final set of genotypes in any case) before try-ing to discriminate true from artifactual variants within samples. This was done because our main objective was to get as many reliable genotypes as possible. This filter
may not be optimal for other purposes, like acquiring as many variants (not genotypes) as possible for phyloge-netic analyses, for instance. Lastly, the probabilistic model that we developed may allow the number of sam-ples multiplexed in one 454 run to be optimized, as a function of the confidence level required for each geno-type. The probabilistic approach proposed here may be improved in order to take into account biases in PCR-errors and yields. Our probabilities strongly depend on restrictive hypotheses (considering that all events have the same probability to occur whatever the nucleotide changes and sites considered). In this respect, our approach may provide null expectations for PCR-bias testing. Non-random processes in PCR-errors and yields like unequal probabilities of nucleotide changes, PCR-competition among variants and errors hotspots may (at least in theory) induce significant departures from our predictions. In our paper we provide a rough estimate of the probability of substitution errors based on our data (see Additional Information [Additional file 1]). More accurate estimates may result from inclusion of internal controls (i.e. variants of known sequences), which should be systematically incorporated in future experiments. Moreover, because most PCR-biases are expected to depend on data (i.e. organisms, genes, variants ...) as well as experiments (i.e. chemicals, laboratories ...), we think that more realistic models should further be based on the use of internal controls for model selection and parame-ter estimation. In the meanwhile we recommend com-pensating for such potential biases by choosing a high theoretical level of reliability for genotyping (99.9%) within our neutral model. Finally, an automated bioinfor-matics pipeline based on our stepwise procedure is cur-rently being developed and will be available to other projects that may benefit from this genotyping approach. We believe that this methodology will be very useful for evolutionary and functional studies in the near future. Additional material
Additional file 1 Additional Information. Probabilities of observing
arti-factual sequences by substitution errors. Probability f(r,m,n) of observing at least r sequences of each of the m variants potentially observed for the n sequences of a given sample.
Additional file 2 Fig S1, Fig S2, Fig S3, Fig S6. Figure S1. Histograms
showing the number of sequences obtained for individual variants (Nj) for pools A and B. Insets display distributions for values below fifty. Figure S2. Histograms of the number of sequences obtained for each sample (Ni) after the first step of data processing for pools A and B. Figure S3. Confidence level for genotyping. f is the probability of amplifying, at least r times, all the different variants of the gene studied for a given sample. This probability depends on n, the total number of sequences by sample, and m, the maxi-mal number of variants for the gene within a sample. T1 is the threshold
value that corresponds to the minimal number of sequences required per individual to determine its complete genotype, with a 10-3 probability of missing variants. Plots are given for different values of r = 1, 2, 5 and 10.
Fig-ure S6. The number of sequences obtained for each forward and reverse
Authors' contributions
The study was conceived and designed by MG, and was coordinated by NC and JFC. NC, GC and JFC performed the statistical analyses. MG and EG carried out the molecular biology procedures, the sequence alignment and the valida-tion of the 454 sequencing data. GC devised the probabilistic program. MG and JFC wrote the manuscript. GC, EG and NC helped to draft the manuscript. All authors have read and approved the final manuscript.
Acknowledgements
We thank S Morand and JP Hugot for managing research projects in Asia, H Hentonnen for research projects in Europe, and Y Chaval for help in field work. JF Martin and N Bierne provided helpful comments on laboratory protocols, J Serret helped in some laboratory experiments and E Meglécz helped for bioin-formatics. R Streiff gave constructive comments on early drafts and L Manso-Silván improved the style of written English. This work was supported by the Institut National de la Recherche Agronomique [Projet innovant du départem-ent EFPA 2008], the French National Agency for Research project CERoPath [00121 0505, 07 BDIV 012] and the European project EDEN [GOCE-CT-2003-010284]. E Guivier was funded by a MNRT (Ministère de l'Education Nationale, de la Recherche et de la Technologie) PhD grant. The manuscript is catalogued by the EDEN steering Committee as EDEN0171
http://www.eden-fp6project.net.
Author Details
1INRA EFPA, UMR CBGP (INRA/IRD/Cirad/Montpellier SupAgro), Campus international de Baillarguet, CS 30016, F-34988 Montferrier-sur-Lez cedex, France, 2Laboratoire d'Informatique de Robotique et de Microélectronique de Montpellier (LIRMM) CNRS: UMR5506 - Université Montpellier II - Sciences et Techniques du Languedoc, France and 3Montpellier SupAgro, 2 Place Pierre Viala, F-34060 Montpellier, France
References
1. McCubbin AG, Kao T-h: Molecular mechanisms of self-incompatibility.
Current Opinion in Biotechnology 1996, 7:150-154.
2. Charlesworth D, Awadalla P: Flowering plant self-incompatibility: The molecular population genetics of Brassica S-loci. Heredity 1998, 81:1-9. 3. Wu J, Saupe SJ, Glass NL: Evidence for balancing selection operating at the het-c heterokaryon incompatibility locus in a group of filamentous fungi. Proceedings of the National Academy of Sciences 1998,
95:12398-12403.
4. Buss LW: Competition within and between encrusting clonal invertebrates. Trends in Ecology and Evolution 1990, 5:352-356. 5. Takahata N, Satta Y, Klein J: Polymorphism and balancing selection at
major histocompatibility complex loci. Genetics 1992, 130:925-938. 6. Klein J: Origin of major histocompatibility complex polymorphism: the
trans-species hypothesis. Human Immunology 1987, 19:155-162. 7. Obbard DJ, Callister DM, Jiggins FM, Soares DC, Yan G, Little TJ: The
evolution of TEP1, an exceptionally polymorphic immunity gene in
Anopheles gambiae. BMC Evolutionary Biology 2008, 8:274.
8. Charlesworth D: Sex determination: Balancing selection in the honey bee. Current Biology 2004, 14:R568-R569.
9. Cho S, Huang ZY, Green DR, Smith DR, Jianzhi J Zhang: Evolution of the complementary sex-determination gene of honey bees: Balancing selection and trans-species polymorphisms. Genome Research 2006, 16:1366-1375.
10. Jones JDG: Putting knowledge of plant disease resistance genes to work. Current Opinion in Plant Biology 2001, 4:281-287.
11. Robinson J, Waller MJ, Fail SC, McWilliam H, Lopez R, Parham P, Marsh SG: The IMGT/HLA database. Nucleic Acids Research 2009, 37:D1013-1027. 12. Edwards SV, Chesnut K, Satta Y, Wakeland EK: Ancestral polymorphism of
Mhc class II genes in mice: implications for balancing selection and the mammalian molecular clock. Genetics 1997, 146:655-668.
13. Blais C, Fiset D, Arguin M, Jolicoeur P, Bub D, Gosselin F: Reading between eye saccades. PLoS One 2009, 4:e6448.
14. Eizaguirre C, Lenz TL, Traulsen A, Milinski M: Speciation accelerated and stabilized by pleiotropic major histocompatibility complex immunogenes. Ecology Letters 2009, 12:5-12.
15. Klein J, Sato A, Nikolaidis N: MHC, TSP, and the origin of species: from immunogenetics to evolutionary genetics. Annual Review of Genetics 2007, 41:281-304.
16. Nasrallah JB: Recognition and rejection of self in plant self-incompatibility: comparisons to animal histocompatibility. Trends in
Immunology 2005, 26:412-418.
17. Liu Z, Bos JI, Armstrong M, Whisson SC, da Cunha L, Torto-Alalibo T, Win J, Avrova AO, Wright F, Birch PR, Kamoun S: Patterns of diversifying selection in the phytotoxin-like scr74 gene family of Phytophthora
infestans. Molecular Biology and Evolution 2005, 22:659-672.
18. Bryja J, Galan M, Charbonnel N, Cosson JF: Analysis of MHC class II gene in voles using CE-SSCP. Molecular Ecology Notes 2005, 5:273-276. 19. Loiseau C, Richard M, Garnier S, Chastel O, Julliard R, Zoorob R, Sorci G:
Diversifying selection on MHC class I in the house sparrow (Passer
domesticus). Molecular Ecology 2009, 18:1331-1340.
20. Ellis SA, Staines KA, Stear MJ, Hensen EJ, Morrison WI: DNA typing for BoLA class I using sequence-specific primers (PCR-SSP). European
Journal of Immunogenetics 1998, 25:365-370.
21. Wei H, Wang H, Hou S, Hu S, Fan K, Fan X, Zhu T, Guo Y: DRB genotyping in cynomolgus monkeys from China using polymerase chain reaction-sequence-specific primers. Human Immunology 2007, 68:135-144. 22. Zhou L, Vandersteen J, Wang L, Fuller T, Taylor M, Palais B, Wittwer CT:
High-resolution DNA melting curve analysis to establish HLA genotypic identity. Tissue antigens 2004, 64:156-164.
23. Susskind B: Methods for histocompatibility testing in the early 21st century. Current Opinion in Organ Transplantation 2007, 12:393-401. 24. Bryja J, Charbonnel N, Berthier K, Galan M, Cosson JF: Density-related
changes in selection pattern for major histocompatibility complex genes in fluctuating populations of voles. Molecular Ecology 2007, 16:5084-5097.
25. Bryja J, Galan M, Charbonnel N, Cosson JF: Duplication, balancing selection and trans-species evolution explain the high levels of polymorphism of the DQA MHC class II gene in voles (Arvicolinae).
Immunogenetics 2006, 58:191-202.
26. Gouy de Bellocq J, Delarbre C, Gachelin G, Morand S: Allelic diversity at the Mhc-DQA locus of woodmouse populations (Apodemus sylvaticus) present in the islands and mainland of the northern Mediterranean.
Global ecology and biogeography 2005, 14:115-122.
27. Ellegren H: Sequencing goes 454 and takes large-scale genomics into the wild. Molecular Ecology 2008, 17:1629-1635.
28. Margulies M, Egholm M, Altman WE, Attiya S, Bader JS, Bemben LA, Berka J, Braverman MS, Chen YJ, Chen Z, et al.: Genome sequencing in microfabricated high-density picolitre reactors. Nature 2005, 437:376-380.
29. Wegner KM: Massive parallel MHC genotyping: titanium that shines.
Molecular Ecology 2009, 18:1818-1820.
30. Bordoni R, Bonnal R, Rizzi E, Carrera P, Benedetti S, Cremonesi L, Stenirri S, Colombo A, Montrasio C, Bonalumi S, et al.: Evaluation of human gene variant detection in amplicon pools by the GS-FLX parallel Pyrosequencer. BMC Genomics 2008, 9:464.
31. Babik W, Taberlet P, Ejsmond MJ, Radwan J: New generation sequencers as a tool for genotyping of highly polymorphic multilocus MHC system. Molecular Ecology Research 2009, 9:713-719.
32. Meyer M, Stenzel U, Myles S, Prufer K, Hofreiter M: Targeted high-throughput sequencing of tagged nucleic acid samples. Nucleic Acids
Research 2007, 35:e97.
Additional file 3 Fig S4, Fig S5. Figure S4. Histograms showing the
distri-butions of Fij, the frequency of each variant j within each individual sample i.
Data were grouped as a function of rodent genera. m is the maximal num-ber of variants for the gene within a sample. Figure S5. True and artifactual variants of DRB exon 2 for a black rat (Rattus rattus). The two variants vali-dated by our data processing are shown in green and blue, respectively. We obtained 36 sequences for the variant highlighted in green and 26 for the blue variant. Other variants are artifactual (n = 20). Variants corresponding to a mixture of blue and green correspond to recombinant chimeric sequences derived from a mixture of sequences of DRB*003 and DRB*006. Other artifactual variants corresponded to substitutions (sites in red,
DRB*532, DRB*926, DRB*438, DRB*1412 and DRB*1636), indel (DRB*1653),
pseudogenes orthologous to RT1-Hb (DRB*462) and the paralog DQB (DRB*1008).
Received: 28 September 2009 Accepted: 11 May 2010 Published: 11 May 2010
This article is available from: http://www.biomedcentral.com/1471-2164/11/296 © 2010 Galan et al; licensee BioMed Central Ltd.
This is an Open Access article distributed under the terms of the Creative Commons Attribution License (http://creativecommons.org/licenses/by/2.0), which permits unrestricted use, distribution, and reproduction in any medium, provided the original work is properly cited.