HAL Id: hal-01925638
https://hal.archives-ouvertes.fr/hal-01925638
Submitted on 20 Jul 2020HAL is a multi-disciplinary open access archive for the deposit and dissemination of sci-entific research documents, whether they are pub-lished or not. The documents may come from teaching and research institutions in France or abroad, or from public or private research centers.
L’archive ouverte pluridisciplinaire HAL, est destinée au dépôt et à la diffusion de documents scientifiques de niveau recherche, publiés ou non, émanant des établissements d’enseignement et de recherche français ou étrangers, des laboratoires publics ou privés.
the decline of a practice with time-use surveys
Marie Plessz, Fabrice Etilé
To cite this version:
Marie Plessz, Fabrice Etilé. Is cooking still a part of our eating practices? Analysing the decline of a practice with time-use surveys. Cultural Sociology, SAGE Publications (UK and US), 2019, 13 (1), pp.93- 118. �10.1177/1749975518791431�. �hal-01925638�
https://doi.org/10.1177/1749975518791431
Cultural Sociology 2019, Vol. 13(1) 93 –118 © The Author(s) 2018 Article reuse guidelines: sagepub.com/journals-permissions DOI: 10.1177/1749975518791431 journals.sagepub.com/home/cus
Is Cooking Still a Part of Our
Eating Practices? Analysing
the Decline of a Practice with
Time-Use Surveys
Marie Plessz
Centre Maurice Halbwachs (CMH), EHESS, ENS, CNRS, PSL Research University, and INRA, France
Fabrice Étilé
Paris School of Economics and INRA, France
Abstract
People now spend less time doing housework in general, and cooking in particular. So is cooking still a central feature of our daily eating practices? This article compares trends in household cooking durations in France and the USA in the period 1985–2010 using time-use surveys and practice theory. We ask how the association between cooking and eating at home has changed over time, and how it has contributed to the decline in the time spent on household cooking. Descriptive statistics show that US households spent 20 minutes less time per day cooking in 2010 than in 1985 (15 minutes less time per day in France). Linear regressions indicate that the association between cooking duration and the number of eating events at home has declined in the USA but not in France. The Blinder-Oaxaca decomposition method points to this fact as the primary reason for the change in cooking time in the USA; in France, decreased cooking time is accounted for primarily by changes in population characteristics. French and American food practices have followed gradually diverging trajectories, with cooking less a feature of eating practices – even at home – in the USA, whereas the association between eating and preparing food at home remains stable in France.
Keywords
Blinder-Oaxaca decomposition, cooking, cultural change, decline, eating, theories of practice, time-use survey
Corresponding author:
Marie Plessz, CMH, 48 boulevard Jourdan, 75014 Paris, France. Email: marie.plessz@inra.fr
Introduction
Despite the growing media interest in professional and amateur cooking (Caraher et al., 2000), the amount of time devoted to preparing food at home has declined in all western societies surveyed over the past decades (Gershuny and Harms, 2016; Sullivan and Gershuny, 2001; Warde et al., 2007).
The word ‘decline’ has largely negative connotations – even when the focus is posi-tive, it remains normative: public policies encourage us to quit smoking or limit alco-hol consumption, for example. Analysing a decline as a situation indicative of social change assists with the adoption of a relatively neutral stance. In the framework of practice theories (presented later in this article), cultural change can be seen as the rise, decline or change in a vast array of practices (Shove et al., 2012). It is often unclear, however, whether the decline should be analysed as a change in the practice itself, or as changing relations between several practices. Typically, the decline in cycling to work can only be understood in relation to a growth in travel by car, with more afford-able vehicles and streets increasingly designed for their use (Watson, 2012). Moreover, some trends are simply by-products of other changes – typically changes in population characteristics. This was shown for commensality in Belgium: its decline was mostly because more people lived alone, whereas people not living alone continued to eat with other household members (Mestdag and Glorieux, 2009). Statistical techniques such as the Blinder-Oaxaca decomposition can identify two ‘sources of historical change’: changes in population characteristics and ‘behavioural changes’ (Gershuny and Harms, 2016) that refer to everything else, including what is not explained by the model. Regarding behavioural changes, quantitative analyses are not particularly revealing, and authors mainly make cautious assumptions based on them (Bianchi et al., 2000; Gershuny and Harms, 2016).
Country-level averages in a range of western societies indicate that we are now spend-ing less time cookspend-ing (Warde et al., 2007). Is it because domestic cookspend-ing is less and less viewed as constituent of eating practices? This article examines the extent to which changes in the association between cooking durations and the number of eating events at home account for the decline in household cooking time. We build on quantitative analy-ses of trends in time use and practice theories regarding food and eating practices. Empirically, we identify three reasons for changes in cooking durations. As well as changes in population characteristics, we further decompose ‘behavioural changes’ by isolating changes in the association between cooking duration and number of domestic eating events, from the other factors, still labelled behavioural changes.
In order to better seize our method’s potential, we apply it to two countries where we might expect a contrast in eating trends: France and the USA (1985–2010). In both coun-tries, scholars have observed a decline in the time spent on housework, mostly explained in terms of behavioural changes (Champagne et al., 2015; Gershuny and Harms, 2016); however, they have not analysed cooking per se, nor explored what these behavioural changes might be. The literature suggests that cooking is more at the core of eating prac-tices in France than it is in the USA (Bildtgård, 2010; Fischler and Masson, 2008; Glucksmann, 2014). So do we find similar trends and sources of changes in these two countries when we focus on this practice?
Literature Review
The literature on food and eating invites us to focus not only on cooking, but also on how cooking relates to eating. This emphasis is supported by a practice-theoretical perspec-tive: despite the diversity among practice theories, scholars seem to agree that a single practice is best understood through its links with others.
Accounting for the Decline in Cooking
The literature on housework and the sociology of eating provide evidence that the time spent cooking in the home has been declining in western societies over the past decades. Time-use surveys have contributed to proving this trend. The pace and period of this decline vary across countries and are sometimes disputed, with Smith and colleagues (2013) claiming that in the USA, cooking times declined until the 1990s, then remained stable until the 2000s. Gershuny and Harms (2016) maintain that decreases in time spent cooking and cleaning have been continuous since the 1920s. In France, Champagne and colleagues (2015) found that women’s daily cooking time declined by 26 minutes per day between 1985 and 1998, and by 11 minutes per day between 1998 and 2010, reduc-ing to 66 minutes, while men’s daily cookreduc-ing consistently sat at around 20 minutes. Over the same period, cooking practices have undergone tremendous changes, with the evolu-tion of home appliances and the increased availability of processed foods (Guthrie et al., 2002; Smith et al., 2013; Warde, 1997). Many new products are explicitly designed, advertised and used as timesavers in domestic food preparation (Shove and Southerton, 2000; Warde, 1999).1
Eating is associated with social norms that include how food should be prepared (Douglas, 1972). A ‘proper meal’ is a strong and widespread norm found in a variety of western countries (Bove et al., 2003; Bugge and Almas, 2006; Charles and Kerr, 1988; Holm et al., 2012). In the 1980s, this meant the gathering of members of the household at home, around the table, at a fixed hour. It also meant eating dishes that had been pre-pared by the housewife (Charles and Kerr, 1988; DeVault, 1991; Marenco, 1992). Yet whether domestic food preparation is still a part of the proper meal in the 2010s is a subject of debate (Beck, 2007; Brembeck, 2005; Bugge and Almas, 2006; Kemmer et al., 1998; Marshall and Anderson, 2002; Moisio et al., 2004). Daniels et al. (2012) found that the context of the meal influenced whether people perceived cooking to be a necessity or a way to please both others and themselves.
More generally, eating occasions have changed in ways that may lead (or allow) peo-ple to devote less time to cooking. A major trend in eating practices over the last few decades is eating out more, evidenced in both time use and household budgets (Smith et al., 2013; Warde et al., 2007). In most western countries surveyed, the time spent eat-ing at home has decreased over the last few decades (Warde et al., 2007), with fewer meals enjoyed in the company of others, shorter meals and a small increase in the amount of snacking and grazing (Mestdag and Glorieux, 2009; Yates and Warde, 2017).
Changes in population characteristics can contribute to a decline in the average time spent cooking in a given country. If a population group whose cooking time is usually low – for example, single adults – represents a larger share of the population in 2010, the
average cooking time in 2010 may fall without any change in cooking practices from single adults or others. An interpretation of such a result would be that the food culture has not changed – it is simply that the population is different. In most empirical research, population characteristics such as age, household structure and education are controlled for, so that they do not confound trends of interest. In their study of US time-use data since the 1920s, Gershuny and Harms (2016) found that changing family size and labour-force participation failed to account for the decline in the time women spent performing housework (cooking and cleaning). Similar results were found in France between 1985 and 2010 (Champagne et al., 2015).
The Blinder-Oaxaca decomposition methodology, as used by Gershuny and Harms (2016) and others (Champagne et al., 2015), goes a step further by decomposing the dif-ference between time spent cooking in 1985 and 2010 into two parts: changes that occurred because population characteristics have changed; and what Gershuny and Harms (2016, following Bianchi et al., 2000) term ‘behavioural change’, which encom-passes everything else.2 As we show in the next section, in the light of practice theories,
we can use this methodology to further decompose the trend in cooking time, in order to identify three sources of change: population changes; changing relations between cook-ing and eatcook-ing; and the remainder – behavioural changes.
Practice Theories and the Relationship Between Cooking and Eating
Studies using time-use surveys usually consider cooking a housework activity, along with cleaning and laundering. This makes sense when studying how people allocate their time for leisure, paid work and unpaid work, or how they share unpaid work within the household (Brousse, 1999; Gershuny, 2000; Kan, 2008a). Indeed, the first time-use sur-veys were viewed as time budget studies – Szalai’s (1973) label for the first international survey. The aim was to obtain the sum of various activities undertaken and durations measured in minutes allowed for this. Such a research strategy, however, isolates food preparation from its purpose: eating. As we shift attention from cooking as a part of unpaid work to cooking as being involved in eating practices, we shift our theoretical perspective away from the allocation of time to different activities and focus on the
rela-tionships between the various activities performed.
Practice theories have developed since the 1990s, thriving in discussions regarding the sociology of food and eating. Relations between practices are an important issue in theoretical writings, although their empirical analyses seem somewhat complex. Practices are regarded as units of analysis, and they are understood as both ‘doing’ and ‘saying’ (Schatzki, 1996; Warde, 2005, 2016b). Thus people are viewed as practitioners. They contribute to the reproduction of practices through their repeated performances of them, their engagement and their understanding. Practices, however, are also consti-tuted as entities, through things used, manuals, and the public and private actors who define them.
Scholars use practice theories in different ways, as illustrated by two theorists who have contributed to the sociology of food and eating, Elizabeth Shove and Alan Warde. Shove (2003) shares a more multidisciplinary perspective along the lines of science, technology and society (STS) studies (Shove, 2003; Shove et al., 2012), while Warde’s
viewpoint remains closer to classical sociological approaches in the sense that he focuses less on things and more on institutions and actors (e.g. agri-food firms, chefs, critics, policy-makers, marketing professionals), and their contributions to producing and defining food practices (Warde, 2013, 2016a, 2016b). It is striking that both schol-ars emphasize how important it is to analyse the relationships between practices. Shove and colleagues (2012) define practices both by how they consistently link skills, mate-rials and understandings, and by how they are linked to other practices through coop-eration or competition. They argue that when these links change, the practices also change. For example, the history of the freezer shows that food shopping and preserv-ing practices have changed together with the overall food provisionpreserv-ing system, includ-ing the design of household equipment (Shove and Southerton, 2000: 301).
Warde (2013) considers it vital to study the relationship between different practices when analysing eating:
Eating, as Britons currently know it, presupposes the intersection of at least four integrative practices: the supplying of food, cooking, the organization of meal occasions, and aesthetic judgments of taste. (Warde, 2013: 24)
More generally, he concludes:
Understanding better the nature of the intersections between practices is essential. We should consider more carefully how Practices [sic] are socially and purposefully coordinated and what difference they may make to their mutability. Practices are more or less tightly organized and coordinated. (Warde, 2013: 27)
Shove and Warde both indicate that, in order to understand the changes in cooking dura-tions, a praxeological perspective should unpack how cooking is coordinated with other activities, and how this coordination has changed. This can be done at the level of the actors and institutions foundational to eating (e.g. coordination with work schedules, retailers, nutritional education) as well as at the level of individual performances. For example, how does the cooking activity relate to eating, shopping and storing routines? In view of the findings in the previous literature, this article focuses on cooking and eating at home.
Time-use surveys provide great material for translating this approach into a statisti-cally testable question: How strong is the association between domestic cooking dura-tions and eating activities, and to what extent have changes in this association contributed to the decline in household cooking durations?
Using Time-Use Surveys from the Perspective of Practice Theories
Time-use surveys are among the best quantitative sources for measuring, describing, and analysing variations in daily life across countries or periods (Gershuny, 2000; Southerton et al., 2011; Sullivan and Gershuny, 2001; Warde et al., 2007). They have been designed for comparative purposes since the 1968 multinational survey project (Szalai, 1973). In a time-use survey, randomly sampled people complete 24-hour diaries in their own words, according to a time grid divided into short slots (e.g. 10-minute intervals). The activities are then coded using a standardized nomenclature.
Quantitative analyses relying on practice theories are marginal, but time-use surveys have produced high-quality material (Daniels et al., 2012; Southerton et al., 2011; van Tienoven et al., 2017; Warde et al., 2007). Indeed, practice theories and time-use surveys fit well together. According to Anderson (2016: 126), time-use surveys collect the ‘tem-poral footprints’ of practices. Tem‘tem-porality is a critical aspect of how practices are per-formed, organized and coordinated, as evidenced both in theoretical and empirical writings (Shove et al., 2009, 2012; Southerton, 2006; Southerton et al., 2011, 2012; van Tienoven et al., 2017; Warde, 1999).
In this article, we restrict our investigation to durations. Cooking duration may decline for various reasons – for example, people may save time thanks to new materials or bet-ter skills. Yet the fact that they have devoted less time to cooking remains significant, no matter how they achieved it. After all, if practitioners improve their skills or use better materials, they could use them to prepare more elaborate meals in the same amount of time. If they devote less time to cooking, it means that cooking is less a part of their ‘daily path’ (Pred, 1981) – it ranks lower in the activities they feel obliged to perform every day (Shove et al., 2012).
For all these reasons, we wanted to explore how trends in food preparation duration can be accounted for by changes in the association between cooking durations and eating in time-use surveys.
Methods
Comparing France and the USA, 1985–2010
To test whether our method could bring to light differences in the sources of changes in the decline in domestic cooking times, we compared two countries—France and the USA—over the same period (between 1985 and 2010). Gershuny and Harms (2016) recently found that the decline in cooking in the USA over nearly a century is over-whelmingly attributable to ‘behavioural propensities’ rather than changes in population characteristics. France appeared to provide a relevant counterpoint. Although in both countries the decline in the time spent cooking was proportionately similar, the French spent more time cooking than the Americans in 1985. Time spent eating at home declined in the USA, whereas it seemed stable or increased slightly in France until 1998 (de Saint Pol and Ricroch, 2012; Étilé, 2013; Warde et al., 2007). These countries are often characterized as having very different food cultures (Fischler and Masson, 2008). Warde and colleagues (2007) conclude that European countries are not converging towards American eating patterns, and that some countries – such as France – retained specific traits. More specifically, cooking seems to be more at the core of eating prac-tices in France than it is in many other societies (Bildtgård, 2010; Fischler and Masson, 2008; Glucksmann, 2014).
Data
We used the French use surveys from 1988 and 2009–2010 and American time-use surveys from 1985 and 2010. We refer to them as FR1985, FR2010, US1985 and
US2010. FR1985, US1985 and US2010 were extracted from the Multinational Time Use Survey (MTUS) from the Centre for Time Use Research in Oxford. FR2010 was obtained from the Archive de Données Issues de la Statistique Publique (ADISP) in Paris.3
Each survey relies on a nationally representative, random sample of the country’s population. In all but US2010, if the respondent lived with a partner, the partner also completed the survey. In France, the 24-hour paper diaries contained predefined time slots (five minutes for FR1985, 10 minutes for FR2010). US1985 mixed mail-back, tel-ephone and personal interviews. Respondents declared when activities started and stopped without pre-defined time-slots. US2010 used computer-assisted telephone inter-views. Respondents could provide either the length or the ending time of each activity. In the four surveys, respondents reported activities in their own words. Their answers were coded in a common nomenclature. Comparisons between direct questions on housework participation and diary surveys (such as time-use surveys) suggest that diary methods generate less systematic bias (Kan, 2008b). The impact of variations in time-use survey designs on the results of time and country comparisons has been tested and seem very limited (for a summary, see Gershuny, 2000: 285).
Study Sample. The unit of analysis in this study was the household. We restricted the
analysis to households in which there was either a single adult or two adult partners.4
When using an individual-level variable (e.g. age), we refer to the ‘main cook’, defined as the adult (woman or man) if she or he is single, or the woman if there is couple.5 All
analyses used the sample weight variables provided in the MTUS datasets, which account for socio-demographic characteristics, number of survey days per respondent and days of the week.
Household Cooking Time. The variable of interest in our study is time spent cooking at the
household level. Cooking is defined as ‘food preparation, cooking’ according to the har-monized activity codes (Fisher et al., 2012). It does not include food preparation carried out as part of paid work, or cooking declared as a secondary activity.6 Although
tempo-rality has several dimensions (Fine, 1996; Southerton, 2006), we restricted the analysis to its duration, thereby allowing dialogue with analyses of time spent performing house-work (Gershuny, 2000; Gershuny and Harms, 2016; Kan et al., 2011) and matching observations that people perceive food preparation as an activity that ‘takes time’ (Car-rigan et al., 2006; Jabs et al., 2007; Welch et al., 2009).
Women do the clear majority of cooking, but there have been slight changes since the 1980s. Although task division inside the household is not the topic of this article, it must not bias our results. We measured household cooking time as the sum of cooking dura-tions from adult members of the household. Partners did not complete US2010, but addi-tional information regarding all adult members was available from the Current Population Survey (CPS) 2010. We imputed the partner’s cooking time using propensity score matching based on cooking times and characteristics of cohabiting respondents of the appropriate sex (see Appendix A). To check that this imputation did not bias our conclu-sion, we also ran our analysis on female cooking time only, with no significant differ-ences in results (Appendix C).
Number of Eating Events at Home. We captured the practice of eating through the number
of eating events at home declared as main activities by the main cook. We used the num-ber of eating events at home because eating is organized according to events that struc-ture our days (Douglas, 1972; Holm et al., 2012; Lhuissier et al., 2013; Yates and Warde,
2017).7 The average number of eating events away from home was stable in both
coun-tries’ samples. We determined that eating at home is directly related to cooking; there-fore, we included only the number of eating events at home. Over the four surveys, only 264 French respondents and 10 Americans reported more than five eating events. To avoid outliers, we top-coded the variable (highest value of 4 or more).
Population Characteristics. We focused on population characteristics, which usually are
asso-ciated with cooking, and for which the distribution might have changed during the period of investigation. Household structure was measured through the presence of a partner and
chil-dren (defined as household members under the age of 18).8 We also included the main
cook’s age (in 10-year categories), employment status and educational level (no tertiary education versus at least some tertiary education), as well as a dummy for weekends.
Statistical Analyses
Declining Durations and Changing Associations. The descriptive statistics for 1985 and
2010 document changes in household cooking time. They also indicate changes in the number of eating events and in population characteristics.
We performed linear regressions for each survey. Household cooking time was the dependent variable; the number of eating events was the variable of interest; and popula-tion characteristics were considered as control variables. Similar to other sociological analyses of practices using quantitative data (Plessz and Gojard, 2015; Southerton et al., 2012), the regression coefficient measured the association between cooking and eating at home. The tables show unstandardized regression coefficients to be interpreted in min-utes per day.
Decomposing the Decline in Cooking. We wanted to know whether changes in the association
between eating at home and cooking accounted for the decline in time spent cooking. We needed to control for changes in population characteristics (such as household size), as well as changes in domestic eating activities (here, changes in the number of eating events). The Blinder-Oaxaca decomposition applied in each country allows for this (Bianchi et al., 2000; Champagne et al., 2015; Gershuny and Harms, 2016). Gershuny and Harms provide a short account of this method:
This technique relies on the observation that the sources of historical change in the value of a dependent variable between two time points that are explained by a set of independent variables can be broken down into four components:
Historical changes in means for time in activity
+ means change effects9+ interaction change effects
… Intercepts plus coefficients together constitute what Bianchi et al. (2000: 211) call ‘behavioural propensities’, and interaction effects are that part of the overall variance explained as the joint product of coefficient changes and changes in the means of independent variables … (and hence unattributable). (Gershuny and Harms, 2016: 520–521)
The authors then display the proportion of all historical changes in time use related to behavioural propensities. We will further decompose the results by isolating the effect of the number of eating events (written NEE for the sake of clarity):
Historical changes in mean for household cooking time
= NEE means change effect + other variables’ means change effects + NEE coefficient change effect + other variables’ coefficient change effects + intercept change effects + interaction change effects
The terms in italics are what is left as ‘behavioural changes’ in this decomposition. In Gershuny and Harms’ version of the decomposition, the NEE variable would not be in the model and its effects would also be termed ‘behavioural changes’. The technicalities and detailed results of Blinder-Oaxaca decompositions appear in Appendix B.
Results
Describing Changes
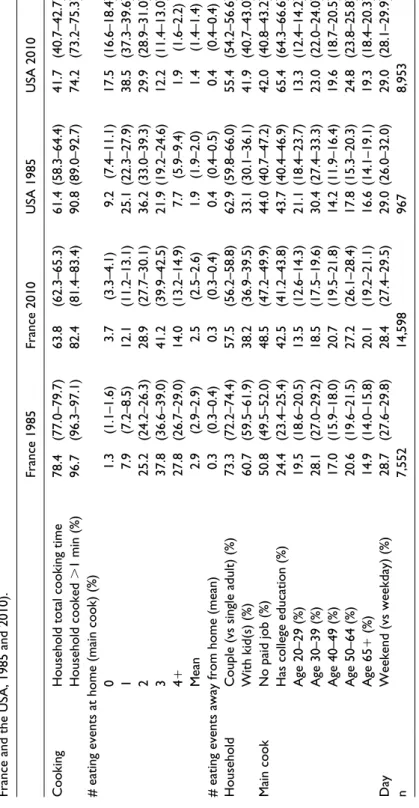
Table 1 shows that many changes took place at the same time. In our samples, the aver-age time that households devoted to cooking declined both in France and the USA. In France, the 15-minute per day decline in household cooking time represents 18% of the 1985 duration, whereas in the USA, the decline reached 20 minutes, representing a third of the 1985 duration.
In 2010, the number of eating events at home declined (-0.5 events in each country) with no change in the frequency of eating out. Respondents had higher education levels and were older. In France, the rise in single-adult and childless households was visible. The two US surveys did not convey this trend, possibly because the sample size and design of US1985 were not as good as for the other surveys.10 It is important to control
for changes in population characteristics in order to accurately account for changes in cooking and in the cooking–eating association.
Changes in the Association Between Number of Domestic Eating Events
and Cooking Times
Figure 1 describes average household cooking times according to the number of eating events per household. In 2010, in each country, household cooking durations were shorter
Table 1.
Weighted descriptive statistics of main variables (means and column percentages with 95% confidence intervals) in time-use s
urveys,
France and the USA, 1985 and 2010).
France 1985
France 2010
USA 1985
USA 2010
Cooking
Household total cooking time
78.4 (77.0–79.7) 63.8 (62.3–65.3) 61.4 (58.3–64.4) 41.7 (40.7–42.7) Household cooked > 1 min (%) 96.7 (96.3–97.1) 82.4 (81.4–83.4) 90.8 (89.0–92.7) 74.2 (73.2–75.3)
# eating events at home (main cook) (%)
0 1.3 (1.1–1.6) 3.7 (3.3–4.1) 9.2 (7.4–11.1) 17.5 (16.6–18.4) 1 7.9 (7.2–8.5) 12.1 (11.2–13.1) 25.1 (22.3–27.9) 38.5 (37.3–39.6) 2 25.2 (24.2–26.3) 28.9 (27.7–30.1) 36.2 (33.0–39.3) 29.9 (28.9–31.0) 3 37.8 (36.6–39.0) 41.2 (39.9–42.5) 21.9 (19.2–24.6) 12.2 (11.4–13.0) 4+ 27.8 (26.7–29.0) 14.0 (13.2–14.9) 7.7 (5.9–9.4) 1.9 (1.6–2.2) Mean 2.9 (2.9–2.9) 2.5 (2.5–2.6) 1.9 (1.9–2.0) 1.4 (1.4–1.4)
# eating events away from home (mean)
0.3 (0.3–0.4) 0.3 (0.3–0.4) 0.4 (0.4–0.5) 0.4 (0.4–0.4) Household
Couple (vs single adult) (%)
73.3 (72.2–74.4) 57.5 (56.2–58.8) 62.9 (59.8–66.0) 55.4 (54.2–56.6) With kid(s) (%) 60.7 (59.5–61.9) 38.2 (36.9–39.5) 33.1 (30.1–36.1) 41.9 (40.7–43.0) Main cook No paid job (%) 50.8 (49.5–52.0) 48.5 (47.2–49.9) 44.0 (40.7–47.2) 42.0 (40.8–43.2)
Has college education (%)
24.4 (23.4–25.4) 42.5 (41.2–43.8) 43.7 (40.4–46.9) 65.4 (64.3–66.6) Age 20–29 (%) 19.5 (18.6–20.5) 13.5 (12.6–14.3) 21.1 (18.4–23.7) 13.3 (12.4–14.2) Age 30–39 (%) 28.1 (27.0–29.2) 18.5 (17.5–19.6) 30.4 (27.4–33.3) 23.0 (22.0–24.0) Age 40–49 (%) 17.0 (15.9–18.0) 20.7 (19.5–21.8) 14.2 (11.9–16.4) 19.6 (18.7–20.5) Age 50–64 (%) 20.6 (19.6–21.5) 27.2 (26.1–28.4) 17.8 (15.3–20.3) 24.8 (23.8–25.8) Age 65 + (%) 14.9 (14.0–15.8) 20.1 (19.2–21.1) 16.6 (14.1–19.1) 19.3 (18.4–20.3) Day Weekend (vs weekday) (%) 28.7 (27.6–29.8) 28.4 (27.4–29.5) 29.0 (26.0–32.0) 29.0 (28.1–29.9) n 7,552 14,598 967 8,953
Figure 1. Average household cooking time according to number of eating events, country and
year, France and the USA, 1985 and 2010.
Number of eating events at home declared by the main cook as the main activity.
for each eating episode. In France, the two lines are somewhat parallel, but in the USA, the slope was less steep in 2010, suggesting a weaker association.
In linear regressions (Table 2), we controlled for population characteristics. In France, each additional eating event was associated with nine extra minutes of household cook-ing time, with no change over the period investigated. In the USA, the figure was nearly 11 minutes in 1985 and less than eight minutes in 2010 (t-test indicates the difference is statistically significant, p = 0.03). This finding indicates that the association between cooking times and number of eating events at home has declined in the USA, but not in France. The drop in the R-squared value also suggests that we accounted better for the variance in cooking time in 1985.
Sources of Change and the Decline in Cooking
In Table 3, we present the result of the Blinder-Oaxaca decomposition of changes in household cooking times, expressed in percentages of the total decline in cooking time for each country (detailed results appear in Appendix B, Table S1).
In France, the association between eating and cooking has not contributed to the decline in cooking duration: the main driver is the change in population characteristics. In the USA, on the contrary, the contribution of population characteristics is negligible, but the declining association between eating at home and cooking accounts for a third of the 20-minute decline in time spent cooking. In both countries, respondents eat less often
Table 2.
Linear regressions of household cooking durations on number of eating events at home, controlling for population characterist
ics
(unstandardized coefficients in minutes/day and 95% CI).
France 1985
France 2010
USA 1985
USA 2010
Eating
# eating events at home
* 9.0 (7.8–10.2) 8.7 (7.2–10.2) 10.9 (8.1–13.6) 7.6 (6.6–8.7) Household Single 0 0 0 0 Couple 36.6 (33.8–39.4) 33.4 (30.7–36.2) 30.0 (24.4–35.5) 26.8 (24.7–29.0) No kids 0 0 0 0 Kid(s) 9.7 (6.5–12.8) 4.9 (1.1–8.7) 14.4 (7.9–21.0) 11.7 (9.0–14.3) Main cook Paid job 0 0 0 0 No paid job 17.4 (14.8–20.1) 19.6 (15.9–23.4) 13.8 (7.4–20.2) 8.7 (6.5–10.9) No college education 0 0 0 0 College education –8.1 (–10.5– –5.6) –5.0 (–8.1– –2.0) –1.6 (–7.1–4.0) –4.1 (–6.2– –2.0) Age 18–29 0 0 0 0 Age 30–39 7.8 (4.9–10.7) 11.0 (6.9–15.0) 9.0 (2.0–16.0) –2.9 (–6.4–0.5) Age 40–49 16.6 (12.7–20.5) 19.2 (14.4–24.1) 5.5 (–3.6–14.5) 0.0 (–3.4–3.4) Age 50–64 25.5 (22.0–29.0) 19.9 (16.1–23.8) 14.5 (5.9–23.0) 2.1 (–1.2–5.5) Age 65 + 29.0 (24.2–33.8) 25.1 (20.2–30.0) 21.7 (11.6–31.7) –0.6 (–4.3–3.1) Day Weekday 0 0 0 0 Weekend 8.9 (6.2–11.6) 4.5 (1.8–7.2) 5.1 (–1.2–11.4) 2.0 (0.2–3.7) Intercept −3.8 (–7.6– –0.1) –4.2 (–8.9–0.5) 0.1 (–7.5–7.7) 9.8 (6.4–13.2) n 7,552 14,598 946 8,492 R–squared [0–1] 0.27 0.21 0.30 0.18
at home, and so-called behaviour changes also account for a large proportion of the changes in cooking duration. Interactions (unattributable to either behaviour or popula-tion change – see Gershuny and Harms, 2016) compensated for 10% of the changes in France but were not significant in the USA.
We can arrange the results differently to show the share of the decline, which is attrib-utable to changes in domestic eating habits (change in the number of eating events +change in the association between eating and cooking + interaction for number of eating events; see Appendix B). We found that these changes accounted for 26% of the decline in household cooking time in France compared with 52% in the USA.
Discussion
French and American households devote less time to domestic food preparation than they once did. Is cooking still a part of their eating practices? The answer is more straight-forward in the USA than in France. In the USA, the association between eating at home and cooking has weakened significantly, accounting for nearly a third of the decline in time spent cooking. Changes in the characteristics of the population cannot be consid-ered responsible for this trend. Another source of this decline is that Americans eat less often at home than they used to.
In France, people also eat at home less often than they used to, with a negative impact on cooking time. However, the association between eating at home and cooking remains as strong as it was in the 1980s. The decline is best accounted for by changes in popula-tion characteristics. This result is somewhat at odds with earlier findings (Champagne et al., 2015; Gershuny and Harms, 2016) that changes in population characteristics played a minor role in the decline of housework time, both in France and the USA. There are two possible explanations, both connected to our practice-theoretical perspective. The first is that, in these studies, cooking is merged with many other activities into a ‘housework’ category. On the contrary, we were interested in cooking as a social Table 3. Proportions of change attributable to population changes, and to changes in eating
in France and the USA, according to Blinder-Oaxaca decomposition of changes in household cooking times.
France USA Total decline –15 minutes –20 minutes Change in number of eating events* 21% 28%
Change in population characteristics 46% 2% (ns) Change in association between eating and cooking 6% (ns) 32% ‘Behavioural change’ (change in other
coefficients+ intercepts) 37% 39%
Interaction –10% –2% (ns)
Notes:
Ns: not significant at 95%.
Oaxaca-Blinder decomposition run on models presented in Table 2. Data were weighted.
practice, so we have focused on food preparation. It is very possible that each practice constituting housework has a specific trend. Second, the authors cited considered every-thing except changes in demographics as ‘behavioural change’, while we have isolated the number of eating events at home. Focusing on a single practice allows us to use the sociological literature in order to identify relevant sources of change in practices that are ‘socially and purposefully coordinated’ with cooking (Warde, 2013: 27).
We compared France and the USA because their eating practices and food cultures are often described as dissimilar and even divergent (Fischler and Masson, 2008; Warde et al., 2007). Our results are consistent with this view, and contribute to describing food culture differences more specifically and objectively: trends that may seem similar at first can actually have different sources. If cultural change refers to a change in practices (Shove et al., 2012), as opposed to a change in population, then we can state that we have found stronger and more encompassing evidence of cultural change in the USA com-pared with France, where population change is a major source of change in cooking practices observed at country level. In order to better describe what this cultural change might be, other methods are probably necessary.
The results of this study rely on time-use surveys and are only as good as the data obtained. Several conceptual dimensions of practices (their materials, skills, understand-ings and coordinating agents) were not addressed. More specifically, there were some changes in survey design that could limit their comparability. For example, in France the 24-hour diary was divided into slots of five minutes in 1985 versus 10 minutes in 2010. In 1985, people might have reported very short episodes of food preparation (e.g. for breakfast), which could have been merged into longer eating events in 2010. We wanted to know how this might have affected our results. We computed household cooking dura-tion per day in FR1985 after excluding episodes shorter than 10 minutes. The average was three minutes (4%) shorter than the mean duration in Table 1, using every episode. This suggests that this change in design had a very minor impact on our results.
There are other issues, such as the small sample size in US1985, the inaccurate trend in the proportion of childless couples between the two US surveys11 and the variations in
sampling designs and modes of data collection between the US studies: US1985 mixed mail-back, telephone and personal interviews while US2010 was a 24-hour recall admin-istered by phone to respondents of the CPS. Comparability issues arise as soon as one tries to capture trends (thus comparing surveys collected in different periods, with differ-ent economic and technical resources for data collection) or to compare countries (with different statistical institutions and possibilities in terms of sampling). It is very difficult to assess when comparability is sufficient to risk the analysis, or so weak that any result should be considered unreliable. We can argue that other researchers before us, including renowned experts of time-use surveys and of eating, have taken the risk, probably con-sidering that there are very few alternative datasets covering so many countries on such a long period of time (Gershuny, 2000; Sullivan, 2000; Warde et al., 2007). That being said, the results for France are probably more reliable than those for the USA.
Quantitative sociology and practice theories seldom meet, yet they can greatly benefit one another, as we hope to have shown here. We claim that it is theoretically and statisti-cally relevant to use multivariate regressions within theories of practices. Statistical associations are just what we need to capture relationships between practices. These
relationships are an important issue in practice theories: with multivariate regressions, we can identify, measure and compare them (Plessz and Gojard, 2015). Conversely, prac-tice theories are a suitable framework for the interpretation of regression coefficients. Indeed, they focus on processes and configurations rather than on the identification of a single causal factor (Southerton et al., 2012). Thus they avoid the difficult issue of causal identification, which has become the pitfall of many uses of multivariate modelling (Angrist and Pischke, 2009; Petitti, 1991).
Using practice theories allowed us to go beyond previous results regarding the sources of historical change in cooking. Cooking is sometimes subsumed in housework, but some renowned anthropologists have argued that it is a key feature of culture and a suit-able topic to compare societies (Goody, 1982; Lévi-Strauss, 1990). By reframing cook-ing as a practice to be situated among the ‘compound practice’ of eatcook-ing (Warde, 2016b) rather than including it with other housework activities, and by exploring relations between practices, we were able to give specific content to the notion of behavioural change, and to suggest how relations between practices could be measured. We did so using existing, high-quality and free survey data, virtually accessible to any researcher.
Much more remains to be done. For example, could we decompose further what remains here as unexplained behavioural change? Cooking may be competing with other practices, such as leisure activities or paid work. In France, we have found that the decline in cooking time was partly due to women willing to engage more in paid work, even after controlling for the wages they could expect on the labour market (Étilé and Plessz, 2018).
We have also addressed the decline of cooking only from the standpoint of its daily duration. However, people may have busy lives and still value cooking. They may rush, choose simpler recipes or select foods with shorter cooking times, still trying hard to pre-pare food every day. Our choice to study duration relied on the hypothesis that taking the time to cook was sociologically significant. Several authors have suggested that time-fixity is another valuable option, because we fix in our schedules activities that matter to us (Southerton, 2006), or because our institutional roles partly command what we are supposed to do at specific times of the day (Pred, 1981). Following this lead, we could use time-use data in order to describe when people cook, and whether time-fixity has changed over time, no matter how long cooking lasts. Van Tienoven and colleagues (2017) tried to assess the time-fixity of our practices in a day, after collapsing activities into broad cate-gories (paid work, unpaid work, etc.). They found that the busier people were, the more their schedule was organized around temporally stable practices. However, it is also pos-sible that cooking forms sequences with eating, or with eating and cleaning tasks (setting the table, clearing the table), without having a fixed schedule in terms of clock time. This was found both on quantitative and qualitative time-use data (de Saint Pol, 2005; Southerton, 2006). It may be that cooking is less a part of routinized sequences of prac-tices that go along with eating, or that people have found other, more complex ways to temporally organize their eating practices (Warde, 1999). Time-use surveys as well as schedules (Southerton, 2006) or diaries (Wahlen, 2011) record practices in a socially meaningful way. They assist in accounting for practices’ links, degree of institutionaliza-tion and variainstitutionaliza-tions. All these empirical possibilities, illustrated here with the case of cook-ing and eatcook-ing, point to the relevance of temporality for the sociology of practices and of
daily life. These are not just mundane matters, since how we use and experience time reflects gender, age and class divisions (Gershuny, 2000: 69; Kan, 2008a; Sullivan and Katz-Gerro, 2007) as well as national cultures, as we have found here.
In this article, we circumvented the question of gender differences in cooking by ana-lysing cooking at the household level. The cooking time of the respondents’ partners in US2010 had to be imputed. We tested the robustness of our results by replicating them for female respondents’ cooking time only (after restricting the sample to households including at least one female adult; see Appendix C). For France, the results were largely consistent with those presented earlier. In the US surveys, females’ cooking time repre-sented a declining share of household cooking time and became negatively associated with having a partner in 2010 (Table S2 and S3), suggesting that as cooking is becoming less common, it is also becoming less gendered. Although some may lament that cooking is less frequently at the core of daily eating practices, the weakening association between cooking and eating could be good news for women, for whom being expected to cook every meal can be a burden as well as a barrier to their involvement in leisure and career (DeVault, 1991; Étilé and Plessz, 2018).
Acknowledgements
The authors thank Anne Lhuissier, Alan Warde, Jonathan Gershuny, Luke Yates, Stefan Wahlen, Thibaut de Saint Pol, Isabelle Darmon and other colleagues who have provided useful comments on earlier versions of this article.
Funding
The author(s) disclosed receipt of the following financial support for the research, authorship, and/ or publication of this article: This paper benefited from a grant from INRA, Metaprogram Did’it in 2012 (project number #10451).
Notes
1. We do not assume any causal relationship between changes in cooking materials and changes in cooking durations. Obviously this is a very complex question, which may vary across countries (Glucksmann, 2014). Even eating out does not always avoid food preparation (packed lunches).
2. French authors Champagne et al. (2015) translated this term into changement de pratiques – practice change.
3. List of datasets used:
Enquête emploi du temps – 1985–1986 (1986) (electronic dataset), INSEE (producer), ADISP – CMH (distributor). Downloaded 14 March 2012.
Enquête emploi du temps – 2010 (2010) (electronic dataset), INSEE (producer), ADISP – CMH (distributor). Downloaded 14 March 2012.
Multinational time-use study – 1975 to 2010, version 5.8 (2010) (electronic dataset), Centre for Time-use Research (producer), Centre for Time-use Research (distributor). Downloaded 12 March 2012.
American time-use study – 2003 to 2010 (2010) (electronic dataset), Bureau of Labour Statistics (producer), Bureau of Labour Statistics (distributor). Downloaded 23 January 2013.
4. It was not possible to compute household cooking time in households including more than two adults.
5. We needed a simple way to identify which respondents’ characteristics we were using in each household, without referring to how people cooked. In a minority of couples, the woman was not the ‘main cook’ (her partner cooked more), but these households probably have specific characteristics that we may not capture accurately. At least, in our case, men who are ‘main cooks’ are clearly identified: they are single.
6. Many time-use surveys collect both the main or principal activity and secondary activities, as perceived by respondents. US2010 collects only main activities.
7. We also have more statistical reasons: total eating time per day is much skewed (small num-ber of very high durations) and we feared that the fact that a day has 24 hours would make the two durations (negatively) correlated.
8. There were too few single-parent households in US1985 to isolate them.
9. Means change effects are the effects of changes in the means of the independent variables. 10. The weights provided with the MTUS files do not take into account household structure, so
they do not compensate for this possible source of sampling bias.
11. In the USA, had the proportion of single-adult and childless households declined in our sam-ples, we would have observed even shorter household cooking times in 2010 because these variables remain strongly associated with longer cooking times (see Table 2).
ORCID iD
Marie Plessz https://orcid.org/0000-0001-7026-6224
References
Anderson B (2016) Laundry, energy and time: Insights from 20 years of time-use diary data in the United Kingdom. Energy Research & Social Science 22: 125–136. DOI: 10.1016 /j.erss.2016.09.004.
Angrist JD and Pischke J-S (2009) Mostly Harmless Econometrics: An Empiricist’s Companion. Princeton, NJ: Princeton University Press.
Beck ME (2007) Dinner preparation in the modern United States. British Food Journal 109(7): 531–547.
Bianchi SM, Milkie MA, Sayer LC, et al. (2000) Is anyone doing the housework? Trends in the gender division of household labor. Social Forces 79(1): 191–228.
Bildtgård T (2010) What it means to ‘eat well’ in France and Sweden. Food and Foodways 18(4): 209–232.
Blinder AS (1973) Wage discrimination: Reduced form and structural estimates. Journal of
Human Resources 8(4): 436–455.
Bove CF, Sobal J and Rauschenbach BS (2003) Food choices among newly married couples: Convergence, conflict, individualism, and projects. Appetite 40(1): 25–41.
Brembeck H (2005) Home to McDonald’s: Upholding the family dinner with the help of McDonald’s. Food, Culture and Society: An International Journal of Multidisciplinary
Research 8(2): 215–226.
Brousse C (1999) La répartition du travail domestique entre conjoints reste très largement spé-cialisée et inégale. In: INSEE (ed.) France Portrait Social-Edition 1999–2000. Paris: INSEE, pp. 135–151.
Bugge AB and Almas R (2006) Domestic dinner: Representations and practices of a proper meal among young suburban mothers. Journal of Consumer Culture 6(2): 203–228.
Caraher M, Lange T and Dixon P (2000) The influence of TV and celebrity chefs on public atti-tudes and behavior among the English public. Journal for the Study of Food and Society 4(1): 27–46.
Carrigan M, Szmigin I and Leek S (2006) Managing routine food choices in UK families: The role of convenience consumption. Appetite 47(3): 372–383.
Champagne C, Pailhé A and Solaz A (2015) Le temps domestique et parental des hommes et des femmes: Quels facteurs d’évolutions en 25 ans? Économie et statistique 478(1): 209–242.
Charles N and Kerr M (1988) Women, Food, and Families. Manchester: Manchester University Press.
Daniels S, Glorieux I, Minnen J, et al. (2012) More than preparing a meal? Concerning the mean-ings of home cooking. Appetite 58(3): 1050–1056.
De Saint Pol T (2005) Quand est-ce qu’on mange ? Le temps des repas en France (analyse quanti-tative). Terrains et travaux 2(9): 51–72.
De Saint Pol T and Ricroch L (2012) Le temps de l’alimentation en France. INSEE Première (1417): 1–4.
DeVault ML (1991) Feeding the Family: The Social Organization of Caring as Gendered Work. Chicago, IL: University of Chicago Press.
Douglas M (1972) Deciphering a meal. Daedalus 101(1): 61–81.
Étilé F (2013) Obésité: Santé publique et populisme alimentaire. Paris, France: Editions Rue d’Ulm.
Étilé F and Plessz M (2018) Women’s employment and the decline of Home Cooking: Evidence from France, 1985–2010. Review of Economics of the Household 16(4): 939–970.
Fine GA (1996) Kitchens: The Culture of Restaurant Work. Berkeley: University of California Press.
Fischler C and Masson E (2008) Manger: Français, Européens et Américains face à l’alimentation. Paris: O. Jacob.
Fisher K, Gershuny J and Gauthier A (2012) Multinational time use study: User’s guide and docu-mentation. Available at: https://www.timeuse.org/sites/ctur/files/public/ctur_report/5715/ mtus-user-guide-r5.pdf (accessed 24 July 2018).
Gershuny J (2000) Changing Times: Work and Leisure in Postindustrial Society. Oxford: Oxford University Press.
Gershuny J and Harms TA (2016) Housework now takes much less time: 85 years of US rural women’s time use. Social Forces 92(2): 503–524. DOI: 10.1093/sf/sow073.
Glucksmann MA (2014) Bake or buy? Comparative and theoretical perspectives on divisions of labour in food preparation work. Anthropology of food (S10). Available at: http://journals. openedition.org/aof/7691 (accessed 10 January 2018).
Goody J (1982) Cooking, Cuisine, and Class: A Study in Comparative Sociology. Cambridge: Cambridge University Press.
Guthrie JF, Lin B-H and Frazao E (2002) Role of food prepared away from home in the American diet, 1977–78 versus 1994–96: Changes and consequences. Journal of Nutrition Education
and Behavior 34(3): 140–150.
Holm L, Ekström MP, Gronow J, et al. (2012) The modernisation of Nordic eating. Anthropology
of Food (S7). Available at: https://aof.revues.org/6997?lang=fr (accessed 31 October 2016).
Jabs J, Devine CM, Bisogni CA, et al. (2007) Trying to find the quickest way: Employed mothers’ constructions of time for food. Journal of Nutrition Education and Behavior 39(1): 18–25. DOI: 10.1016/j.jneb.2006.08.011.
Jann B (2008) The Blinder-Oaxaca decomposition for linear regression models. The Stata Journal 8(4): 453–479.
Kan MY (2008a) Does gender trump money? Housework hours of husbands and wives in Britain.
Work, Employment & Society 22(1): 45–66. DOI: 10.1177/0950017007087416.
Kan MY (2008b) Measuring housework participation: The gap between ‘stylised’ questionnaire estimates and diary-based estimates. Social Indicators Research 86(3): 381–400. DOI: 10.1007/s11205–007–9184–5.
Kan MY, Sullivan O and Gershuny J (2011) Gender convergence in domestic work: Discerning the effects of interactional and institutional barriers from large-scale data. Sociology 45(2): 234–251. DOI: 10.1177/0038038510394014.
Kemmer D, Anderson AS and Marshall DW (1998) Living together and eating together: Changes in food choice and eating habits during the transition from single to married-cohabiting.
Sociological Review 46(1): 48–73.
Lévi-Strauss C (1990) Mythologiques. Chicago, IL: University of Chicago Press.
Lhuissier A, Tichit C, Caillavet F, et al. (2013) Who still eats three meals a day? Findings from a quantitative survey in the Paris area. Appetite 63(April): 59–69. DOI: 10.1016/j. appet.2012.12.012.
Marenco C (1992) Manières de table, modèles de mœurs. Cachan: Editions de l’ENS-Cachan. Marshall DW and Anderson AS (2002) Proper meals in transition: Young married couples on the
nature of eating together. Appetite 39(3): 193–206. DOI: 10.1006/appe.2002.0507.
Mestdag I and Glorieux I (2009) Change and stability in commensality patterns: A comparative anal-ysis of Belgian time-use data from 1966, 1999 and 2004. Sociological Review 57(4): 703–726. Moisio R, Arnould EJ and Price LL (2004) Between mothers and markets: Constructing fam-ily identity through homemade food. Journal of Consumer Culture 4(3): 361–384. DOI: 10.1177/1469540504046523.
Oaxaca R (1973) Male–female wage differentials in urban labor markets. International Economic
Review 14(3): 693–709.
Petitti DB (1991) Associations are not effects. American Journal of Epidemiology 133(2): 101– 102. DOI: 10.1093/oxfordjournals.aje.a115848.
Plessz M and Gojard S (2015) Fresh is best? Social position, cooking, and vegetable consumption in France. Sociology 49(1): 172–190. DOI: 10.1177/0038038514521715.
Pred A (1981) Social reproduction and the time-geography of everyday life. Geografiska Annaler.
Series B, Human Geography 63(1): 5–22. DOI: 10.2307/490994.
Schatzki TR (1996) Social Practices—A Wittgensteinian Approach to Human Activity and the
Social. Cambridge: Cambridge University Press.
Shove E (2003) Comfort, Cleanliness and Convenience: The Social Organization of Normality. Oxford: Berg.
Shove E and Southerton D (2000) Defrosting the freezer: From novelty to convenience: A narra-tive of normalization. Journal of Material Culture 5(3): 301–319.
Shove E, Pantzar M and Watson M (2012) The Dynamics of Social Practice: Everyday Life and
How it Changes. Los Angeles, CA: SAGE.
Shove E, Trentmann F and Wilk RR (eds) (2009) Time, Consumption and Everyday Life: Practice,
Materiality and Culture. Oxford: Berg.
Smith LP, Ng SW and Popkin BM (2013) Trends in US home food preparation and consumption: Analysis of national nutrition surveys and time use studies from 1965–1966 to 2007–2008.
Nutrition Journal 12: 45. DOI: https://doi.org/10.1186/1475-2891-12-45.
Southerton D (2006) Analysing the temporal organization of daily life: Social constraints, prac-tices and their allocation. Sociology 40(3): 435–454.
Southerton D, Díaz-méndez C and Warde A (2011) Behavioural change and the temporal order-ing of eatorder-ing practices: A UK–Spain comparison. International Journal of Sociology of
Southerton D, Olsen W, Warde A, et al. (2012) Practices and trajectories: A comparative analysis of reading in France, Norway, the Netherlands, the UK and the USA. Journal of Consumer
Culture 12(3): 237–262.
Sullivan O (2000) The division of domestic labour: Twenty years of change? Sociology 34(3): 437–456.
Sullivan O and Gershuny J (2001) Cross-national changes in time-use: Some sociological stories re-examined. The British Journal of Sociology 52(2): 331–347.
Sullivan O and Katz-Gerro T (2007) The omnivore thesis revisited: Voracious cultural consumers.
European Sociological Review 23(2): 123–137.
Szalai S (1973) The Use of Time. Daily Activities of Urban and Suburban Populations in Twelve
Countries. The Hague: Mouton.
van Tienoven TP, Glorieux I and Minnen J (2017) Exploring the stable practices of everyday life: A multi-day time-diary approach. The Sociological Review 65(4): 745–762.
Wahlen S (2011) The routinely forgotten routine character of domestic practices. International
Journal of Consumer Studies 35(5): 507–513. DOI:
https://doi.org/10.1111/j.1470-6431.2011.01022.x.
Warde A (1997) Consumption, Food and Taste: Culinary Antinomies and Commodity Culture. London: SAGE.
Warde A (1999) Convenience food: Space and timing. British Food Journal 101(7): 518–527. Warde A (2005) Consumption and theories of practice. Journal of Consumer Culture 5(2): 131–
153.
Warde A (2013) What sort of practice is eating? In: Shove E and Spurling N (eds) Sustainable
Practice: Social Theory and Climate Change. London: Routledge, pp. 17–30.
Warde A (2016a) Consumption: A Sociological Analysis. New York: Springer. Warde A (2016b) The Practice of Eating. London: Polity Press.
Warde A, Cheng S-L, Olsen W, et al. (2007) Changes in the practice of eating. Acta Sociologica 50(4): 363–385.
Watson M (2012) How theories of practice can inform transition to a decarbonised transport sys-tem. Journal of Transport Geography 24. Special Section on Theoretical Perspectives on Climate Change Mitigation in Transport: 488–496.
Welch N, McNaughton SA, Hunter W, et al. (2009) Is the perception of time pressure a barrier to healthy eating and physical activity among women? Public Health Nutrition 12(7): 888–895. Yates L and Warde A (2017) Eating together and eating alone: Meal arrangements in British
households. The British Journal of Sociology 68(1): 97–118.
Author biographies
Marie Plessz is a research fellow in sociology in the French National Institute for Agricultural Research (INRA) and a member of the research unit Centre Maurice Halbwachs (CNRS, ENS, EHESS). She is interested in social stratification, food practices, and the life course.
Fabrice Étilé is a research director in economics in the French National Institute for Agricultural Research (INRA) and a member of Paris School of economics (PSE). His research focuses on the economics, econometrics and public policies of health behaviours, and on food systems and health.
Appendices
Appendix A: Imputing Cooking Times to Partners in American Time-Use
Survey (ATUS) 2010
Problem. In the French time use surveys and in the American 1985 time use survey, if a
partner is present, time use data are collected for both partners.
In US2010, time use data were only collected for one adult in the household. In order to assess the time input in the production of domestic meals, it is necessary to impute the household’s cooking time.
Method. The intuition of the procedure is as follows. For each ATUS respondent living
with a partner, we find another ATUS respondent whose characteristics (e.g. sex, age, education) are as close to this partner’s characteristics as possible. We give to the unob-served partner the cooking time of this very close respondent.
Since 2003, American time-use survey (ATUS) data has been collected from house-holds that are respondents to the Current Population Survey (CPS). The ATUS respond-ent is selected randomly among household members aged 15 or more. The CPS also contains rich information on every household member. We use this information to impute partners’ cooking times.
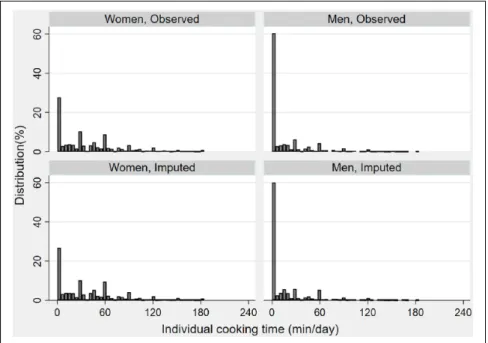
Technically, we used propensity score matching (PSM) in order to impute cooking time for the missing partners. This means that we did not try to match unobserved part-ners with similar observed respondents directly; rather, we matched them with someone having the same propensity (i.e. probability) not to be an ATUS respondent, based on their individual and household characteristics. The fact that being an ATUS respondent is technically random did not matter. We just needed a set of regression coefficients in order to compute the distance between unobserved partners and their potential matches (inside each group). Figure S1 shows that the distributions of observed and imputed (matched) cooking times are indeed similar.
We dropped observed cooking time above the 98th percentile because we did not want to impute extreme values. We performed propensity score matching within clusters based on the intersection of sex, employment status, partner’s employment status and weekend day (16 groups). We have checked that none of these groups is empty.
Inside each of the clusters, the matching procedure is implemented using the ‘near-est neighbour’ specification. This amounts to attributing to each treated individual the value of the observed individual whose propensity score is the closest (in absolute value, inside the cluster). This specification seems the fittest to deal with the distribu-tion of cooking duradistribu-tions, which is much skewed with many zeros. Variables used for matching are each adult’s educational level, weekly working hours and earnings, the adult’s ethnic group and age, the level of urbanization and the great region of the place of residence.
Then we sum the cooking time of both partners (including the observed extreme values).
Results. A total of 17.8% of the couples have an imputed cooking time equal to 0.
Distributions of the cooking times for each sex are quite similar for the observed and imputed values.
Figure S1. Distribution of individual cooking time for female (left) and male (right) partners:
observed (top) and imputed values (bottom) (excluding households with observed value above 98th percentile)
Figure S2. Distribution of couples’ imputed cooking time in 2010 (excluding observed above
Appendix B: Blinder-Oaxaca decomposition
Blinder-Oaxaca decomposition allows decomposing the difference between two groups (or two periods) into an explained part, which is attributable to changes in the distribu-tion of the right-hand side variables; and an unexplained part, which is attributable to changes in the coefficients. A typical case is the study of wage discrimination between men and women. The explained part refers to the fact that women have different charac-teristics from men (education, part-time work, etc.) and the unexplained part refers to the fact that the same characteristics yield lower wages for women compared with men, thus suggesting a discriminating behaviour from the employer (Blinder, 1973; Oaxaca, 1973). This decomposition has been used to analyse changes across time typically in time-use surveys (Champagne et al., 2015; Gershuny and Harms, 2016).
In our case, the two groups are year 1985 and 2010, cooking time is the outcome (Y) and we have a comparable set of explanatory variables X.
If we regress Y on X for each year and then subtract the predictions, we obtain: D=E
(
Y2010) (
E− Y1985)
=β2010E(
X1985)
− β1985E(
X1985)
We can perform a three-fold decomposition (Jann, 2008) that consists in rearranging
E1 as follows: D X X X X =
(
)
−(
)
+[
−]
(
)
+(
β2010 1985 1985 β1985 β2010 1985 1985 ))
−(
)
X1985 [
β1985−β2010]
Table S1. Results of Oaxaca–Blinder decomposition of changes in household cooking times
(min/day). USA France Overall Mean 2010 41.70 (40.67–42.74) 63.81 (62.29–65.37) Mean 1985 61.36 (58.26–64.46) 78.37 (77.06–79.67) Difference –19.66 (–22.92– –16.39) –14.56 (–16.55– –12.56) Characteristics –5.91 (–8.97– –2.86) –9.72 (–10.97– –8.47) Coefficients –14.06 (–17.07– –11.04) –6.24 (–8.42– –4.06) Interaction 0.31 (–2.41–3.04) 1.41 (0.10–2.72) Population
changes #dom_mealsOther variables –5.56–0.35 (–7.18– –3.94)(–2.78–2.07) –2.99–6.73 (–3.49– –2.48)(–7.84– –5.63) Coefficient
changes #dom_mealsOther variables –6.31.30 (–12.02– –0.58)(–1.49–4.10) –0.88–0.73 (–6.24–4.48)(–2.33–0.87) Constant Constant –9.06 (–15.82– –2.29) –4.63 (–9.94–0.68) Interaction #dom_meals 1.66 (0.14–3.19) 0.10 (–0.53–0.73) Other variables –1.35 (–3.52–0.82) 1.30 (0.01–2.59)
The three parts of the decompositions can be interpreted as: •
• the contribution of the changes in the population characteristics •
• the contribution of the changes in the coefficients •
• an interaction term because predictors and coefficients change simultaneously. In each of these parts, we can isolate the contribution of a specific variable. We
per-formed the Oaxaca-Blinder decomposition using Stata 13 and the oaxaca package
written by Ben Jann (2008). Because we have categorical predictors we must use the categorical option and we must not isolate the difference in intercepts in the
decom-position. We also tried to change the reference year (swap option) and found
qualita-tively similar results.
Appendix C: Changes in Female Cooking Times
In the article we analysed changes in household cooking times because changes in the gender division of food preparation is a very complex question and we wanted to focus on the definition and measurement of the decline of cooking. However, cooking remains a highly gendered activity. By merging male and female cooking times, have we overlooked a major aspect of the trends in cooking? A way to assess that is to replicate our analysis on female respondents only (single and partnered so as to reflect changes in household sizes) and check whether the results are consistent.
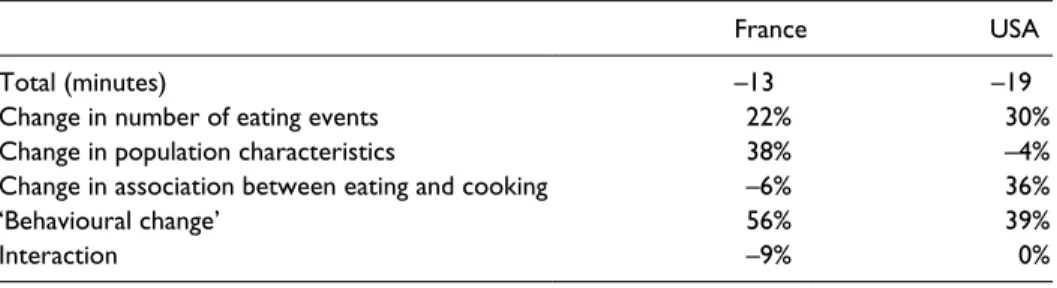
Female cooking time has fallen, and American women perform a smaller share of the household cooking time than in 1985 (Table S2). We estimated our regressions with female cooking time as an outcome (Table S3) after restricting the sample to households with at least one adult woman. The results were consistent with those on household cook-ing times. Associations are weaker in 2010 than in 1985 in both countries. In the USA the association between having a partner and women’s cooking time becomes negative (p = 0.04).
Oaxaca-Blinder decompositions of female cooking time only (Table S4) show that population characteristics played a major role in France. There were also sizeable Table S2. Cooking times of female respondents (min/day). Descriptive statistics.
France 1985 France 2010 USA 1985 USA 2010 Single and partnered
women cooking time 72.0 (70.8–73.3) 58.5 (56.9–60.1) 56.6 (53.5–59.7) 28.2 (27.2–29.1) Partnered women
cooking time 75.6 (74.2–77.0) 63.3 (61.3–65.3) 61.8 (58.0–65.6) 28.4 (27.3–29.6) Partnered women: % of
household cooking time 84.4 (83.7–85.1) 79.2 (78.1–80.4) 81.6 (79.2–84.1) 50.0 (48.5–51.5)
Table S3.
Cooking times of female respondents (min/day). Linear regressions.
France 1985
France 2010
US 1985
US 2010
Eating
Eating events at home
8.8 (7.4–10.1) 9.0 (7.3–10.8) 11.1 (8.1–14.2) 7.7 (6.5–8.9) Household Couple 34.7 (31.6–37.8) 30.6 (27.5–33.7) 28.4 (22.3–34.5) 25.1 (22.8–27.4) Kids 10.0 (6.6–13.5) 3.6 (–0.7–7.9) 13.7 (6.8–20.6) 10.1 (7.0–13.2) Main cook No paid job 18.0 (15.2–20.8) 20.9 (16.5–25.2) 14.1 (7.3–20.8) 8.7 (6.1–11.2) College ed. –8.3 (–11.0– –5.6) –5.2 (–8.7– –1.7) –2.3 (–8.3–3.8) –5.5 (–8.0– –3.0) Age 30–39 8.2 (5.0–11.3) 11.4 (6.6–16.3) 10.0 (2.0–18.0) –2.7 (–6.7–1.4) Age 40–49 16.8 (12.7–21.0) 19.7 (14.0–25.4) 5.4 (–4.5–15.3) 0.5 (–3.5–4.6) Age 50–64 26.3 (22.4–30.2) 19.6 (15.0–24.1) 13.3 (4.0–22.7) 1.2 (–3.0–5.4) Age 65 + 29.9 (24.4–35.4) 23.4 (17.7–29.0) 21.7 (10.8–32.5) –1.9 (–6.6–2.8) Day Weekend 9.7 (6.9–12.6) 4.8 (1.7–7.9) 5.5 (–1.4–12.3) 1.7 (–0.4–3.8) Intercept –2.3 (–7.0–2.3) –1.9 (–7.8–3.9) 1.5 (–7.4–10.3) 13.6 (9.2–18.0) n 6,781 12,160 856 7,432 R–squared (0–1) 0.22 0.17 0.25 0.13
Table S4. Oaxaca–Blinder decomposition of changes in female cooking times.
France USA
Total (minutes) –13 –19
Change in number of eating events 22% 30% Change in population characteristics 38% –4% Change in association between eating and cooking –6% 36%
‘Behavioural change’ 56% 39%
Interaction –9% 0%
Sample restricted to single or partnered women.
‘behavioural changes’ in French female cooking times that did not show at household level.