
Chemistry Models for Major Gas Species Estimation and Tar
Prediction in Fluidized Bed Biomass Gasification
by
Rajesh Sridhar
B. Tech., Mechanical Engineering & M. Tech., Product Design
Indian Institute of Technology Madras (2013)
Submitted to the School of Engineering
in partial fulfillment of the requirements of the degree of
Master of Science in Computation for Design and Optimization
at the
MASSACHUSETTS INSTITUTE OF TECHNOLOGY
February 2016
Massachusetts Institute of Technology 2016. All rights reserved.
Author...
Certified by...
Signature
I I~
Signature redacted
School of Engineering
November 19, 2015
red acted
...
Ahmed F. Ghoniem
Professor, Department of Mechanical Engineering
Signature redacted-Thesis
Supervisor
A ccepted by...
...
MASSACHUSETS INSTrTUTE OFTECHNOLOGY-JUN 13 2016
LIBRARIES
ARCHIVES
icolas Hadjiconstantinou
Professor, Depart ent of Mechanical Engineering
Co-Director, Computation for Design and Optimization
Page left intentionally blank
Chemistry Models for Major Gas Species Estimation and Tar
Prediction in Fluidized Bed Biomass Gasification
by
Rajesh Sridhar
Submitted to the School of Engineering
On TBD, 2015, in partial fulfillment of the
Requirements for the degree of
Master of Science in Computation for Design and Optimization
Abstract
The present work deals with the process of fluidized bed biomass gasification (FBBG), which is the thermochemical conversion of solid biomass into combustible synthetic gas using a fluidized bed. Fluidized bed gasifiers encounter high tar concentrations at the gasifier outlet necessitating expensive downstream cleaning equipment. Apart from the complex chemical pathways involved, tar production is also strongly dependent on the transport processes occurring inside the gasifier. Hence, the development of a detailed model to predict the variation of tar production under different operating conditions needs to include two important considerations: a comprehensive chemical kinetic sub-model and a detailed hydrodynamic sub-model. However, due to the huge computational expense associated with such a detailed simulation coupling the complex chemistry and hydrodynamics, there is a need to develop simplified models on both fronts. The first part of this work presents a detailed discussion on the chemistry models for biomass gasification: after introducing the existing state-of-the-art reaction mechanisms (both detailed and compact), two new global chemistry models, incorporating a global primary tar cracking reaction, for air-blown gasification and steam-blown gasification conditions are developed. The major gas species and total tar concentrations predicted using the global models in reactor network simulations of the gasifiers are compared with the corresponding predictions obtained using the detailed CRECK mechanism for biomass gasification, as well as with the available experimental observations. On the hydrodynamics front, an improved reactor network model based on the two-phase theory has been developed to better capture the mixing inhomogeneities in the bubbling fluidized bed, including mass transfer considerations between the bubble and emulsion phases. Finally, the predictions of various tar class concentrations and major gas species concentrations, obtained using the improved reactor network model in conjunction with the detailed CRECK kinetic reaction
mechanism, for both air-blown gasification and steam gasification, are presented.
Key words: Biomass gasification, Fluidized beds, Chemical reactor network modeling, chemical
kinetics, chemistry mechanism reduction, Global chemistry model Thesis Supervisor: Ahmed F. Ghoniem
Title: Ronald C. Crane (1972) Professor, Department of Mechanical Engineering
Acknowledgements
I would like to express my sincerest gratitude to Prof. Ghoniem for his continued guidance
throughout the project work. His experience in guiding students and a clear understanding of the subject matter helped me in the difficult times during the project.
I would like to thank Randall Field (MIT Energy Initiative) for the research feedback and guidance
during the course of the project. I am also highly indebted to the other BP-sponsored researchers in the group (Addison, Christos, Richard and Akhilesh) for their insightful discussions. I am much obliged to Katherine for proof-reading the thesis.
I would also like to thank all the other RGD labmates for their support during the last 2 years. I am very grateful to BP for their financial support to the project.
Table of Contents
1
Introduction ... 171.1 Introduction to Biom ass ... 17
1.2 Biom ass G asification... 22
1.3 Introduction to Tars and Tar classification ... 25
1.4 Thesis goals... 27
1.5 Thesis O utline ... 28
2 Biom ass Chem istry M odels... 30
2.1 Thermodynamic equilibrium-based models for biomass gasification ... 32
2.2 Kinetic M odels for Biom ass G asification ... 34
2.2.1 Global M odels... 35
2.2.2 Detailed Kinetic M echanism s ... 40
2.3 M echanism Reduction Techniques ... 46
2.3.1 Physical m echanism reduction approaches... 46
2.3.2 M athem atical reduction approaches ... 48
2.3.3 M ulti-stage reduction approaches ... 49
2.4 Com pact M echanism s for Biom ass gasification ... 51
2.4.1 Palm a M odel for Biom ass Gasification ... 51
2.4.2 Pepiot m echanism for biom ass gasification... 52
2.5 Conclusions ... 54
3 Global Chemistry Model development for Biomass Gasification ... 55
3.1 M otivation ... 56
3.2 Stark global chemistry m odel... 58
3.3 Biom ass devolatilization m odel... 60
3.4 Reactor Network M odeling of Biom ass G asification ... 61
3.5 Char conversion m odel... 63 5
3.6 M otivation for a better global chem istry model... 64
3.7 New global chem istry m odel development and validation ... 67
3.7.1 Air-blown gasification conditions... 67
3.7.2 New global m odel validation ... 72
3.7.3 Steam -blown gasification conditions... 78
3.7.4 New global m odel validation ... 86
3.8 Sensitivity analysis of the m odeling parameters ... 93
3.8.1 Sensitivity of the model outputs to char conversion... 93
3.8.2 Sensitivity of the model outputs to primary tar concentrations ... 94
3.8.3 Sensitivity of the primary tar composition on the output gas composition ... 95
3.8.4 Sensitivity of water-gas shift kinetics on model outputs ... 96
3.8.5 Sensitivity of model outputs to biomass feedstock characteristics... 98
3.9 Conclusions ... 101
4 Reactor Network Modeling of Bubbling Fluidized Bed Biomass Gasification... 104
4.1 Reactor Network m odel developm ent... 105
4.2 Air-blown gasification sim ulations ... 108
4.2.1 Results and Discussion ... 112
4.3 Steam Gasification conditions... 120
4.3.1 Results and Discussion ... 123
4.4 Conclusions ... 129
5 Conclusions... 130
5.1 Future W ork ... 131
Bibliography ... 133
Appendix I - Conservation Equations for isothermal CSTR and PFR... 141
Appendix I - Prim ary tar decomposition pathways ... 146
List of Figures
Figure 1-1 Cross-sectional view of a plant cell structure showing the regional distribution of the various biomass constituents: cellulose, hemicellulose and lignin (Source: undbiom ass.blogspot.no) ... 20 Figure 1-2 Chemical structures of the three primary building blocks of Lignocellulosic Biomass -Cellulose, Hem icellulose and Lignin [3]... 21
Figure 1-3 Overview of the Biomass Gasification process, describing the different sub-processes determining the end product composition... 23
Figure 1-4 Schematic of an industrial Biomass gasifier for electricity generation (reproduced from
[6]). Synthetic gas generated from the biomass gasifier is fed to a combined cycle power plant to
produce electricity ... 24 Figure 2-1 Overview of the biomass devolatilization process [3]. More than 80% of the solid biomass is converted to volatiles and gases, while the remaining fraction produces char ... 31
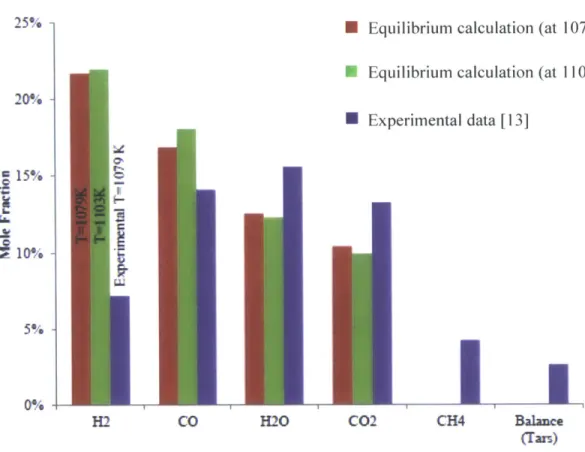
Figure 2-2 Comparison of the equilibrium concentrations of the major gas species (H2, CO, H20,
CO2, CH4) and tars with the experimental observations ([3], [13])... 35
Figure 2-3 Total Biomass decomposition rate represented as the sum of individual decomposition rates of the major components: cellulose, hemicellulose and lignin [13]... 37
Figure 2-4 A representative global model depicting the different reactions in biomass gasification
[23]. Biomass devolatilization reaction was followed by homogenous oxidation reactions,
heterogeneous char reactions and tar reforming reactions... 39
Figure 2-5 Hierarchical representation of the CRECK secondary gas phase reaction mechanism for biomass gasification. Starting with the base mechanism, additional species and the corresponding reactions are added stage by stage ... 43 Figure 2-6 Flowchart describing the conversion of biomass to synthetic gas using the detailed CRECK mechanism. Biomass Devolatilization is described using 35 species and 18 reactions and
the secondary homogenous reactions of primary pyrolysis products are represented using 327 species and 10933 reactions... 44
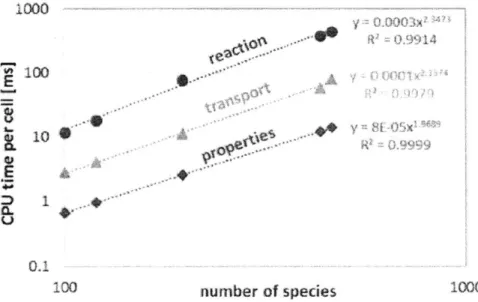
Figure 2-7 Computational time variation with the size of the kinetic mechanism, showing almost a quadratic dependence of the computation time on the number of species in the mechanism [51] ... 4 5
Figure 2-8 Combination of different mechanism reduction approaches (Directed Relation Graph, Lumping and Quasi Steady State Approximations) used to obtain a ten-fold decrease in the size of the n-heptane oxidation mechanism [84]... 50
Figure 2-9 Comparison of the predictions of major gas species and tar classes using the Palma mechanism with experiments [85]. Palma mechanism predicts significantly different concentrations of the major gases and the tars, compared to the experimentally measured values ... 5 2
Figure 2-10 Combination of different mechanism reduction techniques (DRGEP, Isomer Lumping,
QSSA) were employed by Pepiot to obtain a reduced model for biomass gasification [86]... 53
Figure 3-1 Two different secondary pyrolysis models considered by Gerber et al [28] to model tar production in biomass gasification (Pathway to Tar2 applies only to the second model) ... 56
Figure 3-2 Variation of the outlet gas composition with the secondary pyrolysis model employed (reproduced from Gerber et al [28]). Inert tar fraction and the major gas concentrations were significantly affected by the choice of the secondary pyrolysis model ... 57
Figure 3-3 Biomass Devolatilization was described using a particle scale model developed by Stark, incorporating the heat transfer effects with detailed chemical kinetics ([3],[8]) ... 60 Figure 3-4 Fluidized bed biomass gasifier, represented as a network of ideal chemical reactors. Bubbling bed was represented using a continuously stirred reactor and the freeboard was modeled as plug flow reactor (reproduced from Stark et al. [8]) ... 62
Figure 3-5 Schematic of the char gasification model, considering the gasification assisted attrition phenomena, developed by Bates et al. [98]. Char produced during devolatilization underwent
gasification reactions with steam and CO2, and attrition to produce char fines that was elutriated out of the gasifier ... 63
Figure 3-6 Details on the different sub-models used in the Reactor Network Simulations of the Fluidized bed biomass gasifier. The different assumptions, the solution procedure and the required input conditions for each of these sub-models are listed...65
Figure 3-7 Comparison of the total tar predictions obtained using the Stark global chemistry model and the CRECK model with the experimental observations ([13], [99]). Stark global model predicts significantly higher amounts of tars than the detailed CRECK mechanism and experiments
... 66
Figure 3-8 Major gas species and total tar concentrations predicted using the global chemistry model and the detailed CRECK mechanism for van Paasen and Kiel experimental conditions [13]. The model predictions for all the species (Except H20) are in good agreement with experiments ... 75
Figure 3-9 Evolution of the major gas species and tars along the gasifier at bed temperature Tb =
1123 K, evaluated using the new global chemistry model Tari is completely consumed by the early
portion of the freeboard...77
Figure 3-10 Steady state char gasification rates, evaluated using the char conversion model (XH20 and XC02 represent the char fractions gasified by H20 and C02) ... 86
Figure 3-11 Schematic of the different sub-models and simulation conditions used in the NREL steam gasification sim ulations ... 87
Figure 3-12 Major Gas species and total tar concentrations predicted using the global chemistry model and the detailed CRECK mechanism for NREL gasification conditions [101]. Major gas species predictions are in good agreement with experiments, however the total tars are over-predicted by both the chemistry models ... 89
Figure 3-13 Evolution of the major gas species concentrations along the gasifier, evaluated using the global chemistry model for different gasification temperatures. The main variation in the concentrations occurs in the early part of freeboard, where the remaining primary tars are
converted to light gases and secondary tars. Solid lines correspond to T=750*C, dashed lines represent T=800'C and dotted lines denote T=8500C...91
Figure 3-14 Evolution of the primary (Tarl) and secondary tars (Tar2) along the gasifier, evaluated using the global chemistry model for different gasification temperatures. Primary tars are completely converted by the early part of the freeboard, while the secondary tars concentrations remain almost constant throughout the freeboard. Solid lines correspond to T=750'C, dashed lines represent T=800*C and dotted lines denote T=850'C...92 Figure 3-15 Relative sensitivities of the major gas species and total tar concentrations w.r.t to the char conversion. Char conversion model has the greatest impact on CO. H20 and H2., while its
impact on CO2 and total tars is much smaller ... 94
Figure 3-16 Relative sensitivities of the major gas species and total tar concentrations to the primary tar concentration. Total tar concentrations are the most sensitive to the primary tar concentrations, while its impact on the major gases is relatively weak ... 95
Figure 3-17 Relative sensitivities of the major gas species and total tar concentrations on the primary tar composition. Total tars have the greatest sensitivity to the primary tar composition; its impact on the major gases is negligible ... 96
Figure 3-18 Comparison of the Major Gas species and total tar concentration predictions using the Gomez-Barea (GB) and Biba water-gas shift kinetics for NREL gasification conditions. Major gas concentrations vary significantly with the choice of WGS kinetics; total tar concentrations have very little dependence on W GS kinetics ... 97
Figure 3-19 Comparison of the Major Gas species and total tar concentration predictions for different biomass feedstock: Hybrid poplar (red), tulip poplar (blue) and Blend2 (green) under NREL gasification conditions using CRECK mechanism (solid lines) and the proposed global model (dashed lines). Experiments are represented by symbols. There is little variation in the model predictions with the biomass feedstock ... 99
Figure 4-1 Schematic of the Reactor Network model of the bubbling fluidized bed, as presented in
K aush al [89 ]... 10 6
Figure 4-2 Schematic of the bubbling fluidized bed, modeled as a combination of isothermal CSTR and isotherm al PFR ... 108
Figure 4-3 Schematic of the different sub-models and simulation conditions used in the improved RNM simulations for the van Paasen and Kiel air blown gasification conditions ... 110 Figure 4-4 Different tar class concentrations predicted for the van Paasen and Kiel air gasification conditions using the improved reactor network model. Cases 2 and 3 predict significantly high tar concentrations (close to experiments) than cases 1 and 4...113 Figure 4-5 Major Gas species concentrations predicted for the van Paasen and Kiel air gasification conditions using the improved reactor network model. There are significant variations in the CO and C02 concentrations with the choice of the mixing cases ... 114
Figure 4-6 Steam and total tar concentration predicted for the van Paasen and Kiel air gasification conditions using the improved reactor network model. Cases 2 and 3 accurately predict the steam concentrations, while the total tar concentrations are in very good agreement with experiments for all cases (except C ase 2) ... 115
Figure 4-7 Evolution of the Class 3 tar concentrations inside the gasifier, evaluated using the improved reactor network model at two different temperatures (973K and 1273K). Significant variation in the tar concentration is observed for different incoming gas flow cases at 1273K, but there is negligible difference at 973K. Within the bed region, dashed lines indicate the species evolution within PFR and dotted lines represent the CSTR concentrations ... 116
Figure 4-8 Evolution of the major gas species concentrations inside the bubbling bed at two different temperatures (1073K and 1123K) for Case 2 mixing. Solid lines indicate the species evolution within PFR and dashed lines represent the CSTR concentrations. Oxygen consumption
is m uch faster at 1123K than 1073K ... 118
Figure 4-9 Impact of water-gas shift kinetics on the evolution of CO, CO2 and 02 concentrations
inside the PFR (above) and CSTR (below) regions of the bubbling bed for Case 2 mixing at 1123K.
Solid lines represent the case of slow WGS kinetics and dashed lines represent the case of fast
WGS kinetics from Biba [97]. Larger CO conversion into CO2 is observed for the faster WGS
kinetics case, even though the CO oxidation rates stayed constant...119
Figure 4-10 Schematic of the simulation conditions used in the improved RNM simulations for the NREL steam blown gasification conditions ... 121
Figure 4-11 Different tar class concentrations predicted for the NREL steam blown gasification conditions using the improved reactor network model for the different incoming gas flow cases. The variation in the tar concentrations with the gasification temperature is similar for all the incom ing gas flow cases...124
Figure 4-12 Major gas species and total tar concentrations predicted for the NREL steam blown gasification conditions using the improved reactor network model for the different incoming gas flow cases. The model predictions are in good agreement for all the incoming gas flow cases ... 125
Figure 4-13 Evolution of the hydrogen concentrations inside the gasifier, evaluated using the improved reactor network model at 1073K. There is negligible difference in the hydrogen concentrations for the different incoming gas flow cases. Within the bed region, dashed lines indicate the species evolution within PFR and dotted lines represent the CSTR concentrations ... 127
Figure 4-14 Evolution of the CO (above) and Class 3 tar (below) concentrations inside the gasifier, evaluated using the improved reactor network model at 1073K. The difference in both the concentrations is not very significant for the different incoming gas flow cases. Within the bed region, dashed lines indicate the species evolution within PFR and dotted lines represent the CSTR concentrations ... 128
Figure 5-1 Schematic of the detailed Reactor network model for the bubbling fluidized bed (Y is the composition of the gas, V is the volume of the reactor and Al is the mass flow rate into/out of each of the reactors ... 132
List of Tables
Table 1-1 Percentages of fossil fuels (highlighted) that need to be left unutilized to meet the global warming temperature goals (reproduced from McGlade and Ekins [1] ... 18
Table 1-2 Compositions of different biomass feedstocks, indicating significant variations in the cellulose, hemicellulose and lignin fractions with the feedstock characteristics [101]... 20 Table 1-3 Comparison of the advantages and disadvantages of different biomass gasifier configurations ... 25
Table 1-4 Tar classification: Characteristic properties of the various tar classes and representative compounds belonging to each of them ... 27
Table 3-1 Global chemistry model employed by Stark [3] for CFD simulations of biomass gasification. A three-step devolatilization mechanism was followed by homogenous oxidation reactions, heterogeneous reactions and tar cracking reaction ... 59
Table 3-2 Simulation conditions employed in accordance with the van Paasen and Kiel experim ents [13] ... 64
Table 3-3 Devolatilization product composition for beech feedstock, obtained from the single particle model at temperature T=1073K ... 68
Table 3-4 Input gas composition to the Reactor Network model of the air-blown gasifier for the evaluation of LVG decomposition characteristics (T=1273 K)... 69
Table 3-5 Product composition of levoglucosan decomposition in the presence of air at temperature T =1273K, obtained using the Reactor Network model ... 70
Table 3-6 Overall mass balance across the reactants and products for the global primary tar cracking reaction ... 7 1
Table 3-7 Elemental balance of Carbon, Hydrogen and Oxygen across the reactants and products for the global primary tar cracking reaction ... 72
Table 3-8 Global chemistry model for air-blown gasification conditions ... 74
Table 3-9 Gasifier conditions employed in the NREL experiments [101]... 78
Table 3-10 Devolatilization product composition for Oak, obtained using the particle scale model
(T = 8000C ) ... 79
Table 3-11 List of the different devolatilization products belonging to the two primary tar groups ... . 80
Table 3-12 Input gas composition used to study the levoglucosan decomposition characteristics in the reactor network model of the steam-blown gasifier ... 80
Table 3-13 Product composition of Levoglucosan degradation in the presence of steam for the
NREL gasification conditions (T = 8000 C) ... 81
Table 3-14 Input gas composition used to study HMFU decomposition characteristics in the reactor network model of the steam-blown gasifier ... 81
Table 3-15 Product composition of HMFU degradation in the presence of steam for the NREL gasification conditions (T = 8000 C) ... 82
Table 3-16 Relative mass fractions of the two categories of primary tars in the devolatilization product com position... 82
Table 3-17 Overall mass balance across the reactants and products for the global primary tar cracking reaction ... 84 Table 3-18 Elemental balance of Carbon, Hydrogen and Oxygen across the reactants and products for the global primary tar cracking reaction ... 84
Table 3-19 Global chemistry model for steam-blown gasification conditions ... 85 Table 4-1 Simulation conditions employed in accordance with the van Paasen and Kiel experim ents [13] ... 1 10
Table 4-2 Bubble growth and inter-phase mass transfer correlations employed for the van Paasen and K iel gasification conditions... 111
Table 4-3 Different incoming gas flow cases considered in the improved Reactor Network Model ... 12 0
Table 4-4 Simulation conditions representing the NREL experiments ... 121 Table 4-5 Bubble growth and inter-phase mass transfer correlations employed for the NREL steam blown gasifier conditions ... 122
Page left intentionally blank
1
Introduction
Over the last few decades, there has been a growing concern over the dangers of greenhouse gas emissions from the widespread use of fossil fuels for generating electricity and producing transportation fuels. In a bid to address this critical problem, there have been several research efforts aimed at developing sustainable energy solutions that could, in the short term, help us reduce our dependency on the fossil fuels and eventually replace them over the next few decades.
A recent study by McGlade and Ekins [1] revealed that significant amounts of the existing fossil
fuel reserves in the world would have to be left in the ground if we are to meet the target of restricting the average global temperature rise to 2'C above the temperatures that existed during the pre-industrial years.
There have been continued efforts towards developing and commercializing various renewable energy technologies such as solar, wind, biomass and geothermal, that could fuel the ever growing energy demand in the future. Amongst these technologies, biomass is considered a very attractive option because of its versatility in being applicable to both static energy production needs such as electricity generation as well as portable energy needs such as those encountered in transportation. While biomass could be used to produce electricity through the incineration and gasification technologies, biomass pyrolysis and gasification could produce fuel grade drop-in biofuels that could be used for transportation applications. In addition, biomass energy conversion technologies could be used as an efficient means of waste management for processing the disposed agricultural and forestry waste as well as municipal solid waste.
1.1 Introduction to Biomass
Biomass is a general term used to describe any kind of non-fossilized plant-derived material, including animal manure, which is essentially a processed form of plant material [2]. Biomass, in some sense, can be thought of as a natural energy storage system whereby the solar energy incident upon the plant leaves is converted into chemical energy through photosynthesis and stored as chemical bonds in the plant.
Table 1-1: Percentages of fossil fuels (highlighted) that need to be left unutilized to meet the global warming temperature goals (reproduced from McGlade and Ekins [1].
2*T with CCS 2C without CCS
Oil Gas Coal Oid Gas Coal
Countryor rgion Qlonsof % Trillionsol % ot % Rlimisof % Tillonsof
%
C%
barrels cublmetres barrels cubicmeres
Afica
23
21%
4A
33%
28
85%
28
26%
44
34%
30
90%
Canada
39
74%
0.3
24%
510
75%
40
75%
0.3
24%
54
82%
China and
India
9
25%
2.9
63%
180
66%
9
25%
2.5
53%
207
77%
FSU
27
18%
31
50%
203
94%
28
19%
36
59%
209
97%
CSA
58
39%
4.8
53%
8
51%
63
42%
5.0
56%
11
73%
Eurpe
5.0
20%
0,6
11%
65
78%
53
21%
023
6%
74
89%
Middle East
263
38%
46
61%
3.4
99%
264
38%
47
61%
3.4
99%
OECD Pacific
2,1
37%
22
56%
83
93%
23
46%
2.0
51%
85
95%
ODA
2.0
9%
2.2
24%
10
34%
2.8
12%
2,1
22%
17
60%
United States of Ameria
2B
6%
0.3
4%
235
92%
4.6
9%
0.5
6%
245
95%
Global
431
33%
95
49%
819
82%
449
35%
100
52%
887
88%
FSth formw rimmwbi;CAmrlardSutAmr;ODA~wderdMIAsianmob*;OECDthoOganim : EcowopemioprainandDevopmentAbarrelfod is0.159 m %Rew bmabebefre25op mya f curentresnve.
Various authors classify biomass in different ways. The most commonly used approach, proposed
by Demirbas [2], classifies biomass resources as,
1. Wastes, including agricultural wastes, crop residues, urban organic wastes
2. Forest products such as wood and wood residues, barks from forest clearings
3. Energy crops, comprising starch and sugar crops, oilseed crops and grasses
4. Aquatic plants, such as algae and water hyacinth
The desire to extract the stored chemical energy in the biomass and convert it into a form that can be readily used in the existing applications for electricity generation and transportation forms the basis of biomass conversion processes. The conversion processes can be broadly classified into four basic categories: Direct combustion processes, thermochemical processes, biochemical processes and agrochemical processes [2]. For each of these conversion processes, certain types of biomass are more suitable than others. For example, in the case of thermochemical conversion, energy crops and forest products are preferred over aquatic plants and manure as a result of their lower moisture content and hence, proportionally smaller energy requirements for drying.
The energy crops and forest products can be further categorized as [3],
1. Sugar and starchy crops
2. Lignocellulosic biomass
3. Oilseed crops
Sugars and starchy biomass, such as sugarcanes in Brazil and corn in the United States, are used to produce ethanol and are currently the dominant type of biomass to be used in the bio energy industry. Bio-oils, extracted from the oilseed crops, are used in the production of biodiesel and form only a small fraction of the entire bio-energy industry. On the contrary to both the edible sugary crops and oilseeds, Lignocellulosic biomass, such as wood wastes and agro residues, are non-edible and prove to be an ideal biomass feedstock for energy production [4].
Lignocellulosic biomass consists of three major components: cellulose, hemicellulose and lignin. While cellulose is composed of long straight chains of glucose, hemicellulose is made up of tightly bound branches of different polysaccharides such as xylose, mannose and glucose. Lignin, on the other hand, does not have a regular polymeric structure and is made up of three primary phenyl-propanoids that have zero, one or two methoxyl groups attached to the ring respectively.
Depending
on
the source of the plant, these three phenyl propanoids -- p-hydroxyphenyl, guiaiacyland syringol, are present in varying proportions (131. [51). A list of the cel lIlose, hemicellulose and 1igni n proportions for different biomass feedstock is given in Table I -2.
Macrori Lin n KiH Lignin -2 U rnm Pen Itose," ILx N
Figure I - I Cross-sectional view of a plant cell strucdure show ing
the \variolis biomass constituents: celilulose, heinicelllulose
indhiomass. blogspot .io)
the reglonal distribution of
anuld
lienin
(Source:Table I _-2": Coll mposit ions of different biomass feedstocks, indicatine si gni ficant varations in
Ihe cellulose, hemicell ulose and lignin fractions with the feedstock characteristics
I
I(Oak ---- (.7
Hrdwood
0.60
SwitthrsI34.88
. C7.a 3.84Corn
Si tovr36.34 1
4.30 Tulip Pop 42.73 .(6.72 0.441ybrivd
Poplar 45.311.1
.950.69
Pine Bllnd 39.44 2 0,65 1.93 0.48 Blend I 3.95 .49 >5.38 1.56 Blend 2 41.42 19 61 )9. 0.56 20 Piant U-H H -- H4 ~ H H H HH' I40 -Q 4 OH110v H H i --- -0--.', -J H I H/ . ) I HemCedulose (XvIn) j;1 Hj
y'L~.
"Li
2 .
-ye]loe Hen-klus an LinnJ3
-r
rN
Figure 1-2: Chemical structures of the three primary building blocks of Lignocellulosic Biomass -Cellulose, Hemicellulose and Lignin [3]
1.2 Biomass Gasification
As mentioned previously, biomass conversion processes deal with breaking down the chemical bonds in the biomass to form more stable products. Biomass conversion processes can be broadly classified as,
1. Biochemical processes such as fermentation and biological digestion,
2. Thermochemical processes such as pyrolysis, liquefaction and gasification
Biochemical processes aim to break down the biomass feedstock using microbes such as yeast and bacteria (both in the presence of oxygen or an inert atmosphere) and are typically used in the applications of high moisture biomass feedstock. However, they have large freshwater requirements and also suffer from severe scaling limitations. On the other hand, thermochemical conversion uses heat and chemical processes to obtain useful energy from the biomass feedstock. While the thermochemical processes of pyrolysis and liquefaction deal with converting the solid biomass into liquid products, gasification is used to produce high heating value gases, starting from the same biomass feedstock. In the case of direct combustion processes, biomass combustion is used to generate heat that could be used in a steam cycle to generate electricity. When the biomass feedstock is combusted, the chemical bonds (between carbon, hydrogen and oxygen molecules) in the biomass are broken down and new stable bonds formed, releasing chemical energy as heat. The present work considers the thermochemical conversion process of biomass gasification.
Biomass Gasification is the process of converting a solid biomass feedstock into a mixture of gases, with a high heating value, in a partially oxidized atmosphere at moderately high temperatures (usually > 500 C). The product gas, rich in CO and H2, could then be used to generate electricity using a gas turbine, or it could also serve as the starting base for the production of fertilizers and other chemicals used in the processing industries. Gasification is a multi-stage process: the solid biomass first undergoes devolatilization to release the volatile gases and also produces some residual char. These devolatilization products then undergo further secondary gas phase reactions in the presence of the gasifying agent to produce a final gas mixture that is rich in
CO and H2. Depending on the operating conditions, the char produced in the initial devolatilization
process might react with the gases to produce CO, CO2and H2, or gets elutriated out of the gasifier.
Devolatilization
Primary pyrolysis
Secondary
pyrolysis
reactions,
Gas phase
oxidation,
WGS, PAH
growth
Gasifying
agent
Char
gasification,
oxidation
Complex process with
complicated interactions
between heat transfer
and chemistry
c'3
M rJ
The most commonly found biomass gasifiers fall within the following categories,
1. Fixed bed gasifiers
-
Updraft and downdraft configurations
2. Fluidized bed gasifiers
-
Circulating and Bubbling Fluidized beds
3. Entrained Flow gasifiers
Fixed bed gasifiers have distinct temperature regions where the different sub-processes of
gasification such as drying, pyrolysis and combustion take place. Fluidized bed gasifiers typically
use an inert bed material that is fluidized by the gasifying agent and have better mixing and heat
transfer characteristics. Entrained flow gasifiers operate at high temperatures and require small
biomass particle sizes, hence achieving lower tar content in the output synthetic gas.
Gasifier
Biomass
-w
r oxygen -0.
Steam
-Catalytic reformng unit
Hot fuel gas
Clean fuel gas
1~
:4, to gauifier
Gas
tuxbine
Ash
Hot exhatust
Air
(e
Fie gas
Steam
Steam turbine
to gasifier
Heat recoverywater
steam generator
Figure 1-4: Schematic of an industrial Biomass gasifier for electricity generation (reproduced
from [6]). Synthetic gas generated from the biomass gasifier is fed to a combined cycle power
plant to produce electricity
Air
Fluidized bed gasifiers have a number of significant advantages over fixed beds and entrained flow gasifiers for the application of biomass gasification. Since fluidized beds have good mixing and heat transfer characteristics, they do not suffer from any scaling limitations unlike fixed beds. In addition, fluidized bed gasifiers do not have the requirement of finely ground feedstock for operation, as in the case of entrained flow gasifiers. On the contrary to coal, grinding biomass to very fine sizes is difficult and hence, very expensive. However, due to the low operating temperatures and short residence times, fluidized beds encounter significant amounts of tar compounds at the outlet that necessitate expensive downstream cleaning equipment.
Table 1-3: Comparison of the advantages and disadvantages configurations
of different biomass gasifier
1.3 Introduction to Tars and Tar classification
While there is no standard definition for the term "tars" in the literature, tars are generally considered to be the condensable high molecular weight hydrocarbons (including oxygenated compounds) with generally one or more aromatic rings, such as benzene and naphthalene. A detailed discussion on the different operational definitions used for tar was presented by Milne [6]. Apart from their refractory nature and hence, the resultant difficulty in removing them, tars also have low condensation temperatures and tend to condense along the gas pipelines clogging them. To prevent this, sophisticated gas cleanup systems to crack the tar at high temperatures using
25
Gasifier Advantages Disadvantages
Fixed - Updraft High carbon conversion and Large amounts of tar, small High Thermal efficiency feedstock size
Fixed -Downdraft Lower Tar production Limited scale-up, not fuel
flexible
Fluidized Bed Flexible composition, uniform Significant amounts of tar at
temperature the outlet
Entrained Flow Low amounts of tar, flexible Feedstock needs to be ground feedstock
expensive catalysts need to be retrofitted to the gasifier. Additionally, some of the tar compounds are highly soluble in water, necessitating expensive wastewater treatment and disposal systems downstream to handle the toxic wastewater.
The serious problems associated with having even small amounts of "tar" in the gasifier outlet synthetic gas was best summarized by Tom Reed [6],
"While a great deal of time and money has been spent on biomass gasification in the last two decades, there are very few truly commercial gasifiers, operating without government support or subsidies, day in, day out, generating usefil gas from biomass. The typical project starts with new ideas, announcements at meetings, construction of the new gasifier. Then it is found that the gas contains 0.1-10% 'tars.' The rest of the time and money is spent trying to solve this problem. Most of the gasifier projects then quietly disappear. In some cases the cost of cleaning up the experimental site exceeds the cost of the project! Thus 'tars' can be considered the Achilles heel of biomass gasification. (In the gasification of coal, a more mature technology, the 'tars' (benzene, toluene, xylene, coal tar) are usefulfuels and chemicals. The oxygenated 'tars'from biomass have only minor use. With current environmental and health concerns, we can no longer afford to relegate 'tars' to the nearest dump or stream"
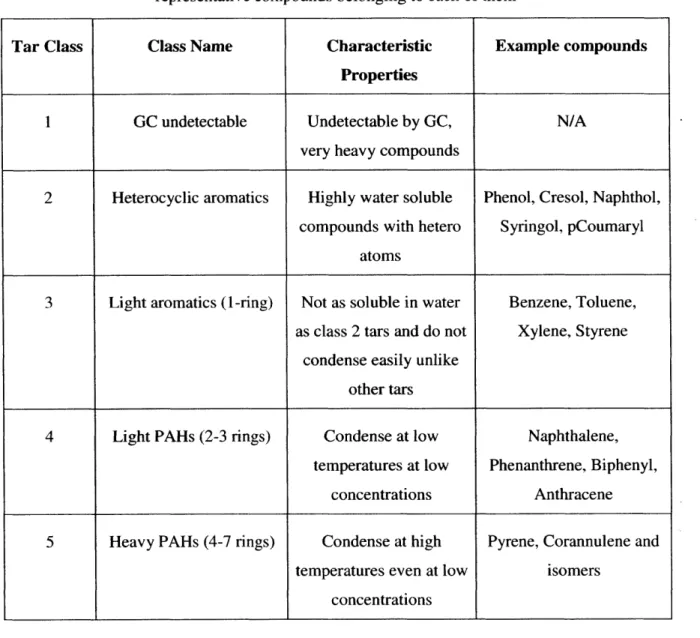
Based on their water solubility characteristics and condensation temperatures, tars had been classified into five different classes [7]. The list of the characteristic properties that differentiate these different tar classes as well as some of the representative chemical species belonging to each of the classes is listed in Table 1-4.
Table 1-4: Tar classification: Characteristic properties of the various tar classes and representative compounds belonging to each of them
Tar Class Class Name Characteristic Example compounds
Properties
1 GC undetectable Undetectable by GC, N/A
very heavy compounds
2 Heterocyclic aromatics Highly water soluble Phenol, Cresol, Naphthol, compounds with hetero Syringol, pCoumaryl
atoms
3 Light aromatics (1-ring) Not as soluble in water Benzene, Toluene, as class 2 tars and do not Xylene, Styrene
condense easily unlike other tars
4 Light PAHs (2-3 rings) Condense at low Naphthalene,
temperatures at low Phenanthrene, Biphenyl,
concentrations Anthracene
5 Heavy PAHs (4-7 rings) Condense at high Pyrene, Corannulene and temperatures even at low isomers
concentrations
1.4 Thesis goals
The main focus of this work has been to develop simplified models that could be used to predict the variation of tar production as well as the major gas species concentrations in biomass gasification under different operating conditions. Apart from the complex chemical reaction pathways involved, the total tar production at the gasifier outlet is also strongly dependent on the transport processes occurring inside a gasifier. However, the simulation of a detailed gasification model that couples the complex fluid hydrodynamics inside a fluidized bed gasifier with the
complicated chemical reaction pathways, inherent to biomass conversion, is computational very expensive and simplifications both in the chemistry model as well as the hydrodynamic sub-model need to be considered.
The early part of this work introduces the different chemical reaction mechanisms for biomass gasification: after a detailed discussion on the existing mechanisms available, various mechanism reduction strategies to develop compact reaction mechanisms are presented. With the aim to be used in the computational fluid dynamic (CFD) simulations of biomass gasification in the future, two separate global chemistry models, incorporating a global primary tar cracking reaction based on an existing CFD chemistry model [3], for air-blown and steam-blown gasification conditions, are proposed. A global primary tar cracking reaction is developed by studying the decomposition product composition of the most abundant primary tars, produced in the devolatilization process.
On the fluid hydrodynamics front, an improved reactor network model for Fluidized Bed Biomass Gasification is developed, based on the two-phase theory of fluidization. Starting with the original reactor network model (RNM) considered in [8], the improved model uses a combination of reactors to model the fluid hydrodynamics in the bubbling bed, including mass transfer considerations to improve the model predictions for the different tar class concentrations. The detailed chemical kinetic mechanism developed by the Chemical Reaction Engineering and Chemical Kinetics (CRECK) group at Politecnico di Milano for pyrolysis, oxidation and combustion of biomass is employed [9], for both air-blown and steam-blown gasification conditions.
1.5 Thesis Outline
The second chapter gives a comprehensive overview of the different chemistry models for biomass pyrolysis, gasification and combustion. Starting from global models used in the earlier studies on the topic, we introduce detailed chemistry mechanisms and discuss about the advantages and
limitations of these detailed mechanisms.
In chapter 3, details on the development of the global chemistry models for air-blown and steam-blown gasification conditions are presented, with emphasis on the global primary tar cracking reaction development. Finally, the accuracy of the global model predictions are studied in comparison with experimental results.
Chapter 4 deals with the development of an improved chemical reactor network model for FBBG based on the two-phase theory. After a brief overview of the existing literature in the subject, we discuss the methodology and the associated correlations used in the present study. The predictions from the improved RNM are then compared with experimental results.
The final recommendations and conclusions are presented in the last chapter.
2 Biomass Chemistry Models
An accurate simulation of the biomass gasification process requires an appropriately detailed chemistry model to capture the various chemical processes inside the gasifier. These complex chemical processes include biomass devolatilization, describing the conversion of solid biomass into char, gas and primary tars, secondary homogenous reactions of the primary pyrolysis gases, gasification of the char produced during primary pyrolysis and evolution of the various tar compounds, comprising primary tar cracking reactions and secondary tar growth, inside the gasifier [10]. It is essential that the gasification model describes the pyrolysis step in sufficient detail, since gasification always has to go through the pyrolytic stage [11]. In addition to these complex reactions, gasification is also significantly affected by the process conditions such as biomass feedstock heating rate, mixing inhomogeneities inside the gasifier and char residence times in the reactor.
The main chemical processes in biomass gasification are,
1) Primary Pyrolysis or Devolatilization
2) Secondary Homogenous reactions
3) Char gasification and combustion
4) Tar cracking and PAH growth
In literature, most biomass gasification models used simplified chemistry models to describe these chemical processes. Devolatilization was typically assumed to be instantaneous and the product composition at the end of devolatilization was used as the starting condition for modeling further chemical processes in the bed. While heterogeneous char reactions were not considered in many studies, models that included char gasification used char reactivities obtained for coal or from TGA experiments operated at low heating rates. Additionally, the change in char reactivity during conversion was not considered. Tars were usually modeled as one or two lumped species undergoing oxidation, thermal cracking and steam reforming with the corresponding kinetic parameters evaluated empirically through experiments. The effect of in-bed catalysts on the kinetics of the various reactions had also been modeled using ad-hoc correction parameters that restricted their applicability [12].
t F-.
«1
I)
rrl 4 0~ :4 P4 C:4 el Ij -J~ VI ~ 6 ~ t4~ 0 :4 CD C H :4 U: (U S 0 / C, Fi gre 2 1: Overview ol the biomass devolatilizalion process [3 . More than 8W% of the solid bioimuass is converted to volatiles and gases, whill the remai ningw fraction produces char 31 71 rEach of these sub-processes are greatly influenced by the process conditions, and hence, both the final tar concentration and synthetic gas composition at the outlet of the gasifier are sensitive to the operating conditions. While the pyrolysis product composition depends on biomass particle heating rate, particle size, biomass composition, ash and moisture content, secondary gas phase reactions are affected by equivalence ratio, bed material, gas residence time and the temperature distribution inside the gasifier [13]. Similarly, tar concentrations in the gasifier are affected by the biomass feedstock, biomass particle size and heating rate and fluidization conditions. A good chemistry model should be able to accurately predict and quantify the effects of these various operating parameters such as the moisture content, air fuel ratio, reactor temperature and pressure on the output gas composition and heating value of the output synthetic gas [10].
The different chemistry models for biomass gasification available in the literature can be broadly classified as equilibrium models and kinetic models. Equilibrium models assume that the gasification process has reached thermodynamic equilibrium during the operation and employ equilibrium calculations to evaluate the final product composition. Kinetic models, on the other hand, are mechanistic and describe the gasification process through a set of chemical species interacting with each other via numerous chemical reactions. The evolution of each species inside the gasifier is evaluated from kinetic rate expressions and the end product composition is a function of the residence time of the gas inside the gasifier.
2.1 Thermodynamic equilibrium-based models for biomass gasification
Several researchers had developed thermodynamic equilibrium based chemistry models to describe the gasification process ([13]-[21]). The main advantage with the equilibrium approaches is that they are independent of the gasifier design and hence, are very suitable for system level studies of biomass gasification. Unlike kinetic models, equilibrium models have much lower computational requirements. Equilibrium approaches assume that the equilibrium state has been reached and evaluate the final product composition through minimization of Gibbs free energy of the system.
Equilibrium approaches can be classified as stoichiometric ([14], [15]) or nonstoichiometric ([16],
[17]), depending on the presence of a definite reaction mechanism governing the interactions
between the species. Nonstoichiometric approaches dealt with minimization of the Gibbs free energy based on the input elemental composition of the feed without considering the reaction steps. On the other hand, stoichiometric approaches defined equilibrium constants for reactions by
selecting the most energetically favorable species having the lowest free energy of formation and hence, present in large quantities in the reaction mixture. However, the stoichiometric and non-stoichiometric approaches had been shown to be essentially equivalent by Jarungthammachote et al. [15]. A third quasi-equilibrium temperature (QET) approach had also been proposed ([18],
[19]). QET approaches corrected for the non-equilibrium operating regime of gasifiers by
evaluating the equilibrium composition of the gasifier at a lower process temperature than the actual one.
Equilibrium models employed a number of simplistic assumptions to describe the complex gasification process [20]. While heat losses in the gasifier were neglected in most studies, perfect mixing conditions and uniform temperature distribution inside the gasifier were also assumed. Additionally, gas residence times were considered to be long enough and the reaction rates fast enough for the mixture to reach equilibrium. These assumptions were found to be more suitable for certain gasifier configurations than others. Villanuvea et al. [21] had shown that the equilibrium approaches were better suited for entrained flow gasifiers and downdraft fixed-bed gasifiers with high operating temperatures and long residence times. On the other hand, the equilibrium
approaches were found to result in significant errors for updraft fixed bed and fluidized bed
gasifiers. Equilibrium models for fluidized bed gasifiers predicted significantly higher hydrogen
and CO, while they also under-predicted methane, C02 and tars ([21], [22]).
In conclusion, it can be said that even though the equilibrium approaches are not accurate for modeling the chemical processes inside fluidized bed gasifiers since these gasifiers do not reach thermodynamic equilibrium during their operation due to the relatively low operating temperatures and short residence times ([10], [23], [23][24][14], [15]). Additionally, equilibrium models do not provide any information on the intermediate species concentrations or the various reaction pathways, since they evaluate only the steady state composition. However, some authors had achieved reasonable agreement between equilibrium predictions for the major gas composition and experimentally measured values ([14], [19], [24]-[26]). It should also be noted that equilibrium approaches provide a general idea of the thermodynamic bounds or limits for the different species concentrations in the gasifier.
A more detailed review of the different equilibrium models used for biomass gasification
applications could be found in the review publications by Puig-Arnavat [10], Gomez-Barea [23] and Baruah [27].
2.2
Kinetic Models for Biomass Gasification
While equilibrium approaches produced reasonably accurate results for downdraft gasifiers that operate close to equilibrium conditions, they yielded significantly erroneous predictions for fluidized bed gasifiers. Stark et al.[3] compared the equilibrium concentrations of the major gas species and tars for an air-blown fluidized bed gasifier with the experimentally measured values. Equilibrium calculated predicted that methane was entirely consumed by the outlet of the gasifier and the presence of heavy tar compounds was also found to be negligible in the synthetic gas. However, experiments observed significant concentrations of both methane and tars at the gasifier outlet. In addition, the equilibrium approaches under-estimated the CO2 concentrations and
over-predicted the H2 and CO yields. In order to address the significant errors associated with the
equilibrium approaches, detailed kinetic models had been employed to describe biomass gasification. This section presents a brief overview of the various kinetic models employed in literature for biomass gasification.
Unlike equilibrium approaches, Kinetic models described the biomass gasification process mechanistically using a set of relevant chemical species interacting with each other via chemical reactions and employed kinetic rate expressions to evaluate the species evolution inside the gasifier. Therefore, kinetic models were more accurate than the equilibrium approaches, especially when the operating state of the gasifier was far off from equilibrium, as in the case of fluidized bed gasifiers.
As mentioned earlier, biomass gasification consists of a number of different chemical processes occurring concurrently inside the gasifier. Therefore, the kinetic model should include a component that describes the transformation of solid biomass into the primary pyrolysis/devolatilization products. It should also contain a set of relevant chemical species and reactions to represent the secondary homogenous reactions of the primary pyrolysis products. This part of the mechanism would include the gas phase oxidation reactions, tar cracking and PAH (polycyclic aromatic hydrocarbons) growth reactions as well as the water gas shift reaction. An additional component of the mechanism should describe the heterogeneous oxidation and gasification reactions of the char produced during biomass devolatilization.
2
5" * I;1~~rn I~~~1 t;-~,, (sit 1 fl7OV \ [~] -LA..jUIIJ I)IIUIII ~UILAIIULI'.JII ~.LtL iXJIJ'I~J [.JJ
Equilibrium calculation (at 1103K) [3]
20% * Experimental data [13] 10
i:
H20 < H2 CO H20 C02 CH4 Balance (Tars)Figure 2-2: Comparison of the equilibrium concentrations of the major gas species (H2, CO,
H20, C02. CH4) and tars with the experimental observations ([3]. [13]) 2.2.1 Global Models
Biomass devolatilization, which is the degradation of solid biomass into volatiles, gases and char. is an important process in biomass gasification. As noted by Gerber et al. [28]. the final product gas composition and tar concentration at the gasifier outlet depend significantly on the biomass devolatilization product composition. This was because, a large fraction of solid biomass is converted to volatile gases during devolatilization and the composition of these volatiles affect the output synthetic gas composition. Hence, biomass devolatilization had received significant attention over the years. A number of different models had been proposed to accurately describe biomass devolatilization.
Biomass devolatilization models could be broadly classified as.
1. One component mechanisms
2. Multi component mechanisms
One step mechanisms described the biomass devolatilization process as the degradation of a single
biomass pseudo-species under the assumption that all the different biomass constituents (cellulose,
hemicellulose and lignin) degraded at the same rate. This assumption was valid under fast heating
rates when the decomposition curves of the different biomass components tend to merge. The
one-step mechanisms were further classified as [29],
1. One step global models
2. One stage multi-reaction models
3. Two stage semi global models
One step models used a single step first order reaction to describe the degradation of solid biomass
into volatiles, light gases and char. Volatiles are the large organic compounds such as levoglucosan
that typically condense at room temperatures, and play a significant role in the gasification process
as tar precursors. In one step multi-reaction models, the biomass degradation process was modeled
through a set of simultaneous and competing first order reactions, as proposed by Shafizadeh and
Chin [30]. Two stage semi-global models considered biomass pyrolysis as a two-stage process,
employing a first order reaction to describe the initial biomass break-up followed by an additional
set of reactions to represent the subsequent evolution of the first stage products.
One step global models
Biomass
-(Volatiles
+ Gases)i + (Char) 1One stage multi-reaction models
Biomass -(Volatiles
+
Gases)
1Biomass
+
(Char) 1Two stage semi-global models
Biomass
-(Volatiles
+ Gases) 1 + (Char) 11.0
4
0.8
cellulose
0.6
hemicellulose
r
p
Q.4
/0.2
ognin
0 0 .,t#<-400
500
600
700
800
T [K]
Figure '2-3: Total Biomass decomposition rate represented as
the
sum of individual decomposition rates of the major components: cellulose, hemicellulose and 1ignin1121
Multicomponent mechanisms were more detailed and described biomass devolati1ization as the combination of' individual decompositions of the three biomass constituents: cellulose,hemicellulose and
lIgnin.
It was assumed that the three biomass components do not interact vitl eachother,
even though there was a considerableoverlap
between the individual decompositiontimelines.
Figure 2-3 depicts the decomposition of (he solid biomass as a sum of the individual degradation of the different biomass constituents at very slow heatin ti rates (5IK/min). Hemicel ulose and cellulose decomposed independent of each other, while lignin degradation wasrelatively slow and spread over
a
wide range of temperatures.The kinetic parameters for the individual decomposition reactions were obtained from thermogravimetric experiments, and depended significantly on the particle heating rates. It was noted that there wa ere significant uncertainties in the biornass pyrolysis kinetics due to the inherent difficulties associated with studying the phenomena [12 . During biomass devolatilization. the
chemical and transport processes were found to interact strongly which made it very difficult to
obtain kinetic mneasurements under a purely kinetic control. In addition. the effect
of
the secondarygas phase reactions of these devolatilization products had to be minimized. This was done either
by using smaller sample sizes or by operating the experiments at lower reaction temperatures (less
than 773K) ([12], [31]).
While the initial devolatilization step played a significant role in determining the end product composition, the secondary homogenous reactions underwent by the devolatilization products were also equally important. These reactions included the homogenous reactions occurring in the vapor phase, and the heterogeneous reactions involving the char produced during devolatilization. The final tar concentrations were influenced by the different tar cracking and polymerization reactions occurring during this stage. In a majority of the studies, these reactions were typically represented by one or two global reactions, representing the conversion of the primary tar into light gases and a non-reactive condensable tarry component, as proposed by Antal ([32], [33]).
k, Tars -> Gas k2
Tars -+ Inert Tar + H20
Unlike primary pyrolysis, the secondary reactions had not been as well studied and there was great variability in the kinetics reported by different authors. This was partly due to the widely different primary pyrolysis conditions used in the various experiments. The specific biomass feedstock used, presence of catalytic species, differences in the tar measurement equipment played an important role in the evaluation of the kinetic parameters. While most authors [12] assumed the tar cracking kinetics to be linearly dependent on the total primary tars produced in the devolatilization process, others ([34], [35]) had considered only a fraction of the primary tar to be involved in the cracking process. A few studies ([36], [37]) had also considered tar fractions with different reactivities, to compensate for the low activation energies encountered in the previous models.
A detailed review on the different physical and chemical models used for modeling the biomass
pyrolysis process could be found in the review publication by Di Blasi [12].


![Figure 1-4: Schematic of an industrial Biomass gasifier for electricity generation (reproduced from [6])](https://thumb-eu.123doks.com/thumbv2/123doknet/14285438.492056/24.918.189.805.409.966/figure-schematic-industrial-biomass-gasifier-electricity-generation-reproduced.webp)

![Figure 2-4: A representative global model depicting the different reactions in biomass gasification [23]](https://thumb-eu.123doks.com/thumbv2/123doknet/14285438.492056/39.1187.114.931.283.667/figure-representative-global-depicting-different-reactions-biomass-gasification.webp)

![Figure 3-2: Variation of the outlet ens composition with the secondary pyrolysis model employed (reproduced from Gerber et al 1_28])](https://thumb-eu.123doks.com/thumbv2/123doknet/14285438.492056/57.918.215.663.281.580/figure-variation-composition-secondary-pyrolysis-employed-reproduced-gerber.webp)
