HAL Id: halshs-01675684
https://halshs.archives-ouvertes.fr/halshs-01675684
Preprint submitted on 4 Jan 2018HAL is a multi-disciplinary open access archive for the deposit and dissemination of sci-entific research documents, whether they are pub-lished or not. The documents may come from teaching and research institutions in France or abroad, or from public or private research centers.
L’archive ouverte pluridisciplinaire HAL, est destinée au dépôt et à la diffusion de documents scientifiques de niveau recherche, publiés ou non, émanant des établissements d’enseignement et de recherche français ou étrangers, des laboratoires publics ou privés.
Cluster policy. The case of ‘Secure Communicating
Solutions’ in the French Provence-Alpes-Côte d’Azur
Region
Christian Longhi
To cite this version:
Christian Longhi. Cluster dynamics: learning from Competitiveness Cluster policy. The case of ‘Secure Communicating Solutions’ in the French Provence-Alpes-Côte d’Azur Region. 2017. �halshs-01675684�
Competitiveness Cluster poliCy
the Case of ‘seCure CommuniCating
solutions’ in the frenCh
provenCe-alpes-Côte D’azur region
Documents de travail GREDEG
GREDEG Working Papers Series
Christian Longhi
GREDEG WP No. 2017-42
https://ideas.repec.org/s/gre/wpaper.html
Les opinions exprimées dans la série des Documents de travail GREDEG sont celles des auteurs et ne reflèlent pas nécessairement celles de l’institution. Les documents n’ont pas été soumis à un rapport formel et sont donc inclus dans cette série pour obtenir des commentaires et encourager la discussion. Les droits sur les documents appartiennent aux auteurs.
The views expressed in the GREDEG Working Paper Series are those of the author(s) and do not necessarily reflect those of the institution. The Working Papers have not undergone formal review and approval. Such papers are included in this series to elicit feedback and to encourage debate. Copyright belongs to the author(s).
Cluster dynamics: learning from Competitiveness Cluster policy. The case of ‘Secure Communicating Solutions’ in the French Provence-Alpes-Côte d’Azur Region
Christian Longhi
Université Côte d’Azur, GREDEG, CNRS, 250, Rue A. Einstein, Sophia-Antipolis, 06560 Valbonne, France
longhi@gredeg.cnrs.fr
GREDEG Working Paper n° 2017-42
Abstract.
The paper aims to identify the forms and dynamics of the organizational structures of high-tech clusters overtime. Since Markusen (1996), it is well acknowledged that diversity is an emergent property of clusters, but the interactions between local and non-local actors of the clusters are difficult to trace because of lack of relevant data. The cluster policies developed to fix the network failures between the heterogeneous actors – large and small firms, universities, research institutes – of the current processes of innovation provide new information opportunities. In France, Competitiveness Clusters work as a “factories of project”; the information they produce on collective R&D projects applying for subsidies provides a proxy of local and non-local relations of the clusters. Social network analysis is used to infer the organizational structure of the collective learning networks and trace their dynamics. The case studies considered are Sophia-Antipolis and Rousset, two high tech clusters which belong to the same Competitiveness Cluster, ‘Secure Communicating Solutions’ in the Provence-Alpes-Côte d’Azur Region. The paper highlights the decoupling of the two clusters overtime as a consequence of distinctive organizational structures. The diversity of the dynamics of the collective learning networks which emerges through the analysis of the collective R&D projects in the two high tech clusters shows that knowledge creation and innovation can follow different paths and questions the public policies implemented.
Keywords. Cluster Policy, Competitiveness Cluster, Collective Learning Networks, Innovation, Social Network Analysis, Sophia Antipolis, Rousset,
1. Introduction
Clusters and cluster policies are today commonly acknowledged as sources and engines of knowledge creation, innovation and economic performance. They have emerged as the organization of the industry matching the knowledge based economy in the prevailing context of globalization. Global innovation networks gathering different organizations and locations
are pivotal elements of this economy. They are usually regarded as rooted in clusters relating complementary specific capabilities (Rychen & Zimmermann, 2006).
Clusters are defined as “geographic concentrations of interconnected companies, specialized suppliers, service providers, firms in related industries and associated institutions in particular fields that compete but also co-operate. (They are) a form of network that occurs within a geographic location, in which the proximity of firms and institutions ensures certain forms of commonality and increases the frequency and impact of interactions” (Porter, 1998). Clustered firms have been shown to growth and innovate faster than non-clustered ones (Audretsch & Feldman, 1996, Porter, 1998), mainly because of their capacity to create and diffuse knowledge and sustain competitive advantage (Bathelt et al., 2004, Storper & Venables, 2004). But these processes are neither straightforward nor automatic, nor governed by the same model. Geographical proximity is not a sufficient condition for diffusion of knowledge (Cassi & Plunket, 2013). “Best practice models” derived from high-tech areas and well performing regions have often been defined as “ideal model” for innovation policy as innovation activities (Tödtling & Trippl, 2005). Nevertheless the “one size fits all” (Tödtling & Trippl, 2005) questioning addresses this Silicon Somewhere copycat (Hospers, 2006). If the cluster approach provides a useful general analytical framework to model the knowledge based economy, diversity appears to be its main feature. The “commonalities and complementarities” defined by Porter (1998) can take different forms.
A basic seminal reference to capture the implications of the possible forms of interactions between the different actors on clusters remains Markusen (1996). The nature and intensity of interactions are not associated with physical proximity, but with the organizational structure that governs these interactions (local and external) between firms and institutions. A clear, relevant taxonomy for cluster configurations is derived from the nature of these interactions. The different forms empirically identified by Markusen (1996) – industrial districts, hub-and-spoke districts – reflect the organization of the economy of the last century. They were mainly related to industrial production; but other forms have emerged more recently, mainly related to production of knowledge and innovation. Clusters are open, evolving complex systems (Garnsey, Longhi, 2004) which can also serve as a basis for analyzing (localized) knowledge-creation processes. Openness is indeed the second main feature of clusters in the contemporaneous economy, in different senses. Many studies have shown that the creation of knowledge is less and less an isolated process internal to individual firms but a collaborative process involving networking of heterogeneous organizations (Caloffi et al., 2012), often
associating different knowledge bases or technologies (Balland et al., 2013). Large and small firms, universities, public or private research institutes networked in these innovative clusters are also increasingly setting up linkages with organizations outside of the geographical boundaries of the cluster to access to external complementary knowledge bases and global innovation processes (Cassi et al., 2012; Turkina et al., 2016).
As already emphasized, these local or trans-local processes are neither straightforward nor automatic. Knowledge is far from ‘being in the air’ in existing clusters (Cassi, Plunket, 2013, Fitjar & Rodríguez-Pose, 2017), it is increasingly agreed upon that it cannot be assumed beforehand that all firms in a cluster are involved in local networks of collective learning (Breschi & Lissoni, 2001, Bell & Giuliani, 2005, Giuliani, 2005, ter Wal, 2013). Geographical proximity is not a sufficient condition to access knowledge or for diffusion of knowledge (Cassi & Plunket, 2013), other dimensions of proximity, organizational or cognitive, have been developed (Boschma, 2005, Torre & Rallet, 2005) which can account even more than co-location (Longhi, 2016).
The locus of innovation in clusters is thus to be found in networks of inter-organizational relationships (Powell et al., 1996, Boschma, 2006, Fleming & Frenken, 2006, Broekel & Boschma, 2016). The roles and positions of the organizations are not distributed uniformly within and across the clusters, they reflect and foster the emergent structures of the clusters. As underlined by Turkina et al. (2016), a natural tool to investigate the interwoven nature of linkages within and between clusters is social network analysis (Giuliani & Bell 2005; Owen-Smith and Powell, 2004). The different concepts, measures and indexes related to networks can allow to draw the related structures of the contemporaneous innovative clusters involving interdependent heterogeneous organizations, and complement the original taxonomy of Markusen (1996). The paper intends to address this issue empirically; still relevant databases must be built to model the clusters. The formal and informal relations prevailing in the collective learning networks in clusters are difficult to trace, and proxies must be used. Surveys can be conducted on small networks (Giuliani, 2005), but patent databases (Powell et al., 1996, Fleming & Frenken, 2006, ter Wal, 2013) or collaborative R&D subsidies (Broekel. 2015, Balland et al., 2015, Longhi, 2016, Maggioni et al., 2007) are more often used to analyze the knowledge creation or innovative processes. As emphasized by Broekel & Mueller (2017), it has been shown that “knowledge networks based on subsidized R&D collaboration have similar properties and determinants as networks not based on subsidized collaborations. Consequently,
subsidies data on joint R&D projects is suitable for constructing innovation networks” (Broekel & Mueller, 2017, 10).
This paper rests also on applications to R&D subsidies to collaborative networks of heterogeneous actors. Indeed, at least as much as researchers, policymakers have turned to be interested in clusters and networks. The implementation of cluster policies as relevant for firms to cope with the challenges of the knowledge-based economy as well as the growing complexity of technology management has been promoted worldwide. Cluster policies, cluster strategies, cluster development programs… have been actively developed (Uyarra & Ramlogan, 2012, Giuliani & Pietrobelli, 2011) “to promote economic development by forming and strengthening inter-organizational networks”. When past industrial policies focused on subsidies to firms internal R&D processes and addressed market failures, the R&D or new industrial policies focus on collective learning process through joint R&D projects and address network failures (von Tunzelmann, 2010). The policy intends to allow the economy to benefit from underused complementary knowledge and resources, from better relations between large and small innovative firms, research institutes, to achieve structures of networks that affects positively the cluster outcomes, according an implicit “ideal model”. After the ‘Inter-ministerial Committee for Spatial Planning and Development’ of September 14th 2004, the cluster strategy
has been embodied in France in the “Competitiveness Cluster” (CC) policy, which will be used in the paper to trace the structure and the evolution of high tech clusters. The French policy consists on ‘increasing top-down pressures on regions or local areas to position themselves’ (Kiese, 2006), i.e. to build projects of development based on their technological capabilities or knowledge bases, the definition and governance of the projects being entrusted to firms and research institutes, the heterogeneous actors involved in the processes of creation of knowledge and innovation.
The paper focuses on a specific CC, “Secure Communicating Solutions” (SCS), located in the French region of Provence-Alpes-Côte d’Azur (PACA). It is particularly interesting for our purpose related to clusters and collective knowledge networks dynamics. It is indeed a matter of bringing together complementary skills located in two existing high tech clusters in order to create new synergies between different kinds of partners, between different clusters, and between different types of technologies. The paper builds on the information produced by the Competitiveness Cluster policy on local and distant relations to characterize the collective learning processes in the associated clusters and draw their dynamics. The aim is not to assess directly the policy implemented as such, but to confront the Competitiveness Cluster – the
policy – and the different clusters it addresses to characterize the specific organizational forms of knowledge creation and the collective learning processes at work in the clusters, to infer the prevailing dynamics of these processes and to illustrate empirically the ‘one size fits all’ issue discussed in the literature (Tödtling & Trippl, 2005).
The aim in microelectronics is to merge skills from “silicon to uses” to address the markets, to reduce or resolve organizational and cognitive distances.
Section 2 presents the policy and the clusters supporting the CC considered. The pole aims to foster collective R&D networks of heterogeneous agents and produces basic sources of information on these processes. Section 3 builds a relevant database from the working of the CC to address the dynamics of the CC and of the clusters implied in the policy, and present the methodology implemented in the related empirical analysis. Section 4 implements a social network analysis of this database to characterize the organizational forms promoted by the firms and embedded in the clusters. Section 5 focuses on proximity issues and identifies the different types of learning networks in the clusters. Section 6 builds a proxy of the collective networks at work in the clusters from the dynamics of the R&D projects implemented in the pole. Section 7 concludes.
2. “Competitiveness Cluster” and clusters: presentation of the cases
“Competitiveness Cluster” policy and clusters are intended to accelerate knowledge creation, innovation and structural change in the prevailing knowledge based economies. The analysis of the dynamics of the clusters is thus pivotal to follow these structural changes overtime. The paper focuses on two clusters supported by a CC, the form cluster policy has taken in France. The policy and the clusters are rapidly presented in the following.
2.1. Definition of the policy
Competitiveness Clusters have been defined as the new French industrial policy, aiming at reinforcing the specializations of the economy, strengthening the attractiveness of the territory and favoring the emergence of new activities via synergies between research and industry. They are defined as “the combination on a given geographic space of firms, training institutions and public or private research centres engaged to generate synergies in the execution of shared
innovative projects. The partnerships can be oriented towards a market objective or a scientific and technological domain” (Interministerial Delegation for Territorial Competitiveness and Attractiveness’, 2005).
The key words of the definition of the CC are “collaborative innovative projects” entailing heterogeneous actors. CC are not financed directly by the public policy, but according a two-step process: their members only are financed when the R&D projects they propose to dedicated calls are selected. The CC works as a “factory of projects”; to apply to a call, R&D projects have to be labelled by the governance of SCS. In the following, the paper considers all the projects labelled by SCS applying to the calls, either finally financed or not, as they depict the working of the relationship between actors and the corresponding collective learning networks. The policy aims thus basically to provide incentives to foster local interactions, cooperation, to strengthen the performance of the clusters regarding innovation and creation of knowledge, in line with the network failure argument of the policy.
Interestingly SCS is built on two existing clusters resulting from the old French industrial and regional policies characteristic of the last century, the microelectronics activities in the ‘Bouches du Rhône Département1’, along an axis running from the town of Rousset to the town
of Gémenos, and the high-tech activities of the ‘Alpes-Maritimes Département’, broadly centered on the technology park of Sophia-Antipolis. They were both created ex nihilo, but in different ways. The former originated in the context of various plans intended to develop a technology sector, in this case microelectronics. The latter originated in the context of regional policy, supported by a public policy of decentralization and public investment in telecommunications infrastructure. SCS is meant to “bridge” elements of a value chain dispersed in the two existing clusters, in addition to the traditional failures between heterogeneous actors (large and small firms, public and private research) or related technologies usually tackled.
2.2. History of the clusters: Rousset and Sophia-Antipolis
The microelectronics cluster in the town of Rousset is a pure product of the traditional French industrial policy, which was centralized and made up of plans implemented by “national champions”. The plans have led to the creation from scratch of the company Eurotechnique in
the industrial area of Rousset in 1979 to build and develop the industry, followed by the government-led location of Thomson-EFCIS, Nanomask (later Du Pont Photomasks), different merging which gave rise to the group SGS-Thomson Microelectronics, called STMicroelectronics, and the development of a dense cluster of subcontractors (Daviet, 2000, 2001, Garnier & Zimmermann, 2004, Mendez et al., 2008, Rychen & Zimmermann, 2000). A second phase was characterized by the founding of the company Gemplus, now Gemalto, and the emergence of an innovative industrial web between Rousset and the neighboring town of Gémenos, where Gemplus was located. Gemplus has been created as a spin-off of Eurotechnique-Thomson Components based on a radical innovation, the design and production of cards. It has triggered a movement of endogenous development based on local capabilities. The area grew as a hub-and-spoke cluster in the Markusen taxonomy, large firms surrounded by a dense set of specialized sub-contractors.
Nevertheless, the microelectronics industry still experienced crises and threats of large companies which had to close down. These crises led to the founding of various associations with the aim of consolidating activities. In particular, the creation of active industrial associations (CREMSI, which later became ARCSIS), which were founded by the management of the large companies with the aim of creating linkages between industry and science, including SMEs, and seeking and obtaining public support for the implementation of projects (Zimmermann, 2000). These actions were coupled with the creation of large research institutes, gathering elements that had until then been disparate. At the time the cluster policy was implemented, there was thus already a well-designed structure for interactions in the Rousset-Gémenos cluster.
Sophia-Antipolis is the core of the pole area based on the Alpes-Maritimes. It is the result of regional policies promoting the creation of high-value-added activities implemented in the context of spatial planning. This project was born in a region without any industrial or academic tradition; its only resources were linked to its main activity at the time, tourism. The success of the project was determined by the involvement of Pierre Laffitte, a former director of the ‘École nationale supérieure des mines de Paris’ who created and stimulated the project, of France Télécom which gave Sophia-Antipolis an advanced telecommunication infrastructure, and the proximity of an important international airport (Longhi, 1999). Up to the beginning of the 1990s, Sophia-Antipolis grew through the accumulation of external resources. The project benefited from the French policy of decentralization, with the IT centers of large French firms which moved there, and from the ‘multinationalization’ of the 1970s and 1980s, when
American companies set facilities in the European market. On these bases, Sophia-Antipolis took off through companies being attracted by the quality of the available (telecom) infrastructures to set up and manage their European markets or their global telecommunication networks. In addition, the project attracted education and research centers, which contributed to the emergence of a qualified labor market.
The project grew as a satellite platform in the Markusen sense: a system of rich exterior relations (albeit poor in local interactions) led from outside for external markets. Resources were fundamentally internalized within the companies, the absence of local resources or their strategies having led them to build self-contained ensembles. The growth slowed considerably at the beginning of the 1990s with the economic crisis that struck the computer science activities. But basically, the factors of success of Sophia-Antipolis, a platform endowed with efficient infrastructures to develop markets or activities were at odds with the new phase of globalization. Another organizational form had to be built.
As in the Rousset, industrial associations played a considerable role to face the crisis and favour the emergence of collective processes in Sophia-Antipolis. In particular the association Telecom Valley grouped together all the telecommunications and microelectronics actors, including large and small companies and research centers. To face the risks of de-localization, it aimed at highlighting the skills that were specific to Sophia-Antipolis and its indisputable importance at the European level. Finally, the emergence of mobile technologies and Internet led to a revival of the cluster, with these technologies originating within a number of local companies, making Sophia-Antipolis a key location in the European high-tech industry. The establishment of facilities by large corporations no longer took place by means of huge investments and transfers of human resources, but through knowledge-led strategies, the establishment of small units that took advantage of the skills and qualified resources produced or already available locally.
In short, the two clusters seem to have grown according very different organizational structures, based (to quote Markusen, 1996) on the hub-and-spoke and the satellite platform forms respectively. The consequences of this conjuncture will have to be tackled though the network analysis of the clusters.
3. Definition of the database
SCS was created around the idea of bringing together leaders in microelectronics, telecommunications and software to cover the entire value chain from silicon to its uses on the markets and take advantage of the convergence of these various industrial sectors. It groups together local actors in two clusters located in areas of the ‘Départements’ of Bouches du Rhône [13] and Alpes Maritimes [06]2. Needless to say, the CC does not involve all the “Départements” as such. Its boundaries are discontinuous and endogenous. It does not cover the areas of administrative units, but rather the agglomerations of resources (“R&D zones”) that make up the project3. The territory is endogenous as its frontiers are defined with the project of
development it supports, which matches the resources involved in.
The CC does not also gather all the firms and institutions of the areas it covers. It has the institutional form of French ‘Association’ acting for its members; one has to join formally the association, to pay fees to be involved in. The pole has involved around 600 members over its history, some (the large firms, the research institutes) are permanent members, others (the SMEs) enter and exit depending of their R&D projects, for an annual average of roughly 250. The core of the activity of a CC is made of R&D projects. These projects do not cover entirely the formal inter-firm R&D alliances and even more the informal local network relationships related to knowledge, learning and innovation in the clusters. They are a specific subset of the collective learning networks, with a form imposed by the rules of the games of the poles and the call addressed, usually partnerships involving necessarily SMEs and research institutes, rules some firms consider restrictive enough not to compete for public research subsidies. Nevertheless, a lot of R&D relationships are today mediated through the poles which provide reliable information on previously unknown collaborative activities. The projects labeled by the governance system of the pole forms thus a good proxy to grasp the local R&D activity, the nature of local interactions and local collective learning networks, as well as linkages with external partners. This conjecture is confirmed in the literature, as far as it has been shown that knowledge networks based on subsidized R&D have similar properties and as networks not
2 These numbers refer to the French départements units nomenclature. Hence, [06] Sophia-Antipolis (Alpes Maritimes) and [13] Rousset-Gémenos (Bouche du Rhône). For the sake of simplicity, we will use département numbers to refer to the clusters, speaking of [06] or [13] projects or partners, or [0] when an external partner is involved in a project.
3
based on subsidized collaborations (Broekel & Mueller, 2017) when formal relations are considered.
The pole has labeled 447 R&D projects during the period 2005–2014 under analysis, which indicates a sizeable amount of activity. This database is the basic information used to highlight the collective learning networks running in the pole (Longhi, 2016). It gathers the main characteristics of the projects: the nature of the call addressed, basically calls specifically aimed at poles and financed by an inter-ministerial fund [FUI], calls by the Regional Council [CR] and calls by the National Research Agency [ANR], dedicated to more basic research; the location and nature of the project leader (industrial group, SME, academic institute, association); the location and nature of the partners involved in the project (industrial group, SME, academic institute, association); the status of the labeled project, selected (financed) or not in the call addressed.
As already emphasized, the paper does not address directly the CC, but uses the information derived from the database of its collaborative R&D projects as a device to address the clusters dynamics. The issue is not the year a R&D project has been submitted, but the interactions it infers overtime. Elements of time dynamics of the collective learning processes have to be introduced in the analysis in building “dates” associated to the interactions.
Indeed, consider that a labeled R&D project dedicated to a call a time t. One can suppose that the partners involved in the project have at least began to interact and built the cooperative project a time (t-1).
If the project fails in the call, we will consider that the interactions between partners involved in the R&D project are restricted to t-1, t; if the project succeed the partners will continue to work together during the realization of the project, say t+1, t+2, t+3.
The “dates” reflecting the interactions of the partners involved in collective R&D projects can be built according these hypotheses. At date t, we will thus have all the projects proposed at calls in time t, the ones in preparation to be proposed at time t+1, the ones that have been financed in time t-1, t-2, t-3 and are in the course of realization.
The collective learning networks can thus be built at each “date” of the period considered. Three “dates” will be presented in the following, 2008, 2010, 2012, to highlight the evolution of the CC SCS and of the clusters [06] and [13].
The R&D collective projects have involved 760 different partners and according our definition of ‘dates’, 175 projects were implemented in ‘2008’, 239 in ‘2010’ and 173 in ‘2012’. The share of the partners belonging to [06] and [13] and to external partners [00] are given in the following table 1.
Table 1. Shares of the clusters and distant partners [00] in the R&D projects
00 06 13 2008 0.43 0.25 0.32 2010 0.53 0.20 0.27 2012 0.56 0.18 0.27 Source. SCS and own calculation
[13] is more involved than [06] in the policy; as explained supra in the history of the clusters, the local interactions have been more developed in the Rousset, where different industrial actors are born from the same seed, and where specialized sub-contracting is developed, when firms located in Sophia Antipolis have been historically less linked in collaborative processes. The definition of collective R&D projects is certainly easier in the first case. A main feature of the collective R&D projects is the large involvement of external partners, whose roughly 20 % belonging to the region ‘Ile de France’! This significant portion of external partners testifies the acknowledgement the clusters have earned in specific skills. As we will see, the local leaders build also important external partnerships to access remote knowledge. The literature has emphasized this last issue through the concept of ‘gatekeepers of knowledge’ (Allen, 1977, Morrison, 2008; Rychen & Zimmermann, 2006); as shown infra, the evolution of the clusters regarding these trans-local linkages is a pivotal element of the period.
The database of these projects allows to approximate the dynamics of the collective learning networks running in the CC. The properties of the networks can be derived from a social network analysis according to the following methodology. The R&D projects database forms a bipartite network linking the projects to the partners involved in, partners being large group, SMEs, academics. The different partners associated in a project are supposed to form a complete undirected graph, as they are involved in a collaborative process. A one-mode network of the partners can be derived from the original bipartite network; a node will represent a partner and the links connecting pairs of nodes their involvement in a common collaborative project, or collaborative learning process. Some links can thus have a heavy weight as the same
partners can be associated in many different projects. Some partners can also be involved in various projects, but not necessarily with the same actors.
4. Dynamics of SCS
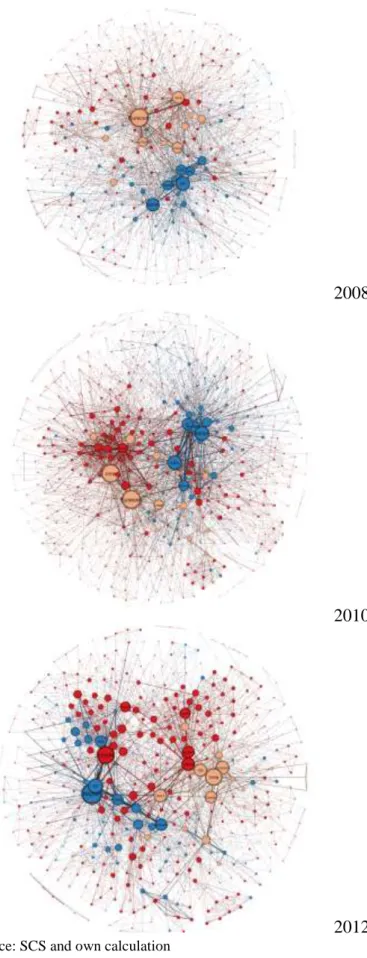
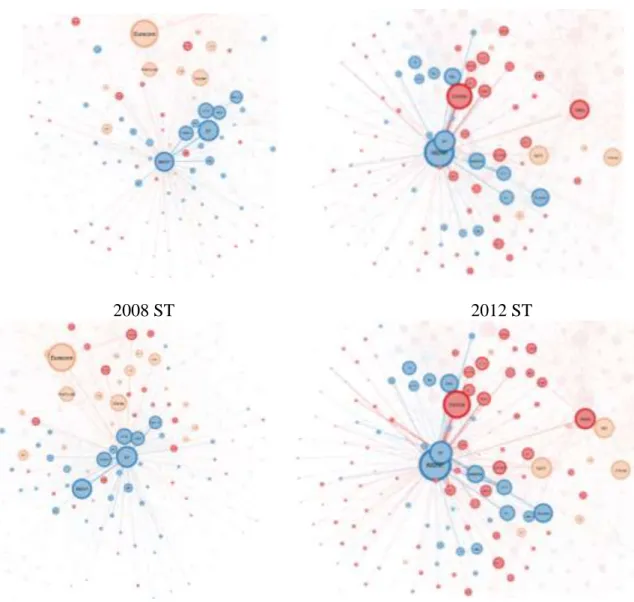
The graphs of the networks and the analysis of the associated centrality measures overtime give interesting insights on the clusters. The figure 1 presents these graphs of the CC using the Fruchterman-Reingold visualization algorithm, which displays the most inter-connected nodes close to each other. The following conventions have been adopted for the nodes attributes: nodes representing partners located in [13] are blue, in [06] are yellow, in [0] are red, the relative size of nodes in a graph is proportional to their degrees, i.e. the number of nodes that the node is connected to, the width of an edge to its weight.
Regarding the CC SCS first, the analysis of the R&D networks overtime shows clear changes in the involvement of the clusters in the policy and in the inscriptions of the collective learning networks across the clusters. The actors involved and the interactions has increased in the first years, to slow down at the end of the period, as shown in table 2.
Table 2. Nodes and edges evolution
2008 2010 2012 Nodes 398 503 425 Edges 2036 2957 2409 Density 0.026 0.023 0.027 Source. SCS and own calculation
The graphs presented in figure 1 show core-periphery structures, i.e. groups of highly inter-connected nodes, the core of the partnership networks, inter-connected with peripheral nodes. These last nodes are strongly connected to the core, but not much inter-connected, as the analysis infra of the distribution of degrees will confirm. These core-periphery networks have often been considered as efficient for learning processes and viability of the high-tech clusters. They allow spreading information quickly (Borgatti, 2006). They are also a condition of the resilience of the clusters (Crespo et al., 2013), the firms or institutes of research involved in strong ties in the core access to weak ties in the periphery to renew knowledge bases and sustain the
innovative processes. The notion of periphery does not refer to geographic distance, but to the properties of the networks, and often cognitive distances.
As already emphasized, the partners external to the regional clusters play an important role; they are in the periphery of the graphs and involved in the process of renewal of the knowledge base, but also in the core of the networks. The core of [13] is made of dense and balanced inter-connected relations of large firms (STMicroelectronics, Gemalto), research institutes (ENSMSE, IM2NP, AMU) and some related SMEs, when [06] is mostly restricted to institutes of research, at the exception of Orange, in fact the research center of Orange located in Sophia-Antipolis. The large groups of Sophia-Antipolis4, Texas Instrument, IBM, Amadeus… are not present in the core of networks of labelled R&D projects, even if active in industrial associations and permanent members of the pole. Most are international groups. Nevertheless, path dependency linked to the organizational form of satellite platform on which the cluster has grown is certainly part of the explanation. Figure 2 presents some centrality measures derived from the analysis of the SCS network.
The evolution over the three ‘dates’ depicted in the graphs figure 1 highlights a clear transformation of the local context. In “2008”, the pole is structured around two distinct groups of interactions gathering partners of the [06] on the one side, partners of the [13] on the other side, the network of the [06] mainly organized around Eurecom and Inria being the more dense. “2010” seems to convey a transition, an increasing importance of the external partners, which moves from peripheries to the cores, with increasing degrees. In “2012” the collective networks have deeply evolved, the [06] side has weakened, the [13] side has strengthened towards a cohesive core and dense networks, a deeper involvement of the research institutes and a reinforced interdependence with external partners. The last graph is roughly the symmetric of the first regarding the relative importance of [06] and [13] internally and externally.
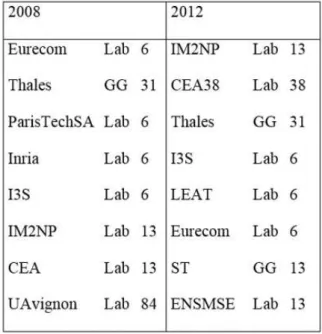
These different conclusions are confirmed in table 3. Different centrality measures have been used to characterize the involvement of the partners in the collective learning network, degrees and weighted degrees (i.e. first the number of nodes that a node is connected to, and second the number of nodes that a node is connected to weighted by the weights of the edges), betweenness centrality, displayed in table 3. Regarding degree or weighted degree centrality, IM2NP has overtaken Eurecom and Inria in the pole, and ST Microelectronics in [13]; there is a balance of
firms and research institutes in the core of the network in [13], when only research institutes are remaining in [06] regarding the higher weighted degrees. The Rousset-Gémenos-Marseille cluster has evolved towards a technopolitan district5, open to external cooperation, and rather untied from Sophia Antipolis. The project of SCS, to create intra-pole linkages “from the silicium to the uses” has not yet been achieved. In table 3 thus, regarding the decreasing weighted degrees by dates, Eurecom [06] was largely the main important broker of the CC, followed by ST Microelectronics [13], Inria [06] and IM2NP [13]. In 2012 the ranking is IM2NP [13], CEA38 [38],
ST Microelectronics [13] and Thales [31], as if the CC core was evolving from in-between clusters towards trans-local relations.
Nevertheless, another measure of centrality, betweenness centrality, is worth to be considered. The index measures how often a partner appears on shortest paths between all others partners of the network. Knowledge exchanges within the network are likely to flow through the high betweenness partners. They can perform brokering role across the clusters as they connect otherwise disconnected partners. Despite decreasing degree, the institutes of research of [06] still play an important role of brokers given their betweenness centrality indexes, they act as critical links (Roesler & Broekel, 2017) to maintain the cohesion of the CC. Again, the university and research institute of [13] and two large cohesive firms, ST Microelectronics and Gemalto, play also a pivotal role to bridge the different elements of the pole, heterogeneous actors and clusters.
5 A technopolitan district can be defined after Markusen (1996) as a district involving collaborative processes of large and small firms, research institutes according the ideal type if the “Silicon Valley model”.
Figure 1: Evolution of the CC
2008
2010
2012 Source: SCS and own calculation
Table 3. Centrality indexes of the main actors in 2008 and 2012.
Source. SCS and own calculation
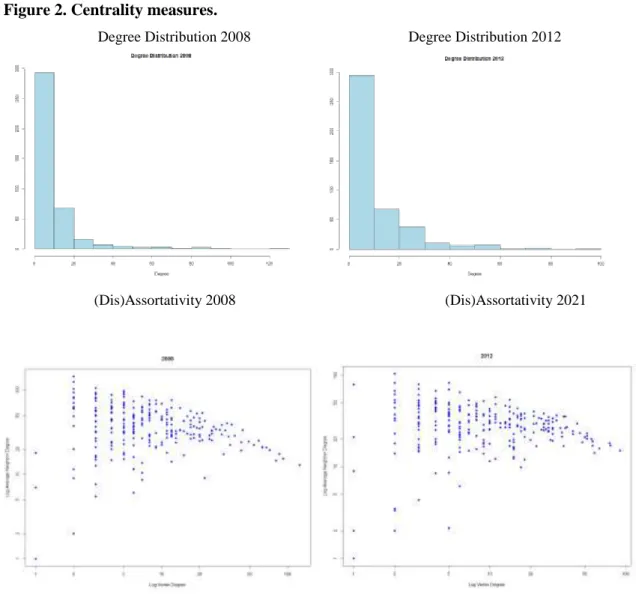
The figure 2 maps simply some indexes overtime. The degree distribution of R&D networks is highly skewed, the weighted one would be even more. Some firms or organizations appear central in the network, working as brokers, as detailed later. The shape of the distributions recalls the preferential attachment of Barabasi & Albert (1999), some nodes attracting entrants. Nevertheless, the graph appears less skewed in the end of the period.
Beyond the degree distribution, it is important to understand how nodes of different degrees are linked with each other. The last plots of figure 2 represents the average degree of the partners of a given partner in the collaborative learning network. It figures the assortativity of the network, i.e. the correlation between the centrality of a partner and the centrality of all its partners. As the quadratic form of the clouds evidences, the partners of lower degree tend to
link partly with partners of lower degree, but mainly of higher degree, and the partners with higher degrees with lower ones. The networks are disassortative, as in many technological cases (Newman, 2003), the core and the periphery are better connected. As explained in Crespo et al. (2013), the core is more open and peripheral actors holding new or disruptive knowledge can link and benefit from the well establishes core partners to find opportunities of knowledge combinations to address new markets.
Figure 2. Centrality measures.
Degree Distribution 2008 Degree Distribution 2012
(Dis)Assortativity 2008 (Dis)Assortativity 2021
Source. SCS and own calculation
Nevertheless, disassortativity is decreasing, the assortativity degree index is still negative, but has evolved from -0.12 to -0.06; according the analysis of Crespo et al. (2013), this evolution could reflect the decreasing entry of peripheral actors and constrain the renewal of the
knowledge bases. Interestingly the nominal assortativity regarding the location in clusters is increasing, reflecting some increasing homophily regarding the R&D projects actors.
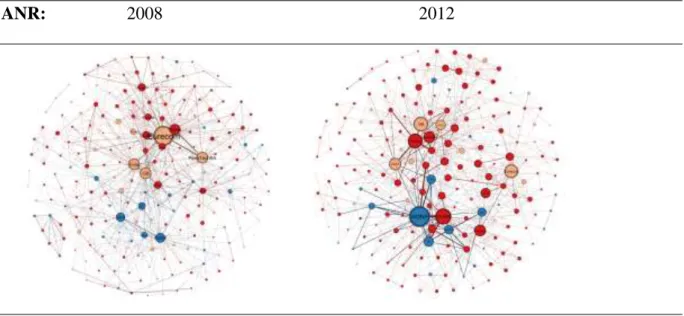
As underlined supra, a main evolution over the period regards the position of the universities and research institutes in the CC, and the emergence of leading brokers in [13]. The analysis of the ANR networks, in which these institutions plays an important role, is a revealer of the evolving flows of knowledge between actors, of the brokers organizing the process of creation of knowledge in the CC.
Table 4. Decreasing weighted degrees in ANR projects
Source: SCS and own calculation
Interestingly, the collective learning networks resulting from the involvement in ANR projects have radically changed, as if the research landscape of the pole had to face an earthquake (figure 3). In “2008”, the network was organized around the research institute Eurecom and embedded mainly in the [06] cluster, in “2012” is embedded in [13] around IM2NP and distant partners. The [06] partners seem to lose their close interdependence of the beginning of the period and to end in dispersed sub sets of distant relations. The growing embeddedness of the universities and research institutes of [13] in trans-local networks is the other main feature of the research network dynamics.
Figure 3 ANR R&D project networks overtime
ANR: 2008 2012
These evolving positions are confirmed in the table 4 depicting the decreasing weighted degrees in ANR projects. As emphasized by Roesler & Broekel (2017), while the universities and public research institutes are usually large, they engage in subsidized R&D projects through small specialized teams with high absorptive capacities, and can run simultaneously many projects. The main ones are often linked with distant partners, other research institutes or firms, and can play a pivotal role as gatekeepers. The policy has clearly triggered an important evolution of the role of the research institutes and the structure of collective learning networks in [13], from an “hub-and-spoke” cluster towards an “core-and-spoke” cluster, to paraphrase Markusen (1996),
5. Proximities
The aim of the cluster policy has been to trigger R&D networks to reinforce clusters, and in the case of SCS to create in some sense a new cluster in terms of cognitive and organizational proximities, merging the technologies and knowledge bases of heterogeneous actors from the prevailing clusters, Sophia Antipolis and Rousset, building new value chains to address the markets starting from R&D and innovation. The analysis of SCS highlights the forms of the networks that have endogenously emerged. In fact, it appears that several levels must be tackled to capture the whole induced processes at work:
- within cluster networks, the organizational form emerging between the local partners involved in the collective learning processes;
- in-between clusters networks, the bridges between Rousset-Gémenos and Sophia-Antipolis, to take advantage of weak ties (Granovetter, 1985) and structural holes (Burt, 1992), eventually to trigger the emergence of in-between strong ties and recompose the core;
- distant clusters networks finally, clusters are open, evolving complex systems (Garnsey, Longhi, 2004), local and global linkages of the firms are pivotal to their resilience, their involvement in innovative networks. Just as firms form more and more R&D alliances (Powell
et al., 1996, Nooteboom et al, 2005), clusters create mutual external links as different
knowledge bases have to be merged. Intra-cluster strong ties, high level of embeddedness, can trigger lock-in effects in declining technological paths and question the resilience of the cluster (Crespo et al., 2013). The existence of weak ties to access remote knowledge can fuel the learning process (Broekel & Mueller, 2017). ‘Knowledge pipelines’ (Storper & Venables, 2003, Bathelt et al., 2004) have to be built to renew and reinforce the local buzz, the adaptation of the core to changes. Nevertheless, regarding high tech clusters pipelines have also to allow external partners to reach the local knowledge bases to feed their own learning process with non-redundant distant knowledge. A balanced exchange of inflows and outflows of knowledge has to be maintained to secure the viability and growth of the high-tech clusters.
The intra, inter, and distant links have been addressed building three different networks, the one made of projects whose leaders belong exclusively to [06], the one made of projects whose leaders belong to [13].
The percentages of partners from intra, inter, and distant cluster partners in these networks highlight the nature of the proximities. They are mapped in the figure 4.
Figure 4 Intra, inter, distant nodes from 2008 to 2012
Source. SCS and own calculation
The evolution of the two clusters seems unequivocal, and confirm the increasing weight of [13] in the CC. Sophia Antipolis is born as a “satellite platform” in the Markusen (1996) sense, reflexted by the importance of the distant partners from the beginning. The share of [13] in the projects led by [06] is increasing slightly in the last date, when the share of distant partners is decreasing. The within networks are increasing, as if gatekeepers were evolving towards coordinators, as explained infra. The evolution of Rousset, in fact [13] according our definition, is even more interesting and reflect deep changes. The cluster has evolved towards a more and more open system embedded in distant knowledge networks, following the opposite path compared to [06]. The local and in-between linkages have decreased, when the distant ones have significantly increased. Contrary to often preconceived ideas, the distant partners of [13] are important, the specificities of the local knowledge bases of the cluster appears largely
acknowledged, as were the ones of [06]. The CC has certainly contributed to this increased visibility of the local capabilities and the insertion of the cluster in trans-local networks. Summing up the different features highlighted from the analysis of the collective learning networks, the organizational forms of the clusters appear somewhat different. Paradoxically, to infer from the Markusen taxonomy (1996), one – [13] – has a “core–and–periphery” organizational form, when the other – [06] –is somewhat more “hub–and–spoke” oriented, the edges linking the hubs being lighter. Some disconnected elements seem to build nonoverlapping networks. This process can be for instance traced by the evolution of the maximal cliques in [06] and [13]. The proportion of large cliques is increasing significantly in [13], when it collapses in [06].
Table 5. Edges of the pole SCS. Weights by date.
Source. SCS and own calculation
The prevalence of disassortative learning networks linking cores and peripheries as well as the huge involvement of distant partners seems to be a sign of the renewal of the knowledge bases and of the acknowledgement of the local capabilities in SCS, even if some slowdown emerge in the last date. These dynamics are seemingly well rooted in the two clusters considered, but despite the existence of brokers like STMicroelectronics, Eurecom, IM2NP or Orange, the ties between them are perhaps limited compared to the potential cognitive bridges.
The table 5 shows clearly this deficit though the evolution of the edges ordered by weights at the different dates. Beyond the centrality measures, the weights of the edges linking the partners
gives an important information on the structure of the clusters, the cohesiveness of the related networks. The distribution of the weights is highly skewed, confirming the core – periphery structure of the networks. Indeed 80 % of the edges are of weight 1, and 16 % of weight 2 in the SCS learning network. Symbolically, the heavier edge of the networks links Eurecom [06] and a distant partner located in the region Ile de France, attesting the involvement of the pole in large innovation networks. Incidentally, Ile de France is very close and deeply inserted in the pole learning networks. The edges related to [06] involve indeed mostly research institutes, with a pivotal role of Eurecom. The case of [13] is very different; a core of cohesive partners emerges linking strongly industrial and research partners in a balanced way, with equally heavier edges linking industrial firms together, research institutes together, and firms and research institutes as well. The industrial learning network of the pole is clearly located in [13]. The table 5 clearly confirms the decoupling between [06] and [13], and the increasing involvement of external actors in the pole. The yellow rows in table 5 are edges between [06] and [13], when all others are edges within a single cluster or with distant partners. The yellow rows have not heavy weights, they have even disappeared in 2012 for weight equal or greater than 4. Clearly a cohesive core linking the two clusters has not emerged.
Some actors of the clusters play particular roles in the collective learning networks, and act as brokers among other actors. Nevertheless, these brokers can have very different profiles depending they address the group of local and the group of non-local nodes of the learning networks, as analysed in Rychen & Zimmermann (2009) and Balland et al. (2011). Following the methodology introduced by Gould & Fernandez (1989), they characterize the first type of brokers as coordinators, playing thus an important role of coordination among the local actors involved in the knowledge creation processes, and the second type as gatekeepers, which act as an intermediate for knowledge between local and non-local organizations. In the knowledge based economies, gatekeepers are pivotal to allow clusters to join the global networks of innovation that fuel the economic process. They perform different functions, a searching function for capturing external sources of knowledge, a transcoding function and a transferring function for disseminating these sources of knowledge through the local networks within the cluster (Morrison, 2008, Lazaric et al., 2008). Non-local organizations bring knowledge from outside and capture knowledge from inside through the gatekeepers (Balland et al., 2011). Nevertheless, in the SCS project three profiles must be considered, dedicated to within, in-between and distant cluster networks. Coordinators and gatekeepers running local and non-local learning networks are complemented by brokers involved in the merging of the two clusters of
Sophia-Antipolis and Rousset. Some brokers very active in this process were very active at the beginning of the CC, providing extended coordination running local and in-between networks. Eurecom and Inria for the [06], or STMicroelectronics and IM2NP for the |13] for instance were the most important brokers. The last have evolved towards gatekeeper profiles, to the detriment of the in-between relations, and the emergence of a new cluster merging the previous ones. [06] has always been involved in non-local linkages, in addition to the in-between processes. This evolution can be grasped by the evolution of the ego-networks of these brokers, of the nature of the nodes they gather. Two interesting cases emblematic of the evolution of the CC are the main actors of [13], the dynamics of these networks are presented graphically in figure 5.
Figure 5. Brokers evolution
2008 IM2NP 2012 IM2NP
2008 ST 2012 ST
Source. SCS and own calculation
IM2NP and STMicroelectronics were clearly acting as coordinators in 2008, STMicroelectronics being the most important in terms of degree centrality. The cluster was oriented towards innovative industrial processes. The two brokers had important linkages, and were linked with Eurecom [06], the leading actor in research in 2008, and leading [06] partners of the telecom technologies. In 2012, IM2NP is the main broker of CC, closely linked with STMicroelectronics. They act as coordinators of the clusters, and even more as gatekeepers of knowledge though trans-local relationships. Their involvement in in-between linkages has drastically declined. A symmetric consideration would have been drawn for the analysis of the Eurecom [06] or Inria [06] ego-networks.
6. Dynamics of the clusters
The global dynamics of collective learning networks in CC highlight the decoupling of the two clusters overtime. The geographical proximity of the clusters is obviously not a sufficient condition to trigger in-between networks of collective learning. Other dimensions of proximity (Boschma, 2005) can work as obstacles to the emergence and viability of such networks. The paper uses the collective R&D projects labelled by SCS as a proxy to estimate the structure and dynamics of each cluster.
A first sign of decoupling is reflected by the nature of the projects led respectively by actors of the two clusters, as show in the following table.
Table 6. Share of the projects by dates and clusters 2008 ANR AUT CR FUI
[06] 0.435 0.194 0.056 0.315 [13] 0.29 0.13 0.17 0.41 2012 ANR AUT CR FUI [06] 0.346 0.211 0.035 0.408 [13] 0.46 0.16 0.01 0.37 Source. SCS and own calculation
The two clusters have followed opposite paths. [13] was relatively more involved in FUI projects, i.e. mainly industrial projects led by large firms. These projects remain important, but the share of the ANR has heavily increased. It has overtaken the corresponding share in [06], as well as the FUI share in [13]. The importance of the ANR projects, oriented towards basic research and linking research institutes and large and small firms reflects the significant changes in this last cluster, and the increasing role of the universities and institutes in the industrial context. In [06], the share of FUI has increased, but the position of leader regarding research the cluster has played in the first period has been lost. At least the involvement of the leading institutes in projects has decreased; they are however still pivotal because if their degree centrality has decreased significantly their betweenness centrality remains important. The institutes remain main brokers for within, in-between, and distant relations.
These evolutions should reflect the prevailing structures of the clusters, and the analysis of the collective learning networks implemented help to reveal these (a priori unknown) structures. The following graphs depict the evolution of the R&D networks overtime when the leaders of the projects are located in [06] (figure 5) or when they are located in [13] (figure 6). These figures provide a proxy of the evolution of the dominant structures of the local collective networks embedded in the two clusters through the dynamics of the interactions generated by the CC SCS, the relative implication and role of the large and small firms, of the research institutes, as well as of the local, near local and distant partners in the projects.
The figure 5 shows the evolution of the Nice Sophia Antipolis cluster, through the involvement in collective networks in the pole, or rather its lack of evolution. In “2008”, the partners standing as the main brokers are the leading public research institutes of Sophia Antipolis, Eurecom, Inria, I3S, and a large firm, but through its research department also located in Sophia Antipolis. In “2012”, the same arrangement prevails, but the network is less dense, the core less cohesive, the external involvement in local projects is remained significant. The table 7 shows that with the exception of Orange, in fact its R&D department, no local large firm is involved in the core to structure the local collective learning network with their research resources, only high tech SMEs enter – but also exit after a period – the set of involved partners. On the whole, the density of the network has decreased, the degrees of the periphery increased and the one of the core decreased, as if the dynamics of renewal of the knowledge bases highlighted in Crespo et al. (2013) has also decreased.
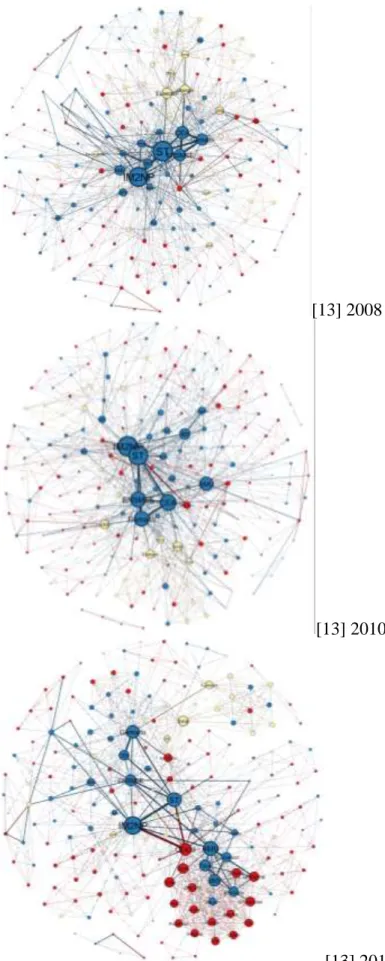
The dynamics depicted by the Rousset – Gémenos – Marseille figure 6 are clearly different. The figure 6 emphasizes the growth of a stable, cohesive core overtime gathering research
institutes, large and small firms, the steady growth of the degrees of the partners involved in the networks, as well as the increasing number of distant partners in the networks to the detriment of in-between ones, i.e. [06]. As the table 5 shows, these partners have disappeared from the most weighted ones in the last period.
The cohesive core of [13] gathers firms large and small, research institutes and universities, but the weight of the last ones has increased overtime, showing an increased content of basic research in the R&D projects, from industrial innovation towards knowledge creation and highly specialized development in microelectronics.
The same policy has thus been implemented very differently in the two clusters of the CC, and reveal highly different evolving structures. As already remarked, the evolution of the maximal cliques in [06] and [13] can allow to trace these evolutions. The proportion of large cliques is increasing significantly in [13], when it collapses in [06].
Figure 5: Evolution of the Sophia Antipolis Nice cluster
[06] 2008
[06] 2010
[06] 2012 Source: SCS and own calculation
Figure 6 Evolution of the Rousset-Gémenos-Marseille cluster
[13] 2008
[13] 2010
[13] 2012 Source: SCS and own calculation
Table 7. Decreasing weighted degrees
[06] R&D projects [13] R&D projects
Source. SCS and own calculation
Finally, the betweenness centrality of the actors of the areas have been mapped in figure 7 within a circle, ordered from the center (maximum betweenness) to decreasing circles of the index. It emphasizes the actors involved as brokers in the local learning network, whose number decreases (resp. increases) overtime in 06 (resp. 13). The dynamics of the two clusters are at odds, when the project was to merge them in a coherent industrial context to improve their innovative performance and address collectively the markets. The distinctive structures of the clusters revealed by the collective learning networks attached to the R&D projects under [06] or [13] leadership is certainly the main explanation. Organizational proximity stands as an obstacle towards merging.
A cohesive core has emerged in [13], balanced with an increasing involvement in trans-local learning networks. On the contrary, the [06] cluster has lost cohesiveness overtime, towards the formation of non-overlapping ego-networks related to its main brokers. As already emphasized, the organizational forms of the clusters appear somewhat different, a “core–and–periphery” versus a “hub–and–spoke” oriented organizational form. The core of the former is made of heterogeneous actors involved in the processes of knowledge creation and innovation, gathering large and small firms, universities and institutes of research. The prevailing structure of the cluster has sustained this evolution. The opposite certainly holds in |06], the actors share specific knowledge bases related to the technologies implemented locally rather than formal interactions. This structure is still prevailing, the CC policy dedicated to the increase of the density of interactions does not perfectly fits this organizational structure, which can be performing regarding knowledge creation.
Figure 7. Vertex betweenness centrality. From 2008 to 2012 Sophia Antipolis (06) 2008 2012 Rousset (13) 2008 2012
Source. SCS and own calculation
7. Conclusion
The Competitiveness Cluster policy is aimed to answer network failures in the processes of knowledge creation and innovation, and targets the emergence and strengthening of collective learning networks. The CC have worked as “factories of R&D projects”, producing detailed information through the collaborative R&D projects – networks of heterogeneous actors – competing for subsidies. This information can be considered as a proxy of the informal and
formal, local and trans-local relationships implemented by the large and small firms, the universities and research institutes in high tech clusters. The paper has allowed to characterize the organizational forms of the clusters from the emerging structure of the collective learning networks, and to trace their dynamics. The results are in line with the seminal work of Markusen (1996) and the works on proximity: regarding the case of SCS, different forms of clusters emerge in the same related technological fields, even in the same CC. The history of the clusters, the specificities of their emergence drive the dynamics of the R&D networks at work: knowledge spillovers are not “in the air” (Cassi, Plunket, 2013, Fitjar & Rodríguez-Pose, 2017) but very specific of the learning networks and clusters from which they belong. Diversity is a pervasive characteristic of the clusters. The diversity of the learning networks and even more their dynamics revealed in the paper questions the policy, built on the mode ‘one size fits all’ (Todtling & Trippl, 2005, Crespo et al., 2015). The policy has met the Rousset cluster, an industrial context rich of large and small firms relationships, allowing the deepening of the involvement of research institutes as well as of distant partners in the process of innovation. The policy has been less suited to Sophia Antipolis; the research institutes have played an important role in the emergence of collective networks and distant relations, sustaining the process of creation and renewal of knowledge bases. The large firms have on the contrary not been involved deeply in the CC, they are historically open and involved in distant knowledge networks, as the research institutes, but certainly more oriented towards international alliances. The resulting dynamics of the clusters within the CC has been on the period considered an increasing divide between the two clusters, a drastic reduction of the in-between linkages and an upsurge of distant (non-overlapping) ones in the collective learning networks.
References
Allen T. J., 1977, Managing the flows of technology: technology transfer and the dissemination of
technological information within the R&D organization. The MIT Press, Cambridge, Mass.
Audretsch, D. B., M. P. Feldman. 1996. “R&D Spillovers and the Geography of Innovation and Production.” The American Economic Review 86 (3): 630.
Balland P.A., Boschma R., Frenken K., 2015, Proximity and Innovation: From Statics to Dynamics,
Regional Studies, 49 (6): 907-920
Balland P.A., Brossard O., Vicente J., 2011, Getting into Networks and Clusters: Evidence from the Midi-Pyrenean Global Navigation Satellite Systems (GNSS) collaboration network, Regional Studies 45 (8), 1059-1078
Balland P.A., Suire R., Vicente J., 2013, Structural and Geographical Patterns of Knowledge Networks in Emerging Technological Standards: Evidence from the European GNSS Industry, Economics of
Innovation and New Technology, 22 (1): 47-72
Bathelt H., Malmberg A., Maskell P., 2004, Clusters and knowledge: local buzz, global pipelines and the process of knowledge creation, Progress in Human Geography, Volume 28 issue 1, 31-56 Bell, M.: Giuliani E., 2005. “The Micro-Determinants of Meso-Level Learning and Innovation:
Evidence from a Chilean Wine Cluster.” Research Policy 34 (1): 47–68. Borgatti S., 2006, Centrality and network flows, Social Networks, 27(1),55-71
Boschma R.A. 2005, Proximity and innovation: a critical assessment. Regional Studies 39: 61-74. Boschma, R.A., 2006, Does geographical proximity favour innovation? Economie et Institutions (6-7),
pp. 111-127.
Breschi S., Lissoni F., 2001. Knowledge Spillovers and Local Innovation Systems: A Critical Survey,
Industrial and Corporate Change 10 (4): 975–1005.
Breschi S., Lissoni F., 2009, Mobility of skilled workers and co-invention networks: an anatomy of localized knowledge flows, Journal of Economic Geography, 9, 439–468.
Broekel T., 2015, Do cooperative R&D subsidies stimulate regional innovation efficiency? Evidence from Germany. Regional Studies, 49(7):1087-1110
Broekel T., Boschma R.A., 2016, The cognitive and geographical structure of knowledge links and how they influence firms’ innovation performance, Regional Statistics, Vol 6, No 2. 2016: 3–26.
Broekel T., Mueller W., 2017, Critical links in knowledge networks – What about proximities and gatekeeper organizations? Papers in Evolutionary Economic Geography # 17.11 , 29 May.
Burt R. S., 1992, Structural Holes. The Social Structure of Competition, Cambridge (Mass.), Harvard University Press
Caloffi A., Mariani M., 2010, Designing policy support to innovation clusters. An overlapping network approach, the EUNIP Conference 2010, Faculty of Economics, Universitat Rovira i Virgili, Reus, 9-11 June 2010
Caloffi A., Rossi F., Russo M., 2012; What networks to support innovation, DRUID 2012, June 19 to June 21, Copenhagen, Denmark
Cassi L., Morrison A., Ter Wal A. L. J., 2012, The evolution of trade and scientific collaboration networks in the global wine sector: a longitudinal study using network analysis, Economic Geography, 88: 311–334.
Cassi L., Plunket A., 2013, Research Collaboration in Co-inventor Networks: Combining Closure, Bridging and Proximities, Regional Studies, 1-19
Cohen W., Levinthal D., 1990, Absorptive Capacity: A New Perspective on Learning and Innovation,
Administrative Science Quarterly 35:128–152.
Crespo J., Amblard F., Vicente J., 2015, Simulating micro behaviours and structural properties of knowledge networks: toward a “one size fits one” cluster policy, Papers in Evolutionary Economic
Crespo J., Suire R., Vicente J., 2013, Lock-in or lock-out? How structural properties of knowledge networks affect regional resilience, Journal of Economic Geography, forthcoming
Daviet S. 2000. Émergence et structuration d’une multinationale européenne du semiconducteur, le cas de STMicroelectronics.” Les Annales de Géographie 612:132–151.
Daviet S. 2001. Mondialisation et ancrage territorial chez STMicroelectronics, Rives méditerranéennes 9: 67–81. Accessed from http://rives.revues.org/index16.html.
Fitjar R.D., Rodríguez-Pose A., Nothing is in the air, 2017, Growth and Change, Vol.48, n°1, March, 22-39
Fleming L., Frenken K., 2006, Evolution of Inventor Networks in the Silicon Valley and Boston Regions, Papers in Evolutionary Economic Geography 06.09
Foray D., 2009, L’économie de la connaissance, Paris, La Découverte
Garnier J., Zimmermann J. B., 2004, L’Aire métropolitaine marseillaise et les territoires de l’industrie. Working Document no. 2004-35, GREQAM.
Garnsey E., Longhi C., 2004, High Technology Locations and Globalization: Converse Paths, Common Processes, International Journal of Technology Management 28 (3): 336–355.
Giuliani E., 2007, The selective nature of knowledge networks in clusters: evidence from the wine industry Journal of Economic Geography, 7, 139–168.
Giuliani, E. 2005. Cluster Absorptive Capacity: Why Some Clusters Forge Ahead and Others Lag Behind? European Urban and Regional Studies 12 (3): 269–288.
Giuliani, E. Pietrobelli C., 2011, Social Network Analysis Methodologies for the Evaluation of Cluster Development Programs, IDB Publications 3978, Inter-American Development Bank, Washington, DC.
Granovetter, M., 1973, The Strength of Weak Ties, American Journal of Sociology, 78 (6), 1360–1380 Hospers G-J, 2006, Silicon Somewhere?, Assessing the usefulness of best practices in regional policy,
Policy Studies, Vol. 27, Issue 1, 1-15.
Kiese M., 2006, Cluster Approaches to Local Economic Development Conceptual Remarks and Case Studies from Lower Saxony, Germany, in Clusters – Wonder Tool of Regional Policy? Blien U. and Maier, G. (eds.).
Lazaric N., Longhi C., Thomas C., 2008, Gatekeepers of Knowledge versus Platforms of Knowledge: From Potential to Realized Absorptive Capacity, Regional Studies 42 (6): 837–852.
Longhi C., 2016, Building high-tech clusters? The case of the competitiveness cluster "secure communicating solutions" in French Provence-Alpes-Côte d'Azur Region in Davide Parrilli, Rune Dahl Fitjar, Andres Rodriguez-Pose. Innovation Drivers and Regional Innovation Strategies, Routledge, pp.123-141.
Longhi, C. 1999. Networks, Collective Learning and Technology Development in Innovative High-Technology Regions: The Case of Sophia-Antipolis, Regional Studies 33 (4): 333–342.
Maggioni, M. A., Nosvelli, M., Uberti, T. E., 2007. Space versus networks in the geography of innovation: A European analysis. Papers in Regional Science, 86(3), 471–493.
Malmberg, A., Maskell, P., 2002, The elusive concept of localization economies: towards a knowledgebased theory of spatial clustering, Environment and Planning A 34 (3): 429-449.
Markusen A., 1996, Sticky Places in Slippery Spaces: A Typology of Industrial Districts, Economic
Geography 72 (3): 293–313.
Martin R., Sunley P., 2003, Deconstructing Clusters: Chaotic Concept or Policy Panacea? Journal of
Economic Geography 3 (1): 5–35.
Mendez, A. et al. 2008. Quelle articulation entre les pôles de compétitivité et les tissus productifs
régionaux? – Une mise en perspective de quatre pôles en Provence-Alpes-Côte d’Azur. Research
report commissioned by the PACA region.
Menzel M.P., Fornahl D., 2009, Cluster life cycles—dimensions and rationales of cluster evolution,