3
‐Mercaptopyruvate sulfurtransferase supports endothelial cell
angiogenesis and bioenergetics
Armita Abdollahi Govar
1|
Gábor Tör
ő
1|
Peter Szaniszlo
2|
Athanasia Pavlidou
3|
Sofia
‐Iris Bibli
4|
Ketan Thanki
5|
Vicente A. Resto
2|
Celia Chao
5|
Mark R. Hellmich
5|
Csaba Szabo
1,6|
Andreas Papapetropoulos
3,7|
Katalin Módis
1,51
Department of Anesthesiology, University of Texas Medical Branch, Galveston, Texas, USA
2
Department of Otolaryngology, University of Texas Medical Branch, Galveston, Texas, USA
3
Laboratory of Pharmacology, Faculty of Pharmacy, National and Kapodistrian University of Athens, Athens, Greece
4
Institute for Vascular Signalling, Centre for Molecular Medicine, Goethe University, Frankfurt, Germany
5
Department of Surgery, University of Texas Medical Branch, Galveston, Texas, USA
6
Chair of Pharmacology, Department of Science and Medicine, University of Fribourg, Fribourg, Switzerland
7
Clinical, Experimental Surgery and Translational Research Center, Biomedical Research Foundation of the Academy of Athens, Athens, Greece
Correspondence
Katalin Módis, University of Texas Medical Branch, 601 Harborside Dr., Bldg. 21, Galveston, TX 77555, USA. Email: kamodis@utmb.edu
Funding information
Foundation for the National Institutes of Health, Grant/Award Numbers:
R01CA175803 and T32 DK007639; Swiss National Foundation, Grant/Award Number: 31003A_179434; National Institutes of Health, Grant/Award Numbers: T32 DK007639 and R01CA175803; Bodossakis Foundation; American Heart Association, Grant/Award Number: 16SDG29860009
Background
and Purpose: During angiogenesis, quiescent endothelial cells (ECs) are
activated
by various stimuli to form new blood vessels from pre‐existing ones in
phys-iological
and pathological conditions. Many research groups have shown that
hydro-gen
sulfide (H
2S),
the newest member of the gasotransmitter family, acts as a
proangiogenic
factor. To date, very little is known about the regulatory role of 3‐
mercaptopyruvate
sulfurtransferase (3‐MST), an important H
2S
‐producing enzyme in
ECs.
The aim of our study was to explore the potential role of 3‐MST in human EC
bioenergetics,
metabolism, and angiogenesis.
Experimental
Approach: To assess in vitro angiogenic responses, we used EA.hy926
human
vascular ECs subjected to shRNA‐mediated 3‐MST attenuation and
pharmaco-logical
inhibition of proliferation, migration, and tube‐like network formation. To
eval-uate
bioenergetic parameters, cell respiration, glycolysis, glucose uptake, and
mitochondrial/glycolytic
ATP production were measured. Finally, global metabolomic
profiling
was performed to determine the level of 669 metabolic compounds.
Key
Results: 3‐MST‐attenuated ECs subjected to shRNA or pharmacological inhibition
of
3‐MST significantly reduced EC proliferation, migration, and tube‐like network formation.
3
‐MST silencing also suppressed VEGF‐induced EC migration. From bioenergetic and
met-abolic
standpoints, 3‐MST attenuation decreased mitochondrial respiration and
mitochon-drial
ATP production, increased glucose uptake, and perturbed the entire EC metabolome.
Conclusion
and Implications: 3‐MST regulates bioenergetics and morphological
angiogenic
functions in human ECs. The data presented in the current report support
the
view that 3‐MST pathway may be a potential candidate for therapeutic
modula-tion
of angiogenesis.
Abbreviations: 2‐DG, 2‐deoxy‐D‐glucose; 2‐NBDG, 2‐deoxy‐2‐[(7‐nitro‐2,1,3‐benzoxadiazol‐4‐yl)amino]‐D‐glucose; 3‐MP, 3‐mercaptopyruvate; 3‐MST, 3‐ mercaptopyruvate sulfurtransferase; CBS, cystathionineβ‐synthase; CSE, cystathionine γ‐lyase; DAO, D‐amino acid oxidase; EC, endothelial cell; FCCP, carbonyl cyanide 4‐(trifluoromethoxy) phenylhydrazone; I3MT‐3, 3‐MST inhibitor (2‐4‐hydroxy‐6‐methylpyrimidin‐2‐yl‐sulfanyl‐1‐naphthalen‐1‐yl‐ethan‐1‐one); OCR, oxygen consumption rate; PPP, pentose phosphate pathway; PPR, proton production rate; SQRL, sulfide : quinone oxidoreductase; TST, rhodanese
http://doc.rero.ch
Published in "British Journal of Pharmacology 177(4): 866–883, 2020"
which should be cited to refer to this work.
1
|I N T R O D U C T I O N
During angiogenesis, quiescent endothelial cells (ECs) are activated by various stimuli, which induce an angiogenic programme, allowing ECs to form new blood vessels from pre‐existing ones. This “angiogenic switch” (Eelen, Cruys, Welti, De Bock, & Carmeliet, 2013; Eelen, de Zeeuw, Simons, & Carmeliet, 2015; Wong, Marsch, Treps, Baes, & Carmeliet, 2017) can be induced by growth factors, such as VEGF, hyp-oxic conditions, or nutrient deprivation, as part of physiological or path-ological processes. For instance, wound healing and tissue remodelling are physiologically necessary angiogenic responses, whereas excessive angiogenesis contributes to the pathogenesis of cancer, inflammatory bowel disease, and diabetic retinopathy (Carmeliet, 2003).
Recent work has identified a“metabolic switch” that ECs undergo as part of the“angiogenic switch” (Eelen et al., 2013; Eelen et al., 2015; Wang et al., 2017). During homeostasis, glycolysis is the pre-dominant metabolic pathway utilized by ECs (De Bock, Georgiadou, Schoors, et al., 2013) complemented by fatty acid (Schoors et al., 2015) and amino acid metabolism (Teuwen, Geldhof, & Carmeliet, 2017; Unterluggauer et al., 2008). In ECs, more than 85% of total cel-lularATPcomes from glycolysis (De Bock, Georgiadou, Schoors, et al., 2013). Although the mitochondrial content of vascular ECs is relatively low—approximately 2–6% of the cytoplasm volume—compared to 32% in cardiomyocytes and 28% in hepatocytes (Jakovcic, Swift, Gross, & Rabinowitz, 1978; Tang, Luo, Chen, & Liu, 2014), EC mito-chondria have intact basal respiration and high bioenergetic reserve capacity (Dranka, Hill, & Darley‐Usmar, 2010; Modis et al., 2012). However, the relative contributions of glycolysis versus mitochondrial respiration to the high energy demands accompanying the“angiogenic switch” remain unclear.
Hydrogen sulfide (H2S) is recognized as a third gasotransmitter, along with carbon monoxide and nitric oxide, with multiple regulatory roles in the mammalian cardiovascular system (see Modis, Wolanska, & Vozdek, 2013; Wang, 2012; Wang et al., 2015). All three known H2S‐producing enzymes,cystathionineγ‐lyase(CSE; Papapetropoulos et al., 2009),cystathionineβ‐synthase(CBS; Saha et al., 2016), and 3‐ mercaptopyruvate sulfurtransferase (3‐MST), are found in ECs (Shibuya, Mikami, Kimura, Nagahara, & Kimura, 2009). While a number of studies have demonstrated biological functions of CSE and CBS in ECs (Kanagy, Szabo, & Papapetropoulos, 2017), less is known about the functional role of 3‐MST in these cells.
3‐MST is not only primarily localized to the mitochondria but also present to a lesser extent in the cytosol (Shibuya et al., 2009). A recent study also demonstrated its occurrence in the nucleus of human ECs (Bibli et al., 2018). 3‐Mercaptopyruvate (3‐MP) is the intracellular substrate of 3‐MST; from this substrate, the enzyme produces both H2S and hydrogen polysulfides (Kimura et al., 2015; Nagahara, 2018). Our laboratory recently demonstrated that 3‐MST plays an essential role in liver cell mitochondrial function and ATP production (Modis, Coletta, Erdelyi, Papapetropoulos, & Szabo, 2013). We also showed that the 3‐MST/H2S axis is impaired in ECs subjected to hyperglycaemia and established that 3‐MST activa-tion by 3‐MP stimulates murine EC proliferation, migration, and
vessel sprouting, suggesting a possible role of 3‐MST in angiogenesis (Coletta et al., 2015). However, the role of 3‐MST in EC metabolism and bioenergetics remains to be defined. Moreover, EC metabolism in the context of 3‐MST‐mediated morphological angiogenic responses and the involvement of 3‐MST in the “angiogenic/ metabolic switch” are still unknown.
Therefore, the aims of this study were to determine whether 3‐ MST regulates EC bioenergetics/metabolism and to assess its role in stimulating a pro‐angiogenic phenotype. We show that genetic attenuation and/or pharmacological inhibition of 3‐MST in human ECs substantially inhibits mitochondrial respiration and ATP turnover and alters the entire EC metabolome resulting in reduced angiogenic behaviour.
2
|M E T H O D S
2.1
|Cell culture
EA.hy926, a human vascular EC line, was purchased from ATCC (ATCC Cat# CRL‐2922, RRID:CVCL_3901; American Type Culture Collection, Manassas, VA) and maintained in DMEM containing 1 g·L−1of glucose supplemented with 10% FBS (Hyclone), 4 mmol·L−1of glutamine, 1% nonessential amino acids, 100 IU·ml−1of penicillin, and 100 mg·ml−1 of streptomycin at 37°C in a 5% CO2atmosphere. The EA.hy926 cell line has been derived by fusing human umbilical vein ECs with the permanent human cell line A549 (Edgell, McDonald, & Graham, 1983).
W h a t i s a l r e a d y k n o w n
• 3‐Mercaptopyruvate sulfurtransferase (3‐MST) stimulates liver cell mitochondrial function and ATP production. • 3‐MST activation supports murine endothelial cell (EC)
proliferation, migration, and vessel sprouting.
W h a t t h i s s t u d y a d d s
• It reveals the regulatory role of 3‐MST in the “angiogenic/metabolic switch” of ECs.
• It demonstrates a wider role of 3‐MST activity in EC metabolome beyond sulfur metabolism.
W h a t i s t h e c l i n i c a l s i g n i f i c a n c e
• Blocking 3‐MST, with pharmacological inhibitors, may serve as a potential future anti‐angiogenic therapeutic approach.
• Stimulating 3‐MST with pharmacological activators may serve as a therapeutic approach in wound healing.
The EA.hy926 is a presently available immortalized macrovascular EC line established in 1983. Throughout the experiments described here, the human EA.hy926 cells are referred to as ECs.
2.2
|shRNA
‐mediated stable silencing of 3‐MST
Stable lentiviral attenuation of 3‐MST was established in human EA. hy926 cells using two different shRNA insert sequences (Sigma Mis-sion clone ID TRCN0000036139, #1; TRCN0000036142, #2; Sigma‐ Aldrich, St. Louis, MO). As a control, an shRNA insert sequence (shNT) that did not target any known animal genes was used (Sigma Mission, SHC002V; Sigma‐Aldrich). Transduced cells were selected and main-tained in DMEM supplemented with puromycin (0.5μg·ml−1). Silenc-ing efficiency of 3‐MST was confirmed by Western blot analysis of the cell lysates.2.3
|Western blot analysis
Cells were lysed in Nonidet P‐40 buffer (50 mmol·L−1of Tris–HCl pH 8.0, 150 mmol·L−1of NaCl, 1% Nonidet P‐40) supplemented with protease and phosphate inhibitors, diluted in NuPAGE LDS Sample Buffer (Thermo Fisher Scientific, Waltham, MA), and boiled. Lysates (25 g of protein/10 μL per well) were resolved on 4–12% NuPage Bis‐Tris acrylamide gels (Thermo Fisher Scientific) and transferred to PVDF membranes. Membranes were blocked with Starting Block T20 (Thermo Fisher Scientific) and then were probed overnight with primary antibodies: anti‐3‐MST (Atlas Antibodies Cat# HPA001240, RRID:AB_1079408) and anti‐D‐amino acid oxidase (DAO; Atlas Anti-bodies Cat# HPA038653, RRID:AB_10673016) antiAnti-bodies (1:1000; Sigma‐Aldrich). Anti‐CSE (Proteintech Group Cat# 12217‐1‐AP, RRID:AB_2087497), CBS (Proteintech Group Cat# 14787–1‐AP, RRID:AB_2070970), rhodanese (TST; Proteintech Group Cat# 66018‐1‐Ig, RRID:AB_11045660), and sulfide : quinone oxidoreduc-tase (SQRL; Proteintech Group Cat# 17256‐1‐AP, RRID:AB_2195894) primary antibodies were also used (1:1000; Proteintech Group Inc., Chicago, IL). On the following day, anti‐rabbit and anti‐mouse horse-radish peroxidase‐conjugated secondary antibodies (Cell Signaling Technology Cat# 7074, RRID:AB_2099233; Sigma‐Aldrich Cat# A9044, RRID:AB_258431; 1:3000; Cell Signaling, Danvers, MA; Sigma‐Aldrich) were applied. Enhanced chemiluminescent substrate (Thermo Fisher Scientific; Sigma‐Aldrich) was used to detect the signal in a camera‐based chemiluminescence detection system (Alpha Innotech MultiImage II Alphaimager HP, ProteinSimple, San Jose, CA). To normalize signals, the membranes were re‐probed with β‐actin (Sigma‐Aldrich Cat# A2228, RRID:AB_476697) and GAPDH (Proteintech Group Cat# 60004–1‐Ig, RRID:AB_2107436) antibodies (1:3000; Sigma‐Aldrich or Proteintech Group Inc.). The intensity of Western blot signals was quantified by densitometry using the ImageJ 1.45s software (ImageJ, RRID:SCR_003070; U.S. National Institutes of Health, Bethesda, MD). The ratios of the signals were expressed as normalized densitometry units.
2.4
|Cell proliferation assay
For real‐time assessment of cell proliferation, the xCELLigence system (ACEA Biosciences, Inc., San Diego, CA) was used as described previ-ously (Szabo et al., 2013). This system noninvasively monitors cellular proliferation by measuring the relative change in the electrical impedance of the cell monolayer. Briefly, 2 × 10³ cells per well of wild‐type, shNT, sh3‐MST #1, or #2 EA.hy926 ECs were plated in 96‐well E‐Plates. The instrument measures electrical impedance and monitors cell proliferation in a real‐time setting. Twenty‐four hours after plating the cells, I3MT‐3 or 3‐MP was added to the cells, and the measurement was continued in real time for an additional 48–72 hr. The instrument calculated measurements in cell index, a unitless parameter that was normalized to the 24‐hr time point.
2.5
|Boyden chamber cell migration assay
The Boyden chamber cell migration assay was used as previously described (Phillips et al., 2017; Szabo et al., 2013). Briefly, 105 EA. hy926 cells resuspended in 0.1% FBS containing DMEM were seeded onto the top chamber inserts with 8‐μm pores (Corning, NY). The bot-tom chamber contained 600μL of 5% FBS containing DMEM in the presence or absence of 3‐MP or VEGF165 (10–30 ng·ml−1). The 3‐ MST inhibitor, I3MT‐3 was added to both the bottom and top cham-bers. Cells were incubated at 37°C for 5 hr to allow migration. After incubation, the migrated cells in the bottom chamber were fixed with methanol and then stained with 0.5% crystal violet. The migrated cell population was dissolved in DMSO and was measured at 570/690 nm of absorbance.
2.6
|In vitro tube
‐like network formation
EA.hy926 cells were serum starved for 6 hr in 1% BSA‐containing DMEM supplemented with 1 g·L−1of glucose, then plated (6 × 10⁴ cells per well) onto a Matrigel basement with reduced growth factors for 15 hr (during which time cells developed tube‐like structures). Quantification was performed by measuring the number of tubes, tube length, and determining the tube area (ImageJ 1.45s software, National Institutes of Health). In a separate experiment, we also used the 3‐MST inhibitor, I3MT‐3 both at the starvation and the tube for-mation periods. In these experiments, we pretreated the cells with the inhibitor at different concentrations during the starvation period for an hour and also when the cells were seeded onto the Matrigel basement.
2.7
|Bioenergetic analysis in intact cells
The XF24 Extracellular Flux Analyzer (Agilent, Santa Clara, CA) was used to measure bioenergetic function in intact EA.hy926 cells as described previously (Modis et al., 2012; Modis, Coletta, et al., 2013). The XF24 Extracellular Flux Analyzer records the changes in oxygen and proton concentrations in real time by utilizing specific
fluorescent dyes. Prior to the bioenergetic measurements, the culture medium was changed to unbuffered DMEM containing media‐lacking serum. In preliminary studies, we determined that 4.5 × 10⁴EA.hy926 cells were needed as the optimum number of cells per well to allow detection of changes in oxygen consumption rate and proton produc-tion rate (PPR) values for subsequent experiments. Next, a protocol was implemented to measure indices of mitochondrial function. Oligomycin, carbonyl cyanide 4‐(trifluoromethoxy) phenylhydrazone (FCCP),2‐deoxy‐D‐glucose(2‐DG), and antimycin A/rotenone (AA + Rot) were injected sequentially through ports of the Seahorse Flux Pak cartridges to reach 1.5μM, 0.5 μM, 2 μg·ml−1, and 2μM respec-tively. Key bioenergetic parameters such as basal respiration (resting cell respiration), ATP production (calculated from the drop in oxygen consumption rate, in response to the ATP‐synthase inhibitor, oligomycin), proton leak (migrated protons to the matrix without pro-ducing ATP, basal/inducible proton leak), maximal respiratory capacity (maximal oxygen consumption achievable by using the uncoupling agent FCCP), spare respiratory capacity (accessible mitochondrial reserve capacity under high bioenergetic demands), and the so‐called maximal respiration in glycolytic blockade (maximal oxygen consump-tion achievable in uncoupled mitochondria state during complete glyco-lytic blockade) after the addition of 2‐DG were measured. Glycolysis (measured PPR after the addition of saturating amounts of glucose), maximal glycolytic capacity (maximum PPR rate after blocking the oxi-dative phosphorylation by adding oligomycin), glycolytic reserve capac-ity (calculated parameter of subtracting glycolysis from maximal glycolytic capacity; how much the cells can use reserve glycolytic function under high energy demand), and non‐glycolytic acidification rate (extracellular acidification that is not attributed to glycolysis) were assessed by sequential administration of glucose (10 mM), oligomycin (1.5μM), and 2‐DG (100 mM) respectively (Szabo et al., 2013). All measurements were normalized to protein content, determined in each individual well.
2.8
|Measurement of mitochondrial ATP levels
ATP concentration was determined by the commercially available CellTiter‐Glo luminescent cell viability assay (Promega, Madison, WI), as described previously (Modis et al., 2009). First, EA.hy926 cells (wild‐type, shNT, sh3‐MST #1, or sh3‐MST #2) were grown in normal, low‐glucose (5.5 mM) DMEM. The media were then replaced with high glucose (10 mM) or high galactose (10 mM) complete (10% FBS) DMEM for overnight (16 hr) incubation to shift the metabolic profile to an increased glycolytic or mitochondria‐dependent pheno-type. Then, oligomycin (1.5μM), 2‐DG (100 mM), or both were added, and the ATP‐synthesizing reaction was terminated after 8 hr. Wild‐ type cells were also tested after 2 hr of I3MT‐3 treatment at different concentrations (3, 10, 30, and 100 μM). Luminescent signal was recorded for 1 s using a SpectraMax M2 multimode reader (Molecular Devices Corp., San Jose, CA). Serial dilutions of ATP were used as cal-ibration standards, and the ATP content was calculated for each well and normalized to cell number determined by DNA content usingHoechst 33342 staining (excitation/emission: 360/460 nm), recorded on Synergy 2 (BioTek, Winooski, VT).
2.9
|2
‐NBDG glucose analogue uptake
Approximately 5 × 10³EA.hy926 cells per well (wild‐type, shNT, sh3‐ MST #1, or sh3‐MST #2) were plated into 96‐well black plates and cultured for 3 days. The cells were then washed once with PBS and phenol red‐free DMEM supplemented with 2% FBS, 2‐mM glutamine, 1% non‐essential amino acids were added to all wells. The fluorescent glucose analogue, 2‐NBDG (100‐μM), was added to each group and incubated for 1 hr at 37°C in a 10% CO2atmosphere. Wild‐type cells were also tested after 2 hr of I3MT‐3 treatment at different concen-trations (3, 10, 30, and 100μM). Cells treated with 1% DMSO vehicle without adding 2‐NBDG were included as negative controls. The fluo-rescence of 2‐NBDG (excitation/emission: 475/550 nm) recorded for each well and normalized for cell number determined by DNA content using Hoechst 33342 staining (excitation/emission: 360/460 nm), recorded on Synergy 2 (BioTek).
2.10
|Metabolomic profiling
Global metabolomic profiling was performed by Metabolon, Inc. (Morrisville, NC), as previously described (Chaudhri et al., 2013). Briefly, shNT EA.hy926 or sh3‐MST #2 cells were treated with vehicle, 3‐MP (300μM), or I3MT‐3 (3‐MST inhibitor, 100 μM) resulting in six treat-ment groups (Table 1). After 24 hr, cells were washed with ice‐cold PBS twice, trypsinized and snap frozen in liquid nitrogen. Five samples were collected from each group on five different experimental days. The samples were extracted and prepared by Metabolon's standard sol-vent extraction method. Technical replicates (n = 5) were normalized by protein content (Bradford assay). The resulting extract was divided into five fractions: two for analysis by two separate reverse phase/ultra‐ performance LC‐MS/MS (UPLC‐MS/MS) methods with positive ion mode electrospray ionization (ESI), one for analysis by reverse phase/UPLC‐MS/MS with negative ion mode ESI, one for analysis by hydrophilic interaction chromatography/UPLC‐MS/MS with negative ion mode ESI, and one sample was reserved for backup. The concentra-tions of 669 compounds of known identity (named biochemicals) were measured in each sample, and following normalization to Bradford pro-tein concentration, log transformation, and imputation of missing values, if any, with the minimum observed value for each compound, ANOVA contrasts were used to identify biochemicals that differed sig-nificantly between experimental groups. Analysis by two‐way ANOVA
TABLE 1 Treatment groups for metabolomic profiling
Cell line Group name Treatment Vehicle I3MT‐3 (100μM) 3‐MP (300μM) EA.hy926 shNT n = 5 n = 5 n = 5 sh3‐MST #2 n = 5 n = 5 n = 5
http://doc.rero.ch
identified biochemicals exhibiting significant interaction and main effects for experimental parameters of group and treatment. Named biochemicals that achieved statistical significance at P ≤ 0.05 in pairwise comparisons were determined. Pathway visualization and pathway set enrichment analysis were performed using MetaboLync online software (Metabolon).
2.11
|Data and statistical analysis
The data and statistical analysis comply with the recommendations of the British Journal of Pharmacology on experimental design and analysis in pharmacology. (Curtis et al., 2018). Data are shown as mean ± SEM. Statistical analyses included Student's t‐test, one‐way, or two‐way ANOVA followed by Dunnett's multiple comparisons to detect differences between groups. Statistical analysis was performed using GraphPad Prism 7 analysis software (GraphPad Prism, RRID:SCR_002798; GraphPad Software Inc., La Jolla, CA). The experiments were repeated independently at least five times and per-formed at least on five different experimental days, with at least three replicates per each assay group or condition. A value of P≤ 0.05 was considered statistically significant. In the Figures, “ns” indicates non‐significant differences between two groups where needed for emphasis.
2.12
|Materials
ATP sodium salt, antimycin A, FCCP, 2‐DG, 3‐MP, oligomycin, and rotenone were obtained from Sigma‐Aldrich. For basic cell culture, DMEM, L‐glutamine, nonessential amino acids, penicillin, and streptomycin were obtained from Sigma‐Aldrich, and Hyclone FBS was obtained from GE Healthcare Life Sciences (Pittsburgh, PA). The 3‐MST inhibitor, I3MT‐3, was purchased from Specs (Narragansett, RI). Pierce bicinchoninic acid protein assay kit was purchased from ThermoFisher Scientific. CellTiter‐Glo luminescent ATP kit was obtained from Promega. Animal‐free recombinant human VEGF165 was procured from PeproTech (Rocky Hill, CT). 2‐NBDG was obtained from Cayman Chemical (Ann Arbor, MI). Anti‐3‐MST, CSE, CBS, TST, SQRL, and DAO antibodies for Western blotting were obtained from Proteintech Group, Inc., and Sigma‐Aldrich.
2.13
|Nomenclature of targets and ligands
Key protein targets and ligands in this article are hyperlinked to corresponding entries in http://www.guidetopharmacology.org, the common portal for data from the IUPHAR/BPS Guide to PHARMA-COLOGY (Harding et al., 2018), and are permanently archived in the Concise Guide to PHARMACOLOGY 2017/18 (Alexander et al., 2017).
3
|R E S U L T S
3.1
|Characterization of stable lentiviral attenuation
of 3
‐MST in ECs
Two EA.hy926 cell lines with stable lentiviral attenuation of 3‐MST were established: sh3‐MST #1 and sh3‐MST #2. Silencing efficiency was confirmed by Western blot analysis of 3‐MST protein levels (Figure 1a). The sh3‐MST #1 cell line showed 72% reduction in 3‐ MST expression, and sh3‐MST #2 cell line showed 56% reduction in 3‐MST expression. Both cell lines maintained stable 3‐MST atten-uation throughout serial subcultures. As a negative control, a non‐ targeting shRNA sequence (shNT) was used, which had no effect on 3‐MST expression level. Wild‐type EA.hy926 cells never sub-jected to lentiviral transduction were also used as an additional con-trol group.
Expression levels of other H2S‐producing enzymes, CSE or CBS, or enzymes that are involved in H2S degradation, TST and SQRL, were not altered in shNT or sh3‐MST cells (Figure 1b). DAO, the enzyme responsible for producing 3‐MP from D‐cysteine, was also unchanged.
3.2
|3
‐MST attenuation or inhibition reduces EC
proliferation
To determine how changes in 3‐MST activity affect EC proliferation, real‐time, electrical impedance‐based proliferation assays were con-ducted. The cellular proliferation rate over 72 hr was markedly decreased in cell lines with reduced 3‐MST expression (Figure 1c). The magnitude of the growth inhibition was proportional to the level of shRNA‐mediated 3‐MST protein reduction. The sh3‐MST #1 cell line had a lower normalized cell index compared to sh3‐MST #2, con-sistent with the reduced 3‐MST protein expression in sh3‐MST #1 than sh3‐MST #2 cells. Wild‐type and shNT cell proliferation rates were virtually identical, indicating that lentiviral transduction by itself had no effect on cell proliferation.
To investigate the effects of 3‐MST substrate on EC proliferation, wild‐type ECs were incubated with various concentrations of 3‐MP (10, 30, 100, 300, 1,000, and 3,000μM; Figure 1d). At 36 hr, 1,000‐ or 3,000‐μM 3‐MP exerted a stimulatory effect on EC proliferation. At 51 hr, 3‐MP at ≥30 μM of concentration increased EC proliferation in a dose‐dependent fashion. Interestingly, at later time points, 3,000‐μM 3‐MP inhibited EC proliferation.
In another set of experiments, I3MT‐3, the pharmacological inhibitor of 3‐MST, at 10, 30, and 100 μM of concentrations, was added to the wild‐type ECs 24 hr after the cells were seeded (Figure 1e). I3MT‐3 at 100‐μM concentration exerted a significant inhibitory effect on EC proliferation at 50 hr of incubation, while 30‐μM I3MT‐3 inhibited proliferation only after 60 hr; 10‐μM I3MT‐ 3 did not alter the proliferation rate. These data show that I3MT‐3 exerts a dose‐dependent inhibitory effect on EC proliferation.
3.3
|3
‐MST attenuation inhibits basal and
VEGF
‐stimulated EC migration
To investigate the role of the 3‐MST system in EC migration, we used a 3D transwell migration assay that allows the ECs to respond to var-ious stimuli directionally. Compared with wild‐type or shNT control cells, sh3‐MST cells exhibited significantly reduced basal migration ability (Figure 2a). Similarly, blocking 3‐MST activity in shNT ECs with the inhibitor I3MT‐3 significantly reduced basal migration ability (Figure 2b). However, sh3‐MST ECs treated with I3MT‐3 did not show
a substantial reduction in migration compared to vehicle, indicating that sh3‐MST ECs have less functional 3‐MST protein present com-pared to shNT ECs.
Incubation with 300 or 1,000μM of 3‐MP facilitated transwell migration of wild‐type and shNT cells, but not sh3‐MST cells (Figure 2c). Interestingly, addition of 3‐MP at 3,000 μM stimulated migration in all cell types, including sh3‐MST ECs, suggesting a possi-ble enzyme‐independent action of the substrate.
Lastly, the role of 3‐MST in VEGF‐mediated migration was assessed by adding 10 or 30 ng·ml−1of VEGF to the bottom wells of FIGURE 1 3‐MST attenuation suppresses EC proliferation, whereas the substrate of 3‐MST exerts a stimulatory effect. (a) Representative Western blot image of wild‐type, shNT, sh3‐MST #1, and sh3‐MST #2 EC lysates collected on three different experimental days.
Expression of 3‐MST, CSE, CBS, TST, SQRL, and DAO protein is shown in the representative Western blot image. (b) Western blot densitometric analyses of n = 9 experiments were performed for 3‐MST, CSE, and CBS and n = 6 experiments for TST, SQRL, and DAO proteins in wild‐type, shNT, sh3‐MST #1, and sh3‐MST #2 EC lysates. Band densities for shNT ECs were set to 100% in each experiment, and the densities in the three other EC lines were calculated relative to shNT ECs. Note that sh3‐MST #1 EC line showed 72%, and sh3‐MST #2 EC line represented 56% decrease in 3‐MST protein expression. The expression levels of other enzymes showed no alterations confirming the successful establishment of an EC‐based model with selective modulation of 3‐MST expression. (c) 3‐MST silencing significantly suppressed EC proliferation compared with wild‐type and shNT groups expressed as cell index. (d) 3‐MP, the substrate of 3‐MST, showed dose‐dependent stimulation in wild‐type EC proliferation. (e) The pharmacological inhibitor I3MT‐3 (30 or 100 μM) dose‐
dependently inhibited wild‐type EC proliferation. Data in (b) are shown as mean ± SEM of six or nine independent experiments (n = 6 or 9). Data in (c–e) are shown as mean ± SEM of six independent experiments (n = 6). *P ≤ 0.05, significantly different from shNT or wild‐ type group; #P≤ 0.05, significantly different from wild‐type group; one‐way and two‐way ANOVA followed by Dunnett's post hoc test.
the transwell assays. ShNT cell migration was stimulated by both con-centrations of VEGF, whereas the effects of VEGF were attenuated in sh3‐MST ECs (Figure 2d).
3.4
|3
‐MST silencing and inhibition prevent EC
tube
‐like network formation
The tube‐like network formation assay provides a functionally rele-vant in vitro assessment of EC proliferation, migration, and sprouting responses, EC characteristics that are required for in vivo angiogene-sis. In this set of experiments, wild‐type, shNT, sh3‐MST #1, and sh3‐MST #2 ECs were used to assess the role of 3‐MST in the development of angiogenic phenotype. EC tube‐like network forma-tion was quantified by measuring the number of tubes, tube length, and the total tube area. 3‐MST‐silenced ECs formed less tube‐like net-works than either wild‐type or shNT control cells (Figure 3a,c). The effect of 3‐MST silencing was mimicked by I3MT‐3, the selective 3‐ MST inhibitor in wild‐type ECs in a dose‐dependent fashion (Figure 3b,d).
3.5
|3
‐MST regulates the EC metabolome
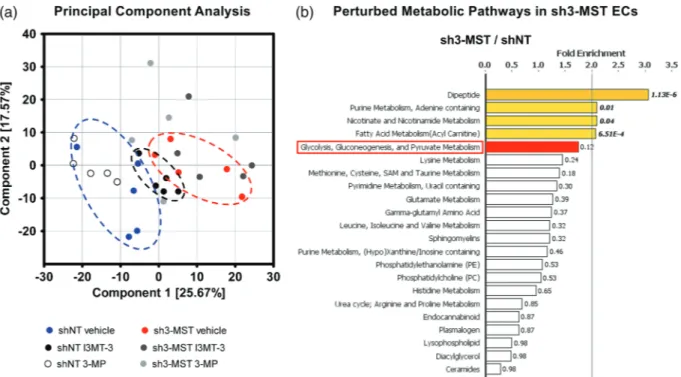
To investigate the effects of modulating 3‐MST expression or activity on EC metabolism, we performed a global metabolomic analy-sis on 3‐MST knockdown ECs, cells treated with the pharmacological 3‐MST inhibitor I3MT‐3 and the 3‐MST substrate, 3‐MP (Section 2; Table 1). We carried out principal component analysis to describe overall similarities and differences between samples (Figure 4a). In this study, principal component analysis of ECs showed separation primarily related to the knockdown of 3‐MST. Furthermore, shNT and sh3‐MST groups segregated along I3MT‐3 and 3‐MP treat-ments. Importantly, the effects of I3MT‐3 treatment partly over-lapped with 3‐MST knockdown, suggesting that pharmacological inhibition of 3‐MST by I3MT‐3 induced metabolic effects similar to those following shRNA‐mediated 3‐MST silencing.
The metabolomic analysis allowed us to compare the effect of reduced 3‐MST activity on many metabolic pathways simultaneously (Figure 4b). The effects of 3‐MST silencing and I3MT‐3 treatment of shNT cells on key metabolomic analytes are shown in Supporting Information Table S1. When we compared the pathway activities of FIGURE 2 3‐MST activity is required for basal and VEGF‐stimulated EC migration. (a) Transwell migration assay was used to assess the basal migration capacity of wild‐type, shNT, and sh3‐MST #2 ECs across chamber inserts. ShRNA‐mediated 3‐MST #2 silencing significantly decreased EC basal migration ability. (b) The addition of I3MT‐3 (100 μM) significantly inhibited the migration of shNT, but not sh3‐MST #2 ECs. Migration of shNT or sh3‐MST #2 vehicle‐treated ECs was set to 100%, and the other migration measurements were normalized to shNT or sh3‐ MST #2 values. (c) 3‐MP, at low concentrations, facilitated migration of wild‐type and shNT ECs only. Migration values for wild‐type ECs in the absence of 3‐MP were set to 100%, and all other measurements were normalized to this control value. (d) VEGF‐stimulated EC migration, shNT cell migration was stimulated by both concentrations of VEGF, whereas only 30 ng·ml−1of VEGF induced a moderate migration increase in sh3‐ MST ECs compared to vehicle, with less of an overall increase compared with that observed in shNT ECs. Data are shown as mean ± SEM of five independent experiments (n = 5); *P≤ 0.05, significantly different from shNT or wild‐type group; #P ≤ 0.05, significantly different from sh3‐MST #2 group: one‐way ANOVA followed by Dunnett's post hoc test or Student's unpaired t‐test.
shNT and sh3‐MST cell lines based on fold enrichment, we found that several metabolic pathways were profoundly perturbed including dipeptide, purine, nicotinamide, fatty acid, and glucose metabolism. Interestingly, sulfur metabolism ranked seventh on this list (Figure 4b). In addition, many sub‐pathways of lipid, amino acid, and nucleotide metabolism were also altered.
In the transsulfuration pathway, as a result of 3‐MST attenuation, the basal levels of methionine, homocysteine, and cystathionine were increased in sh3‐MST ECs (Figure 5a–d). Surprisingly, cysteine levels were not significantly different between shNT and sh3‐MST ECs, although there was a trend towards increased cysteine in sh3‐MST ECs (Figure 5e). However, the production of taurine, an important end product of the methionine‐cysteine pathway, was significantly elevated in sh3‐MST ECs compared with shNT ECs (Figure 5f). I3MT‐3 treatment partly reproduced the effects of 3‐MST silencing.
Treatment with 3‐MP, for the most part, resulted in trends opposite to those after I3MT‐3 treatment.
Glycolysis is generally considered to be the main energy‐ producing pathway in EC metabolism (De Bock, Georgiadou, Schoors, et al., 2013). Therefore, alterations in the glycolytic pathway caused by reduced 3‐MST activity were examined in detail (Figure 6a). A number of glycolytic intermediates showed significant increases in sh3‐MST ECs compared with shNT ECs, including fructose 1,6‐bisphosphate, dihydroxyacetone phosphate, and 3‐phosphoglycerate (Figure 6b–d). The levels of lactate were also trending higher, which points towards increased glycolytic activity in cells lacking 3‐MST (Figure 6e). The changes in glycolysis were accompanied by increases in the oxidative branch of pentose phosphate pathway (PPP) intermediates, 6‐ phosphogluconate, and sedoheptulose‐7‐phosphate in sh3‐MST ECs (Figure 6f,g). However, in the non‐oxidative phase of the PPP, which FIGURE 3 3‐MST attenuation abrogates tube‐like network formation. (a) Representative images of tube networks of wild‐type, shNT, sh3‐MST #1, and sh3‐MST #2 EC lines. (b) Representative images of tube networks of wild‐type ECs treated with different concentrations (3, 10, 30, and 100μM) of I3MT‐3. (c,d) Tube formations were quantified by counting tube numbers, length (Pixel), and area (Pixel2) per high power field (100× and 200× magnification). Data are shown as mean ± SEM of five independent experiments (n = 5); *P≤ 0.05 significantly different from shNT or wild‐type group; one‐way ANOVA followed by Dunnett's post hoc test.
is responsible for synthesis of nucleotides, the ribose 1‐phosphate metabolite showed reduction in sh3‐MST ECs, suggesting that nucleotide synthesis was impaired (Supporting Information Table S1). The addition of I3MT‐3 reproduced the effects of 3‐MST silencing in ECs, whereas 3‐MP had opposite effects on carbohy-drate metabolism.
3.6
|3
‐MST attenuation reduces EC oxidative
phosphorylation and mitochondrial ATP production
To further investigate 3‐MST‐regulated energy production in ECs, mitochondrial respiration in intact ECs was evaluated via the Seahorse XF24 Extracellular Flux Analyzer. The following parameters were eval-uated: basal respiration, ATP production, maximal respiration, and maximal respiration in glycolytic blockade. All recorded parameters were significantly decreased in sh3MST #1 and #2 ECs compared to shNT or wild‐type ECs (Figure 7a,b). Similarly, the spare respiratory capacity, a calculated parameter in which the basal respiration value is subtracted from the maximal respiration capacity, was also reducedin sh3‐MST #2 versus shNT ECs and showed a trend towards being decreased in sh3‐MST #1 ECs without reaching the level of significance.
Next, we determined whether the 3‐MST substrate, 3‐MP, could stimulate mitochondrial respiration in shNT ECs and whether these responses were absent from sh3‐MST ECs. In shNT ECs, 3‐MP stimu-lated basal respiration, ATP production, maximal respiration in glyco-lytic blockade, and spare respiratory capacity (Figure 7c), whereas it did not exert any significant effect in sh3‐MST ECs.
Finally, to extend this bioenergetic analysis, cells were maintained in cell culture media containing high glucose (10 mM) or high galactose (10 mM), and glycolytic and mitochondrial ATP production was measured (Figure 7d). In this assay, 2‐DG was used to competitively inhibit glycolysis and oligomycin to block mitochondrial ATP‐synthase. Sh3‐MST #1 ECs produced less glycolytic ATP compared with shNT ECs. Addition of 2‐DG inhibited glycolytic ATP production in all cell lines. Both sh3‐MST cell lines showed significantly reduced mitochon-drial ATP production. All cells cultured in galactose responded well to oligomycin, suggesting that their metabolism almost completely shifted to oxidative phosphorylation.
FIGURE 4 3‐MST down‐regulation alters EC metabolism. Global metabolomic profiling was performed on shNT and sh3‐MST #2 ECs with three treatment groups each—vehicle, I3MT‐3 (100 μM), and 3‐MP (300 μM)—to determine the concentration of 669 metabolic compounds in each sample. (a) Principal component analysis (PCA) showed primary separation of samples related to 3‐MST silencing from shNT samples, and lesser extent samples related to 3‐MST inhibition. PCA analysis also indicates that (a) primarily, the enzymic activity of 3‐MST regulates the EC metabolome and (b) 3‐MST pharmacological inhibition partly reproduces the overall metabolic effects of 3‐MST silencing. (b) 3‐MST silencing induced alterations (increased or reduced number of metabolites) in many pathways. The five metabolic pathways most affected by 3‐MST silencing were shown to be dipeptide, purine, nicotinamide, fatty acid, and glucose metabolism. Sulfur metabolism ranked seventh on this list. Several sub‐pathways of lipid, amino acid, and nucleotide metabolism were also seen. Fold enrichment (FE) values were calculated by the following equation using MetaboLync online software: FE = (# of significant metabolites in pathway [k] /total # of detected metabolites in pathway[m] / (total # of significant metabolites[n] /total # of detected metabolites [N]); in short: FE = (k/m)/(n/N). A pathway FE value >1 indicated that the pathway contained more experimentally regulated compounds relative to the overall study, suggesting that the pathway may be a target of interest of the experimental perturbation. P values displayed next to each FE bar were calculated using a two‐way ANOVA. FE bars representing the most perturbed pathways are shaded yellow (FE > 2) or red (1.5 < FE < 2). Only major pathways with over 10 metabolites were displayed. All six groups consisted of data of five independent experiments (n = 5).
3.7
|Pharmacological inhibition of 3
‐MST decreases
EC oxidative phosphorylation and mitochondrial ATP
production
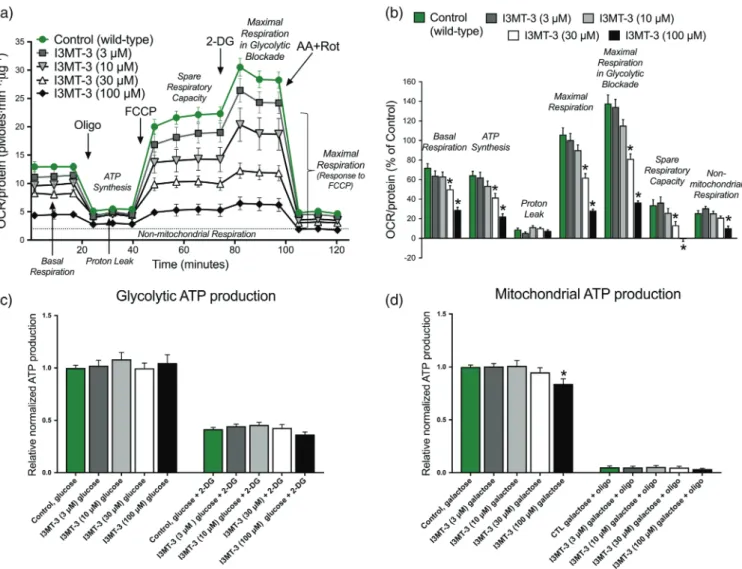
The methods described above were applied to ECs treated with I3MT‐3 to determine how the effects of shRNA‐mediated 3‐MST silencing on EC bioenergetics compare with those of pharmacologi-cal inhibition of 3‐MST. Treatment of wild‐type ECs with I3MT‐3 (30 or 100 μM) significantly reduced key bioenergetic parameters, such as basal respiration, ATP production, maximal respiration with and without the glycolytic blockade, and reserve respiratory capacity (Figure 8a,b). This suppression was more prominent with I3MT‐3‐treated ECs than observed in earlier experiments with sh3‐ MST ECs. Next, glycolytic and mitochondrial ATP production
was measured in ECs treated with a range of I3MT‐3 doses (Figure 8c,d). Consistent with results in sh3‐MST ECs, I3MT‐3 (100μM) significantly reduced mitochondrial ATP production after maintaining the cells in galactose‐containing complete (10% FBS) media for 10 hr. Glycolytic ATP production did not change in response to I3MT‐3 treatment. Similar to the results in sh3‐MST ECs, the I3MT‐3 treatment resulted in lower mitochondrial respira-tion, as well as lower mitochondrial ATP production without affect-ing the glycolytic ATP production.
3.8
|Changes in glycolytic PPR and glucose uptake
The metabolomic analysis of glycolysis revealed profound alterations in 3‐MST‐attenuated ECs. However, we only measured a borderline FIGURE 5 Altered 3‐MST activity perturbs sulfur metabolism in ECs. Global metabolomic profiling was performed on six groups as described in Figure 4 to determine the concentration of 669 metabolic compounds in each sample. (a) Schematic diagram of sulfur metabolism. Metabolites with significantly increased concentration after 3‐MST silencing and pathways with potential up‐regulation are shaded pink, while potentially down‐regulated pathways are shaded yellow. (b–f) Box plots of selected key metabolites in sulfur metabolism. Values for each sample are normalized by Bradford protein concentration, followed by median scaling and imputation. *P≤ 0.05, shNT samples were compared to shNT control; and sh3‐MST samples were compared to their corresponding shNT treatment group; Student's unpaired t‐test. All six groups consisted of data of five independent experiments (n = 5).decrease in glycolytic ATP production in sh3‐MST #1 ECs, and no change in ECs subjected to I3MT‐3, as indicated above. Therefore, to further evaluate glycolytic changes, the PPR was measured via Seahorse Extracellular Flux Analyzer. Moreover, glucose uptake was also evaluated using a fluorescent glucose analogue, 2‐NBDG. Only a slight suppression of some glycolytic parameters was detected in sh3‐MST #1 ECs (Figure 9a,b). Additionally, ECs treated with 100μM of I3MT‐3 showed a significant suppression in all glycolytic parameters (Figure 9c,d).
Glucose uptake is an additional parameter for glycolytic flux and glucose catabolism. Interestingly, 2‐NBDG uptake was significantly elevated in both sh3‐MST cell lines (Figure 9e). Consistent with this result, ECs treated with I3MT‐3 showed increased glucose uptake in a dose‐dependent fashion (Figure 9f). We concluded that 3‐MST silencing and low concentrations of I3MT‐3 had a minor effect on glycolysis. Meanwhile, 100 μM of I3MT‐3 sup-pressed all glycolytic parameters. Both sh3‐MST ECs and ECs treated with I3MT‐3 consistently exhibited higher glucose uptake.
4
|D I S C U S S I O N
The novelty of the present study relates to three observations. First, 3‐MST attenuation inhibited EC tube‐like network formation, a mor-phological angiogenic response involving EC proliferation, migration, and sprouting abilities. Second, 3‐MST silencing significantly sup-pressed VEGF‐induced EC migration. Third, from bioenergetic and metabolic standpoints, 3‐MST attenuation reduced mitochondrial res-piration and mitochondrial ATP production and perturbed several pathways in the EC metabolome, without substantially altering glycol-ysis. This latter finding intriguingly suggests that despite the reliance of ECs on glycolysis (De Bock, Georgiadou, & Carmeliet, 2013; Schoors et al., 2014), 3‐MST supports mitochondrial activity by increasing EC basal and reserve capacity. These results suggest that 3‐MST may act as an important regulator of the complex process that has been defined as the“angiogenic/metabolic switch” in ECs (Eelen et al., 2015). A working model for regulation of EC angiogenesis and bioenergetics by 3‐MST is presented in Figure 10.
FIGURE 6 Altered 3‐MST activity perturbs glycolysis and the pentose phosphate pathway in ECs. Global metabolomic profiling was performed on six groups as described in Figure 4 to determine the concentration of 669 metabolic compounds in each sample. (a) Schematic diagram of carbohydrate metabolism. Metabolites with significantly increased concentration after 3‐MST silencing and pathways with potential up‐regulation are shaded pink, while potentially down‐regulated pathways are shaded green. (b–g) Box plots of selected key metabolites. Values for each sample are normalized by Bradford protein concentration, followed by median scaling and imputation. *P≤ 0.05, shNT samples were compared to shNT control; sh3‐MST samples were compared to their corresponding shNT treatment group; Student's unpaired t‐test. All six groups consisted of data of five independent experiments (n = 5).
The current report also demonstrated that 3‐MST‐attenuated ECs subjected to shRNA lentiviral transduction or pharmacological inhibi-tion reduced EC proliferative capacity and migrainhibi-tion ability, indicating that the 3‐MP/3‐MST/H2S axis plays a significant role in angiogenesis. Consistent with previous reports demonstrating the bell‐shaped dose‐ dependency of H2S in biological systems (Szabo & Papapetropoulos, 2017), the addition of 3‐MP, the substrate of 3‐MST, also exerted dose‐dependent effects on EC proliferation: stimulation at low con-centrations (30–300 μM) and inhibition at higher concentration (3,000μM). These findings are in line with our previous report that 3‐MST‐silenced murine ECs showed decreased proliferation capacity
due to lower levels of phospho‐Akt (Ser473) and phospho‐VASP (Ser239), a marker ofPKGactivation (Coletta et al., 2015). In the cur-rent report, we also found that basal EC migration was suppressed by 3‐MST shRNA attenuation or pharmacological inhibition. Addition of 3‐MP at low concentration only stimulated the migration of control cells and not of the 3‐MST‐attenuated ECs. Moreover, addition of 3‐ MP at 3,000μM stimulated EC migration in all cell types, including sh3‐MST ECs. This result could be explained by recent reports indicat-ing that at high‐concentration 3‐MP releases H2S through non‐ enzymic processes and acts as an H2S donor (Coletta et al., 2015; Mitidieri et al., 2018).
FIGURE 7 3‐MST attenuation inhibits mitochondrial oxidative phosphorylation and ATP production. (a) Representative respiration rates (OCR/ protein, pmol O2·min−1·μg−1protein) from a single experiment are shown for wild‐type, shNT, sh3‐MST #1, and sh3‐MST #2 EC lines in serum‐ free cell culture media. (b) The area under the curve for each respiration parameter was collected from five independent experiments and plotted as a percentage of shNT values after subtracting the non‐mitochondrial respiration values. Please note that both sh3‐MST EC lines showed significantly suppressed mitochondrial respiratory parameters. (c) 3‐MP, (300 μM), stimulated the OCR of shNT ECs, but not that of sh3‐MST #2 ECs indicating the reduced 3‐MST protein level in sh3‐MST #2 ECs. The increments in OCR of shNT ECs and the absence of increments in OCR of sh3‐MST #2 ECs in the presence of 3‐MP are significant in all respiratory parameters. (d) The relative amount of ATP produced from glycolysis and oxidative phosphorylation was determined in shNT, sh3‐MST #1, and sh3‐MST #2 EC lines kept in high glucose or high galactose containing complete cell culture media. In sh3‐MST #1 ECs, the glycolytic ATP production showed borderline reduction, whereas both sh3‐MST EC lines had significant suppression in mitochondrial ATP production. Data represent mean ± SEM of five independent experiments (n = 5). *P≤ 0.05, significantly different from shNT ECs; one‐way ANOVA followed by Dunnett's post hoc test.
VEGF regulates numerous adaptive EC responses during angiogenesis. Several studies have described the complex interplay between H2S and VEGF. Some studies reported a stimulatory role of exogenous H2S on VEGF expression (Bir et al., 2012; Jang et al., 2014; Kondo et al., 2013; Wang et al., 2010). Others found that CSE‐ and CBS‐mediated H2S‐generating pathways regulate VEGF‐stimulated angiogenic cellular processes in ECs (Coletta et al., 2012; Longchamp et al., 2018; Papapetropoulos et al., 2009; Pupo et al., 2011; Saha et al., 2016). The current study is among the first to identify a possible role for 3‐MST in VEGF‐induced angiogenesis. More specifically, we showed that 3‐MST attenuation inhibited VEGF‐stimulated EC migration. Prior studies demonstrated that hypoxic conditions lead to up‐regulation of 3‐MST protein (Li
et al., 2013; Tao, Wang, Sun, & Zhu, 2017). It is also well‐recognized that hypoxia and hypoxia‐inducible factor signalling affect EC func-tion and angiogenesis, including VEGF up‐regulation (Wong et al., 2017). These findings coupled with results from our previous studies (Coletta et al., 2015) lead us to speculate that the PI3K/
Aktand the PKG/VASP signalling pathways may serve as the basis for VEGF/3‐MST crosstalk and that exposure of ECs to VEGF increases 3‐MST activity. We hypothesize that the increase in 3‐MST activity in reducing intracellular environments such as hyp-oxia could potentiate the effects of increased VEGF production con-tributing to the action of the“angiogenic/metabolic switch” (Kimura, 2015; Modis, Asimakopoulou, Coletta, Papapetropoulos, & Szabo, 2013; Nagahara, 2018).
FIGURE 8 3‐MST pharmacological inhibition blocks mitochondrial oxidative phosphorylation and ATP production. (a) Representative respiration rates (OCR/protein, pmol O2·min−1·μg−1protein) from a single experiment are shown for wild‐type ECs treated with different concentration of I3MT‐3 (3, 10, 30, and 100 μM) in serum‐free cell culture media. (b) The area under the curve for each respiratory parameter was collected from five independent experiments and plotted as a percentage of shNT values after subtracting the non‐mitochondrial respiration values. Please note that I3MT‐3 treatment significantly suppressed mitochondrial respiration in a dose‐dependent fashion. The relative amount of ATP produced from (c) glycolysis and (d) oxidative phosphorylation was determined in wild‐type ECs treated with I3MT‐3 at the indicated concentration (3,10, 30, and 100μM) kept in high glucose and high galactose containing complete cell culture media. Note that glycolytic ATP production was not changed, whereas 100‐μM I3MT‐3 significantly suppressed mitochondrial ATP production. Data represent mean ± SEM of five independent experiments (n = 5). *P≤ 0.05, significantly different from wild‐type ECs; one‐way ANOVA followed by Dunnett's post hoc test.
By examining tube‐like network dynamics, we demonstrated that tubular structures were markedly decreased by 3‐MST attenuation. This observation could be partly explained by reduced mitochondrial ATP production and decreased nucleotide pools determined by our bioenergetic and metabolomic analyses (Supporting Information Table S1). During tube formation, ECs initially form clusters then start to proliferate and sprout out while releasing multiple chemoattr-actants, such as purine/pyrimidine nucleotides, ATP, and growth fac-tors (Burnstock, 2007). ECs exposed to high glucose (35 mM) showed reduced tube formation ability due to low intracellular ATP content, which was restored by adding high‐energy polymer polypho-sphate suggesting a critical role of intracellular ATP level in tube formation (Wang et al., 2017). Consistent with these data, we found significantly suppressed mitochondrial ATP content in 3‐MST‐ attenuated ECs. Furthermore, de novo synthesis of nucleotides has been shown as an essential mechanism for EC spheroid capillary sprouting (Schoors et al., 2015). Our metabolomic data confirmed that sh3‐MST‐silenced ECs, and—to a lesser extent—inhibitor‐treated ECs, exhibited reduced levels of purine and pyrimidine compounds, such as
adenosine, guanosine, ribose 1‐phosphate, cytidine, uracil and thymi-dine. These findings indicate that EC‐derived purine and pyrimidine compounds serve (a) as energy fuel to generate tubular structures (e.g., ATP) and act (b) as building blocks for de novo nucleotide synthe-sis leading to cell division, proliferation, and migration, all of which are essential in tube development. Overall, EC 3‐MST activity regulates the organization of ECs into tube‐like structures by altering the levels of purine and pyrimidine compounds.
With respect to the bioenergetic role of 3‐MST, we found that 3‐ MST attenuation by shRNA or pharmacological inhibition significantly suppressed EC mitochondrial oxidative phosphorylation and ATP turn-over recorded by Seahorse. Furthermore, when we cultured 3‐MST‐ attenuated ECs in galactose‐containing media that enhance oxidative metabolism (Aguer et al., 2011), we detected reduced mitochondrial ATP production. Addition of 3‐MP stimulated EC basal respiration, ATP production, maximal respiration, and spare respiratory reserve capacity. Our bioenergetic experiments show that EC basal mitochon-drial function is intact, but their response to FCCP is high. This sug-gests that upon switching from quiescent ECs to a more proliferative FIGURE 9 3‐MST attenuation and inhibition only slightly affect glycolysis but increases glucose uptake. (a) Representative proton production rates (PPR/protein, pmol H+·min−1·μg−1protein) from a single experiment are shown for wild‐type, shNT, sh3‐MST #1, and sh3‐MST #2 EC lines conducted in serum‐free cell culture media. (b) The area under the curve for each glycolytic parameter was collected from five independent experiments and plotted as a percentage of shNT values after subtracting the non‐glycolytic acidification values. Please note that sh3‐MST #1 ECs showed suppression some of the glycolytic parameters. (c) Representative PPR (PPR/protein, pmol H+·min−1·μg−1protein) from a single experiment are shown for wild‐type ECs treated with I3MT‐3 at the indicated concentrations (3, 10, 30, and 100 μM) in serum‐free cell culture media. (d) The area under the curve for each glycolytic parameter was collected from five independent experiments and plotted as a percentage of shNT values. Only the highest 100‐μM concentration of I3MT‐3 suppressed all the glycolytic parameters significantly. Relative normalized glucose uptake is shown for (e) shNT, sh3‐MST #1, and sh3‐MST #2 EC lines and (f) wild‐type ECs treated with I3MT‐3 at indicated concentrations. Data represent mean ± SEM of five independent experiments; *P≤ 0.05, significantly different from shNT or wild‐type ECs; one‐way ANOVA followed by Dunnett's post hoc test.
phenotype during angiogenesis or under stress conditions, EC mito-chondria are capable of drawing upon a“reserve capacity” to serve higher energy demand.
The role of 3‐MST in EC glycolytic flux regulation remains unclear. Earlier studies have concluded that glycolysis is the primary metabolic pathway in ECs, from which 85% of the total ATP is gen-erated (De Bock, Georgiadou, & Carmeliet, 2013). Our metabolomic data showed that some glycolytic intermediates, such as fructose 1,6‐diphosphate, dihydroxyacetone phosphate, and 3‐phosphogly-cerate, accumulated in 3‐MST‐attenuated ECs, while pyruvate levels decreased. These results imply that glycolysis could be partly blocked at the glyceraldehyde 3‐phosphate dehydrogenase, aldolase or, possibly, pyruvate kinase level (Supporting Information Table S1). Conversely, lactate, an end product of this pathway, was slightly but not significantly increased in sh3‐MST cells compared to shNT. Some metabolites in the PPP were increased (6‐phosphogluconate and sedoheptulose‐7‐phosphate), and the ribose 1‐phosphate was decreased, suggesting that this pathway is also perturbed in sh‐3MST cells and to a lesser extent in ECs treated with I3MT‐3. Collectively, these metabolomic changes could indicate that 3‐MST attenuation in ECs (a) perturbed glycolytic activity and (b) redirected glucose towards the PPP.
It should be noted that the metabolomic data only represent a snapshot of steady‐state levels of biochemicals. Therefore, we con-ducted additional analyses (glucose uptake, Seahorse glycolysis assay, and ATP measurements) to further elucidate the 3‐MST‐related
alterations in glycolysis. We consistently found that both ECs with shRNA attenuation and I3MT‐3 inhibition of 3‐MST exhibited increased glucose uptake, suggesting a compensatory up‐regulation mechanism of the overall carbohydrate metabolism in response to the blockade of mitochondrial respiration. However, neither the Seahorse glycolytic assay nor the glycolytic ATP measurements showed significant alterations in 3‐MST‐attenuated ECs. Therefore, further studies will be necessary to elucidate the role of 3‐MST in the PPP and hexosamine pathway as additional glucose‐utilizing met-abolic pathways regulated by 3‐MST.
As expected, 3‐MST silencing induced a marked effect on up‐ regulation of sulfur intermediates such as methionine, homocysteine, hypotaurine, and taurine. This observation is consistent with the unchanged level of cysteine indicating that the other two H2S ‐produc-ing enzymes, CBS and CSE, are enzymically intact. These results also suggest that the effects of 3‐MST on the regulation of other enzymes adjacent to CBS and CSE in sulfur metabolism (e.g., hypotaurine dehy-drogenase) need to be further explored. There were also notable increases in dipeptide species and carnitine derivatives in response to 3‐MST knockdown and to a lesser extent after I3MT‐3 treatment (Supporting Information Table S1). Increased protein degradation and fatty acidsβ‐oxidation in response to reduced 3‐MST activity may indicate some degree of cellular energy depletion and redox imbalance in 3‐MST‐attenuated ECs. However, these speculations need further investigations. Studies have been inconsistent regarding whether fatty acid oxidation in ECs can provide energy directly (Kuo, Lee, & Sessa, FIGURE 10 Regulation of endothelial cell angiogenesis and bioenergetics by 3‐MST stimulation and attenuation. A schematic model of EC angiogenic and metabolic functions under conditions of (a) increased and (b) decreased 3‐MST activity. During 3‐MST stimulation, EC
mitochondrial function and mitochondrial ATP production increases. 3‐MST activation also increases EC angiogenic functions such as proliferation, basal and VEGF‐stimulated migration, and tube formation. These EC functions are also accompanied by increased nucleotide synthesis. When 3‐MST is attenuated by shRNA or pharmacological inhibition, mitochondrial function and ATP production is inhibited. Basic EC functions (e.g., proliferation, migration, and tube formation) and nucleotide synthesis are also impaired. As compensatory mechanisms, increased glucose uptake, sulfur metabolism, dipeptide production, and fatty acidβ‐oxidation are increased along with perturbed glycolysis and pentose phosphate pathways.
2017) or it is mostly responsible for de novo nucleotide synthesis in ECs (Schoors et al., 2015).
The metabolomic data support the view that 3‐MST attenuation results in significant perturbations in sulfur, protein, nucleotide, carbo-hydrate, and fatty acid metabolism, leading to a cumulative inhibitory effect on the“angiogenic/metabolic switch” in ECs. We speculate that pharmacological inhibition of 3‐MST may serve as a potential thera-peutic strategy for conditions associated with excessive angiogenesis such as cancer (Augsburger & Szabo, 2018) or diabetic retinopathy. Alternatively, stimulating 3‐MST activity could be beneficial in condi-tions where facilitated angiogenic responses would be beneficial (e.g., in the therapy of wound healing or after cardiac ischaemia).
Taken together, the present data demonstrate the regulatory role of the 3‐MP/3‐MST/H2S axis in human EC angiogenic responses (e.g., proliferation, migration, and tube‐like network formation) and mitochondrial respiration coupled with increased mitochondrial ATP production. We have characterized the metabolomic alterations of 3‐MST‐attenuated ECs and concluded that suppression of EC 3‐MST activity significantly perturbs sulfur, nucleotide, protein, fatty acid, and carbohydrate metabolism, without markedly affecting glycolytic flux regulation. Stimulating 3‐MST in ECs simultaneously supports EC bioenergetic/metabolic and angiogenic functions, while inhibiting 3‐MST in ECs blocks the “angiogenic/metabolic switch.” The data presented here support the view that the 3‐MST pathway may be a potential candidate for therapeutic modulation of angiogenesis.
A C K N O W L E D G E M E N T S
K.M. would like to thank Dr Kasia Broniowska for the helpful discus-sions during the analysis of the metabolomic data and Dr Emily Mercadante for her assistance in the preparation of this manuscript. This work was supported by the American Heart Association, Scientist Development Grant (16SDG29860009) to K.M. The project was also benefited additional funding sources: Bodossakis Foundation to S‐I.B. and A. Papapetropoulos, National Institutes of Health (R01CA175803 to C.S. and M.R.H.; T32 DK007639 to M.R.H.), and the Swiss National Foundation (31003A_179434) to C.S.
C O N F L I C T O F I N T E R E S T
The authors declare no conflicts of interest.
A U T H O R C O N T R I B U T I O N S
A.A.G., G.T., P.S., A. Pavlidou, S‐I.B., K.T., V.A.R., C.C., M.R.H., C.S., A. Papapetropoulos, and K.M. performed conceptualization. A.A.G., G.T., P.S., A. Pavlidou, S‐I.B., K.T., and K.M. carried out methodology. V.A.R., C.S., M.R.H., C.C., and K.M. obtained resources. A.A.G., P.S., C.C., M.R.H., C.S., A. Papapetropoulos, and K.M. carried out the writing. M.R.H., C.S., S‐I.B, A. Papapetropoulos, and K.M. obtained funding.
D E C L A R A T I O N O F T R A N S P A R E N C Y A N D S C I E N T I F I C R I G O U R
This Declaration acknowledges that this paper adheres to the princi-ples for transparent reporting and scientific rigour of preclinical research as stated in the BJP guidelines forDesign & Analysisand
Immunoblotting and Immunochemistry, and as recommended by funding agencies, publishers, and other organisations engaged with supporting research.
O R C I D
Csaba Szabo https://orcid.org/0000-0003-3110-4235 Katalin Módis https://orcid.org/0000-0002-0706-9196 R E F E R E N C E S
Aguer, C., Gambarotta, D., Mailloux, R. J., Moffat, C., Dent, R., McPherson, R., & Harper, M. E. (2011). Galactose enhances oxidative metabolism and reveals mitochondrial dysfunction in human primary muscle cells. PLoS One, 6, e28536. https://doi.org/10.1371/journal.pone.0028536
Alexander, S. P., Kelly, E., Marrion, N. V., Peters, J. A., Faccenda, E., Har-ding, S. D., … CGTP collaborators (2017). The Concise Guide to PHARMACOLOGY 2017/18: Overview. British Journal of Pharmacol-ogy, 174(Suppl 1), S1–S16. https://doi.org/10.1111/bph.13882 Augsburger, F., & Szabo, C. (2018). Potential role of the 3‐
mercaptopyruvate sulfurtransferase (3‐MST)‐hydrogen sulfide (H2S) pathway in cancer cells. Pharmacological Research. https://doi.org/ 10.1016/j.phrs.2018.11.034
Bibli, S. I., Luck, B., Zukunft, S., Wittig, J., Chen, W., Xian, M.,… Fleming, I. (2018). A selective and sensitive method for quantification of endoge-nous polysulfide production in biological samples. Redox Biology, 18, 295–304. https://doi.org/10.1016/j.redox.2018.07.016
Bir, S. C., Kolluru, G. K., McCarthy, P., Shen, X., Pardue, S., Pattillo, C. B., & Kevil, C. G. (2012). Hydrogen sulfide stimulates ischemic vascular remodeling through nitric oxide synthase and nitrite reduction activity regulating hypoxia‐inducible factor‐1alpha and vascular endothelial growth factor‐dependent angiogenesis. Journal of the American Heart Association, 1, e004093.
Burnstock, G. (2007). Purine and pyrimidine receptors. Cellular and Molec-ular Life Sciences, 64, 1471–1483. https://doi.org/10.1007/s00018‐ 007‐6497‐0
Carmeliet, P. (2003). Angiogenesis in health and disease. Nature Medicine, 9, 653–660. https://doi.org/10.1038/nm0603‐653
Chaudhri, V. K., Salzler, G. G., Dick, S. A., Buckman, M. S., Sordella, R., Karoly, E. D.,… McGraw, T. E. (2013). Metabolic alterations in lung cancer‐associated fibroblasts correlated with increased glycolytic metabolism of the tumor. Molecular Cancer Research, 11, 579–592. https://doi.org/10.1158/1541‐7786.MCR‐12‐0437‐T
Coletta, C., Módis, K., Szczesny, B., Brunyánszki, A., Oláh, G., Rios, E. C.,… Szabo, C. (2015). Regulation of vascular tone, angiogenesis and cellular bioenergetics by the 3‐mercaptopyruvate sulfurtransferase/H2S path-way: Functional impairment by hyperglycemia and restoration by DL‐ alpha‐lipoic acid. Molecular Medicine, 21, 1–14. https://doi.org/ 10.2119/molmed.2015.00035
Coletta, C., Papapetropoulos, A., Erdelyi, K., Olah, G., Modis, K., Panopoulos, P.,… Szabo, C. (2012). Hydrogen sulfide and nitric oxide are mutually dependent in the regulation of angiogenesis and endothelium‐dependent vasorelaxation. Proceedings of the National Academy of Sciences of the United States of America, 109, 9161–9166. https://doi.org/10.1073/pnas.1202916109