HAL Id: hal-01562084
https://hal.inria.fr/hal-01562084
Submitted on 13 Jul 2017
HAL is a multi-disciplinary open access
archive for the deposit and dissemination of sci-entific research documents, whether they are pub-lished or not. The documents may come from teaching and research institutions in France or abroad, or from public or private research centers.
L’archive ouverte pluridisciplinaire HAL, est destinée au dépôt et à la diffusion de documents scientifiques de niveau recherche, publiés ou non, émanant des établissements d’enseignement et de recherche français ou étrangers, des laboratoires publics ou privés.
María-Jesús Lobo, Caroline Appert, Emmanuel Pietriga
To cite this version:
María-Jesús Lobo, Caroline Appert, Emmanuel Pietriga. MapMosaic: Dynamic Layer Compositing for Interactive Geovisualization. International Journal of Geographical Information Science, Taylor & Francis, 2017, 31 (9), pp.1818 - 1845. �10.1080/13658816.2017.1325488�. �hal-01562084�
RESEARCH
ARTICLE
MapMosaic:
Dynamic Layer Compositing
for
Interactive Geovisualization
Mar´ıa-Jes´us Loboa,b,c∗, Caroline Appertb,a,cand Emmanuel Pietrigaa,b,c
aINRIA;bUniversit´e Paris-Sud & CNRS; cUniversit´e Paris-Saclay, Orsay, France
GIS software applications and other mapping tools enable users to correlate data from multiple layers and gain insight from the resulting visualizations. However, most of these applications only feature basic, monolithic layer compositing tech-niques. These techniques do not always support users effectively in their tasks, as we observed during interviews with GIS experts. We introduce MapMosaic, a novel approach based on dynamic visual compositing that enables users to interactively cre-ate and manipulcre-ate local composites of multiple vector and raster map layers, taking into account the semantics and attribute values of objects and fields in the composit-ing process. We evaluate MapMosaic’s interaction model against that of QGIS (a widely-used desktop GIS) and MAPublisher (a professional cartography tool) using the “Cognitive Dimensions” framework and through an analytical comparison, show-ing that MapMosaic’s model is more flexible and can support users more effectively in their tasks. We also report on feedback obtained from experts, which further con-firms the potential of this highly dynamic approach to map layer compositing.
Keywords: Geovisualization; Interactive Layer Compositing; User Interfaces.
1. Introduction
One of the main human-computer interaction challenges in geographical information systems is to enable users to quickly access, correlate and make sense of the many, possibly very het-erogeneous, datasets that must be brought together to achieve a given task (Elias et al. 2008, Lobo et al. 2015). Indeed, while cartographic representation helps users think and communicate visually (MacEachren 2011), visual representation alone is often insufficient to cope with the quantity and diversity of datasets brought together in application areas such as: disaster map-ping (Palen et al. 2015) and emergency response management; transportation networks (Bast et al. 2014); multi-criteria decision making (Jankowski et al. 2001); or the news media (Gao et al.2014). User interaction can be seen as complementary to visual representation and helps alleviate this problem. It enables users to adapt the visual representation so as to emphasize rel-evant subsets of the data depending on the task at hand (Andrienko and Andrienko 1999, Roth 2013a,b).
Some geovisualization systems provide elaborate interactive data visualizations (see Chang et al.(2007), Slingsby et al. (2014), Speckmann and Verbeek (2010), Wood et al. (2007) for representative examples), but those systems are domain-specific. They mostly enable interac-tions dedicated to the specific data managed by a particular application. When considering general-purpose GIS user interface front-ends, from both research projects (Cruz et al. 2013,
Grosso et al. 2013) and industrial-strength products such as ArcGIS(http://www.esri.com/
software/arcgis) and QGIS(http://www.qgis.org), once the map has been built, inter-active navigationis simple and direct, but limited to basic interaction techniques such as pan & zoom, layer toggling or text search. These techniques consider the layers as flat images that can only be superimposed, juxtaposed, and sometimes drilled through. On the contrary, the creation and editingof more elaborate layer composites is cumbersome, involving many indirect manip-ulations. This results in models of user interaction that offer poor support for the exploratory navigation and analysis tasks involved in, e.g., simulation and planning, surveying & updating topographic features, or natural disaster management (Jones et al. 2009).
As we will see in Section 3, many of these tasks require users to reconfigure which layers are visible and how they are arranged. But having to repeatedly toggle between layers represents a significant impediment from the users’ perspective, and there are situations where basic, mono-lithic toggling of layers is not the most relevant way of visualizing and navigating in the data. We argue that digital maps are highly-structured, semantics-rich user interface components that have the potential to offer more elaborate forms of interaction between users and map-based systems (Wilson et al. 2008, Schmid 2013). Based on the observation that layer composition plays an essential role in many tasks (Elias et al. 2008), we introduce MapMosaic, an approach to dynamic visual compositing that takes advantage of these semantics and structure, enabling novel techniques to interactively create and manipulate local composites of multiple vector and raster map layers.
After discussing our motivation in taking this approach, we report on interviews conducted with GIS experts. These interviews helped identify interactive layer compositing, which is based on the technique known as digital image compositing in the field of computer graphics (Porter and Duff 1984), as a key aspect of users’ interaction with map content. We then introduce our main contribution: a dynamic map compositing model, and describe a prototype implementation (see Figure 1) for which we report graphics rendering performance figures. The two sections that follow provide first steps toward validating our model: 1) an evaluation against the “cognitive dimensions” framework(Green and Petre 1996), as well as a detailed analytical comparison of MapMosaic against QGIS, a widely-used desktop GIS, and MAPublisher, a professional
Figure 1. A proof-of-concept implementation of the MapMosaic dynamic compositing model and inter-action techniques. (a) Toolbar to navigate the map, and to create & select areas. (b) Map viewer. (c) Access to individual layers. (d) Compositing area inspector. (e) Query builder for compositing region filters.
from workshops with GIS expert users. We conclude with directions for future work.
2. Background and Motivation
Layers consist of either objects or fields. They can be superimposed in a single view, or com-posed using other strategies, making it possible for users to correlate entities from different sources, interpret them in a broader context, compare them, gain novel insight from this visual combination (Elias et al. 2008), and communicate them.
Beyond the compositing techniques commonly encountered in interfaces for comparing two maps or images (Lobo et al. 2015), recent work in cartographic research has produced meth-ods to overlay ortho-rectified imagery and topographic maps or other vector data (Hoarau and Christophe 2015, Hoarau et al. 2013, Raposo and Brewer 2011). Such methods make use of digital compositing (Porter and Duff 1984), where an image is obtained by assembling multi-ple images using alpha blending to control the visibility and opacity of the source images in different regions of the final image. The resulting map-compositing techniques are quite elab-orate in terms of graphics rendering, but are designed to produce static composite maps. They do not support the interactive exploration tasks we discuss in the next sections effectively. On
the industry side, MapStack(http://mapstack.stamen.com) provides some compositing
capabilities, limited in scope to three predefined areas (water, buildings, parks). Such simple ap-proaches are targeted at lay users who want to easily create basic personalized maps (Christophe 2012, Ballatore and Bertolotto 2015).
GIS and cartography tools such as MAPublisher offer much more powerful features. They combine general-purpose layering and compositing techniques with geospatial data query and attribute-based filtering capabilities. However, these tools have been designed with the produc-tion of high-quality, static graphics output in mind. The cumbersomeness of the associated in-teraction model and its lack of support for dynamic compositing significantly impedes the ex-ploratory processes users are often involved in. While some tools such as ArcGIS do feature support for more interactive forms of compositing, the capabilities are limited to coarse, data-agnostic techniques such as toggling and swiping between two layers (Lobo et al. 2015), that only enable very basic types of compositing.
Exploratory tasks typically involve numerous navigation actions between layers: adding and discarding some of them, filtering objects within those layers, and making incremental adjust-ments to the visual representation, including adjustadjust-ments to the graphical compositing settings,
its geographical scope, the objects and fields to be considered based, e.g., on their type or on in-dividual attribute values. The approach taken by the tools mentioned above makes such iterative processes possible but quite cumbersome. As discussed in Section 6, users who want to make even small adjustments to their composite representation (adjust the scope of masks, filtering cri-teria, or graphical compositing rules) will often have to redo their selection and recreate the cor-responding compositing masks from scratch, going through many interface dialog boxes. This interrupts users’ train-of-thought and imposes much extraneous cognitive load on them (Sweller et al.1998) as they have to plan for these sequences of actions.
MapMosaic takes a different approach, proposing a new, dynamic model for layer composit-ing. MapMosaic exposes compositing operations as first-class objects, enabling users to manip-ulate them in a more direct manner (Shneiderman 1983). Users are able to edit the properties of these objects at any time, and get immediate visual feedback that tightens the perception-action loop and facilitates the exploratory process from a cognitive perspective.
3. Interviews with GIS experts
Before designing MapMosaic, we conducted a series of interviews with a panel of GIS experts whose tasks are representative of the wide range of activities that require users to interact with multi-layer maps. Our pool of interviewees comprised four GI Science researchers with diverse interests and expertise, and ten GIS operators from IGN, the French National Geographic In-stitute. These interviewees work in different departments, performing varied tasks that involve the combination of different datasets. We focus here on aspects of tasks and associated user interactions that involve some form of layer compositing.
3.1. GIS Operators
In order to get a more realistic picture of the tasks performed by GIS operators, we interviewed them in their work environment, seated together in front of their workstation running the soft-ware applications they use daily. The following sections report on the tasks typically performed in the four departments we visited.
3.1.1. Digital Elevation Models
The work of operators tasked with the production of Digital Elevation Models (DEM) basi-cally consists of fixing a field (resolution: 5 meters) that results from the automatic processing of satellite data. This treatment also outputs a layer that contains masks delineating regions in which the algorithm has required several iterations to derive the altitude from the input data. Multiple iterations are indicative of uncertainties that should be checked manually. To perform such verifications, the operators compare the model to multiple layers: orthoimagery, masks de-rived from specific object types retrieved from a database (e.g., water bodies, whose elevation is known and should be constant), data from a third-party, lower-resolution DEM. In the software application used for this task, the different layers are stacked on top of each other and are pre-sented as a textual list with checkboxes that control their visibility. Beyond this basic, monolithic approach to layer management (where the content of a layer is either displayed in full or not at all), the software application also features a tool that enables operators to reveal another layer in a region of arbitrary shape by delineating that region and selecting which layer to reveal inside it.
3.1.2. Aeronautical Charts
Aeronautical charts are very complex maps used when preparing flights and navigating air-crafts. They are made of many layers. The operators’ task consists of updating both the civilian and military versions, including, among other things, lists of obstacles that have been identified by third parties. Based on a structured text-based representation of the data, operators must po-sition these obstacles on both versions of the map, and input the version-dependent attributes that describe them. Their user interface front-end features more than ten tabs, one per layer. As the tool only supports monolithic compositing, operators spend a significant amount of time toggling between tabs: two tabs show all layers superimposed, one for each version, while other tabs show a series of derived charts that provide a lighter representation. These latter charts fo-cus on certain types of obstacles such as pylons or windmills, facilitating specific user tasks by simplifying the otherwise-very-complex visualization.
3.1.3. Land Cover and Use
The institute is also in charge of producing maps that describe the land in terms of cover and use. Using photo interpretation, operators have to make a partition of the land into contiguous polygons with attributes that describe the type of cover (e.g., grass, trees, asphalt) and its des-tination use (e.g., farmland, woods, urban area) at a scale of 1:2000. To cut or fuse polygons, they overlay a semi-transparent vector layer holding the polygons on top of orthoimagery. To help operators structure their work, the software application overlays a grid that they can follow sequentially. Depending on the regions considered and on their personal preferences, operators frequently switch between two types of orthoimagery layers, that differ in the data channels they encode (Red-Green-Blue or Red-Green-Infrared). Again, because only monolithic compositing is supported in this application, all layers are made available in separate tabs, requiring operators to toggle between them frequently.
3.1.4. Database Curation
Operators from this department are in charge of continuously updating the institute’s main database, that contains the most detailed representation of all entities. Most of the products and services offered by the institute are derived from this database. The operators’ task consists of identifying places that have to be updated, and collecting the necessary information to add, modify or remove objects. They perform one part of their job in the field, and the other part in the office. In the office, they access many sources of information, including numerous layers such as ortho-rectified aerial imagery (very high-resolution, updated every 5 years), satellite imagery (lower resolution, updated more frequently), and different thematic layers that hold specific types of entities (e.g., roads, buildings and addresses, forests), as well a layer that highlights the areas that need to be checked. We observed the same pattern as in the above scenarios: operators frequently have to navigate between layers using tabs, thus changing the content of the entire viewport at once and often losing the contextual information that was available in the previous tab, imposing much back-and-forth in terms of user interface window management.
3.2. GI Science Researchers
Among the four GI Science researchers, three investigate cartographic processes (e.g., gener-alization and symbol specification). The last one works in a team that studies risk management from a socio-environmental perspective.
3.2.1. Cartographic Processes
The first three researchers focus on formalizing knowledge about cartographic processes (e.g., generalization, map styling and symbol specification). They investigate methods and tools to improve the design and automatic generation of maps. Because of the exploratory and bleeding-edge nature of their work, they rely mostly on programming tools to implement their data pro-cessing, geometry transformation and rendering methods. But they also use general-purpose GIS front-ends to debug and evaluate the results of these treatments. For instance, when developing a generalization algorithm (Touya and Girres 2013), one researcher expressed the need to better understand and compare the different steps of his algorithm. He wanted to compare not only the input map with the generalized output map, but also intermediate steps for debugging purposes. Such comparisons require computing the intermediate output from the different steps, and ren-dering them on separate, superimposed layers using distinct graphical styling rules to make it easy for users to visually differentiate them. Furthermore, this complex compositing should be bounded to the region of interest only, leaving the surrounding area untouched so as to preserve the geographical context.
Another researcher, who is more interested in symbol specification and map styling, reported spending a lot of time and effort juxtaposing the multiple alternative renderings that she wanted to compare.
Here again, we observe that the associated layer compositing and comparison tasks are often performed manually, as current GIS user interface front-ends do not offer the flexibility these users need in terms of region-based compositing and concurrent visualization of multiple layers.
3.2.2. Risk Management
This fourth researcher works in a team that focuses specifically on the assessment of environ-mental risk, the modeling of its potential impact, and the creation of tools for supporting public policy decision makers and increasing public awareness. Activities related to this type of risk management are split in two main phases: before the disaster and after the disaster. Each phase involves different types of tasks.
Before the disaster, efforts focus on activities related to risk prevention, such as the creation of evacuation plans for coastal regions that face risks of tsunamis. The corresponding cartographic processes involve collecting knowledge from the field, which then gets correlated with different layers, both raster (orthoimagery) and vector (road networks, population grids, simulations).
After the disaster, situation awareness is of prime importance. Authorities need to know about the current status of the different geographical areas, road and communication networks and other critical infrastructure. They rely partly on rapid mapping (Palen et al. 2015) for this. These quickly-produced maps serve as a basis to coordinate emergency response actions, such as evac-uating a school or routing injured people to hospitals. Rapid mapping essentially relies on photo interpretation performed by experts or crowdsourcers (Palen et al. 2015), who compare incom-ing up-to-date satellite or aerial imagery with photos taken before the disaster, in order to identify and mark damaged buildings and roads. As external elements, such as weather conditions, can impact the quality and coverage of post-catastrophe images (occluding clouds, snow-covered area), rapid mappers may have to consider multiple images of the same region (e.g., at different times or seasons) to get a good visualization of the area they are working on. These mapping tasks not only require integrating information from heterogeneous map layers but also being able to quickly identify specific types of entities such as critical infrastructure.
3.3. Design Requirements
The above interviews show that experts work with a number of layers ranging from three to more than ten, both raster and vector. These experts frequently have to navigate between views that consist of different combinations of those layers. Which target layer(s) they aim at combining and visualizing not only depends on their task and work habits, but also in many cases on the nature of the region of interest. How these layers can be effectively combined then depends essentially on their respective content and level of visual complexity. For instance, a sparse, symbolic layer can be composited with a terrain base map using a simple overlay technique. But compositing a field with ortho-imagery will typically require the use of a more elaborate alpha blending operator to achieve semi-transparency (Porter and Duff 1984); and combining two dense and visually complex layers such as, e.g., a topographic map and ortho-imagery, will require interactive navigation (Lobo et al. 2015), as static alpha-blending would inevitably cause too much visual interference between the two layers.
As most software applications only support monolithic forms of layer management and com-positing, users can only resort to a very limited set of strategies, which range from basic, indi-vidual layer visibility toggling to tab switching, each tab holding a specific layer compositing configuration. In all cases, users have to perform numerous back-and-forth switches. Our first design requirement is thus to limit such switches.
The second (related) issue is the lack of support for flexible, local compositing, i.e., layer com-positing operations bounded to specific regions of the display. Monolithic comcom-positing forces users to perform numerous switches between layer configurations. But it also prevents them from retaining contextual information visible on screen, knowing that context is often key to interpretation and navigation. Drawing a parallel with multi-scale navigation (Cockburn et al. 2009), users can be faced with a variant of desert fog when switching between layers or arrange-ments thereof. Desert fog is a term that was coined by (Jul and Furnas 1998) to refer to the “condition wherein a view of an information world contains no information on which to base navigational decisions”, or in other words, “where the immediate environment is totally devoid of navigational cues”, leaving users disoriented. This can happen in multi-scale worlds when, for instance, zooming in or out too much, as all relevant landmarks and meaningful visual cues disappear in the process. Transposed to the case of navigation between multiple layers, desert fog may occur when navigation is mainly driven by visual cues that belong to one specific layer. In an analysis task that involves multiple geographical areas, users might have to change the visibility or compositing settings of that layer to achieve the analysis task locally. Navigational cues may thus be invisible or difficult to see, in turn requiring more actions to resume naviga-tion once the task has been completed in one locanaviga-tion. Switching abruptly between two layers or layer composites can also cause disorientation, as some entities might be difficult to relate visually, despite the layers being spatially registered. Roads provide a simple illustration of this phenomenon: while they are easy to identify on topographic maps, they can be challenging to trace on satellite imagery depending on the terrain, vegetation, and lighting conditions. Our sec-ond design requirement – providing support for local compositing – is aimed at enabling users to keep landmarks and other navigational cues from the relevant layer visible as contextual in-formation, while at the same time revealing layers relevant to the task-at-hand in the current region of interest. Users should be able to perform such local compositing operations either in-teractively, as part of the exploration process, or automatically, based on the value of individual object attributes in the considered geographical area, which would provide cues about objects of potential interest, thus guiding users in their exploration.
We derive two additional, secondary requirements from our interviews with experts. 1) Some maps, such as the aeronautical charts mentioned previously, get quickly cluttered with many symbols. Users need to filter out part of the information to retain only what is meaningful to the
task at hand. User interface front-ends should make the creation of simplified layers easy, by allowing users to filter out objects based on their type and attributes. 2) Updating a map often requires conducting a systematic exploration with either an entity-driven strategy (focusing on specific thematic layers) or a wall-to-wall strategy (scanning the full area at a given scale). Front-ends should support both strategies, allowing users to keep track of their exploration by automatically marking the regions or entities already visited.
The following section introduces the fundamental concepts of MapMosaic, explaining how our dynamic compositing model addresses those requirements, and detailing the core user inter-face design principles that we followed in order to provide GIS users with an interaction model that facilitates geovisualization-based exploratory processes.
4. MapMosaic: Concepts and Features
The MapMosaic model is designed to enable advanced graphical compositing operations, simi-lar to those of cartographic tools, but more flexible thanks to 1) support for dynamic composit-ing, and 2) a very different user interaction model that provides immediate visual feedback and significantly simplifies the configuration and adjustment of layer compositing parameters, thus better supporting tasks such as those presented in the previous section (Jones et al. 2009).
MapMosaic’s foundational concept is that of compositing regions. Compositing regions en-able users to combine layers either globally or locally. They are the cornerstone of our approach to what we call on-demand spatial multiplexing, i.e., the possibility to interactively combine
multiple map layers into one dynamic map.1 Compositing regions act as masks that can be
moved using drag and drop, and whose parameters can be adjusted dynamically, according to the direct manipulation paradigm (Shneiderman 1983): MapMosaic exposes those masks as first-class, interactive objects (Kwon et al. 2011) that users can create and iteratively modify without resorting to complex tools or dialog boxes. Parameters of those objects include typical image compositing settings such as alpha blending and boundary styling, as well as filters that can be used to further customize compositing within the region using simple queries. In this section, we describe MapMosaic’s interaction model and illustrate it on an example scenario in which an expert in risk management works on a tsunami evacuation plan for an island in the Caribbean. This scenario is directly derived from a concrete use-case that the crisis management expert’s team worked on recently. The expert reported that building such an evacuation plan is a tedious process for which they relied mostly on QGIS and field observations.
4.1. Layers
As shown in Figure 1, users can load both raster and vector layers in the system. Each raster layer is made available directly in the Map viewer (Figure 1-b). As in most GIS user interface
front-ends, users can navigate each map using pan-and-zoom. The COMPOSITE tab holds all
layers. The opacity of each layer can be changed individually (Elias et al. 2008). Users can also access a rendering of each layer in isolation by clicking on the corresponding tab (Figure 1-c). MapMosaic provides support for this classic layer-compositing interface because dynamic local compositing should not be seen as a replacement for monolithic compositing, but rather as a complement to it.
1Drawing an analogy with the field of telecommunications, where the aim of multiplexing is to share a communication channel (a limited resource) by combining multiple signals into one: our signals are the individual map layers, and our main limited resource is screen real-estate.
Typical raster layers include orthoimagery, pre-rendered maps, as well as raw fields such as digital elevation models or temperature maps, which can be rendered by mapping the field’s range of values to a color gradient (the mapping’s interpolation function and the color gradient’s endpoints can be parameterized). Vector layers can also be rendered, but they serve other pur-poses as well. One of them is to partition the map into areas based on the objects they contain: buildings, roads, water bodies, etc. Because this partitioning is geographically meaningful, it can play a role in the identification, or more specifically in the delineation, of regions of the visual representation, to which specific compositing settings can then be applied. MapMosaic thus enables users to directly derive compositing regions from objects stored in vector layers.
Objects in vector layers can be selected by clicking on them with the default selection tool. As objects may overlap, MapMosaic highlights which one will be selected (changing its stroke and using a translucent fill color) whenever the cursor moves. The strategy consists in system-atically picking the smallest object containing the cursor, so as to remove any ambiguity about which object is the current target. A click is required to actually select the object. Additional clicks performed at the same location will pick the direct parent of the candidate object in the containment hierarchy.
In our tsunami evacuation map-making scenario (Figure 1), the expert has loaded five raster layers: ORTHO (aerial imagery), POPULATION (a population grid based on census data), AL
-TITUDE(a digital elevation model), SCAN (a topographic map) and a SIMULATIONof forecast coastal flooding; as well as four vector layers that describe different types of objects:BUILD
-INGS,CRITICAL INFRASTRUCTURE,ROADS, andEVACUATION ZONES.
4.2. Compositing Regions
Once a set of layers has been loaded, users can derive a compositing region from the currently-selected area in theCOMPOSITEtab. Compositing regions can be seen as geo-referenced clipping
masks that composite multiple layers. A key element of our model is the reification (Beaudouin-Lafon and Mackay 2000) of compositing regions, meaning that compositing regions are consid-ered as first-class objects. Those objects have many attributes that can be edited at any moment using an inspector window similar to those found in integrated development environments or vector graphics applications, as detailed below.
Compositing regions always delineate a particular geographical region, but are not nec-essarily derived from objects stored in vector layers. Following the principle of polymor-phism in user interface design, which “permits commands to be applied to objects of different
types”(Beaudouin-Lafon and Mackay 2000), compositing regions can also be derived from any
user-drawn selection made with one of the tools featured by MapMosaic: lasso, circle, rectangle and magic wand (Figure 1-a), inspired by similar selection tools found in image editors. In the absence of any selection, the entire map acts as an implicit compositing region, enabling the specification of compositing operations that affect the whole workspace, which can be useful when combined with filters, as we will see later.
Once a selection has been turned into a compositing region in the inspector (Figure 1-d), users can select the target layer from the list of all layers, or they can choose to composite with a custom solid color. Additional parameters include: opacity settings, outline stroke to artificially delineate a region, and control over the smoothness of the transition with the surrounding region (see Figure 3), so as to achieve an effect similar to that enabled by blending lenses (Pietriga et al.2010). In our example scenario, the user selects one of the evacuation zones (stored in the
EVACUATION ZONESvector layer) and turns it into a compositing region (Figure 2-1), choosing SIMULATIONas the target layer in order to identify the zones that would be flooded in case of a tsunami.
a c a b d c 2
Figure 2. (1) Creating a compositing region from an existing vector object: (a) theEVACUATION ZONE
is selected by clicking on it, (b) the selection is turned into a compositing region, and (c)SIMULATION
gets chosen as the target layer. (2) Activating filters in the region: (a) theCRITICAL INFRASTRUCTURE
filter is activated, (b) red is chosen as a fill color for the target layer, (c) theROADSfilter is activated, and (d) theALTITUDElayer gets selected for compositing. (3) User-created free compositing region: showing
ORTHOimagery to find a refuge zone, renderingROADSby compositing them with theALTITUDElayer, and showingCRITICAL INFRASTRUCTURESas red spots.
Other operations borrowed from graphics editors include dilation and erosion, which respec-tively expand and contract a region while preserving its general shape. This can be particularly useful when selecting objects such as, e.g., roads. A road is typically represented as a simple polyline in vector layers, which only becomes a renderable surface through a symbolization process. In MapMosaic, such objects can be turned into compositing regions by clicking the corresponding polyline, and dilating it to encompass not only the road itself but also the road-side. Users no longer have to manually delineate the region around the polyline, an interaction which is often tedious to perform. If only raster layers are available, the magic wand can be used as a tool to perform a selection of all contiguous pixels of the same color, which can then also be dilated.
The reification of compositing regions allows multiple regions to coexist and remain fully ma-nipulable throughout their lifecycle. Any of their attributes can be dynamically modified using the inspector (Figure 1-d). The changes are reflected on-the-fly in the map view, as parameters get adjusted (Shneiderman 1994), providing users with immediate visual feedback that tightens the perception-action loop.
When moved according to the principle of direct manipulation, using drag-and-drop, com-positing regions will behave in one of two ways:
• Regions can be free, in which case their geographical scope gets updated in real-time as users
drag them over the map, behaving as magic lenses (Bier et al. 1993). Free regions stay where users drop them.
• On the contrary, docked regions follow the cursor when dragged, but revert to their
origi-nal position when dropped. Their geographical scope is not updated while dragging, as the rationale behind this behavior is to provide a quick and easy means to temporarily move a compositing region away, so as to compare the same geographical area in two or more layers using simple juxtaposition, without having to modify the settings of the layer composite. Compositing regions derived from vector objects are docked by default, as they are associated with a meaningful geographical region, while compositing regions derived from hand-drawn
selections are left free, as they are more likely to be used as scanning tools.
The above two types of compositing regions can also provide support to users who need to adopt a systematic scanning strategy as part of their task. Wall-to-wall scanning is best supported by free compositing regions. These regions can be set to leave a translucent trace wherever they have been on the map, thus helping users keep track of their exploration path. Entity-driven scanningis also supported, as users can apply a filter (see Section 4.3) on entities of interest to highlight them, and to derive docked regions from them. Users can then inspect these regions one after the other, and mark the visited ones by, e.g., compositing them with a translucent solid color.
4.3. Filters
Users can declare specific styling and compositing rules, that will apply to all objects that fall inside a given compositing region, based on their type and attributes. Simple rules that apply to all objects of a given type are created using the corresponding subpanel in the region’s inspector (see, e.g.,Critical infrastructure or Roadsin Figure 2-2). More complex rules that involve elabo-rate selection criteria (for instance, “all buildings at least 10 meters high”, Figure 4-b) are created using the query builder (Figure 1-e). This UI component contains one tab per type of object, each tab featuring a widget for each attribute associated with that type: spinners for numerical ranges, checkbox lists for categorical attributes. An additional text field enables skilled users to input compound queries using numerical and boolean operators. The content of this user interface component always reflects what is stored in the layers currently loaded in the application. For instance, in Figure 1-e, all widgets (attribute names, possible values for categorical variables, etc.) have been extracted automatically from the shapefiles that correspond to the vector layers.
Following the principles of reification, polymorphism and reuse further (Beaudouin-Lafon and Mackay 2000), filter settings can be copied and pasted from one compositing region to another using a contextual menu, thereby making it easy to create a new region with a different scope but featuring the same styling and compositing rules.
Coming back to our tsunami scenario, the user now wants to find the buildings that are part of the critical infrastructure to be evacuated. To do so, he activates theCRITICAL INFRASTRUC
-TUREfilter and selects a target layer that consists of a simple red solid color fill to emphasize those buildings (Figure 2-2-(a,b)). This reveals one such building on the map (a school). The next step is to find a suitable road for evacuation. He applies a filter onROADSin the evacuation region, selectingALTITUDEas the compositing target layer to avoid choosing a road that is too
steep (Figure 2-2-(c,d)). In this area, all roads are flat and at a low altitude (i.e., they are all ren-dered with shades of green in the revealedALTITUDEraster layer), so he can choose any of them to evacuate the school. The user then wants to explore the vicinity of the candidate evacuation roads, in order to identify an area that can serve as a refuge zone. Satellite imagery would help him get oriented and recognize areas that he explored during his field survey. He draws a circular selection, copies and pastes the filter settings from the evacuation zone to keep the roads and the critical infrastructure visible, but choosesORTHOas the target layer.
The user can then scan the area by dragging this compositing region. Once a suitable refuge zone has been found, he uses the lasso tool to delineate it onORTHO, and derives an additional compositing region (Figure 3-a) from this selection. Using a second lasso selection, he selects the part of the road that links this zone to the school, restricting compositing toROADSusing a white solid color (Figure 3-b). Finally, he creates one last compositing region using thePOPULATION
grid as a target layer (Figure 3-c) to check that the refuge zone is large-enough to accommodate all people in the area.
Figure 3. (a) Refuge zone found by examining aerial imagery. (b) Road connecting the critical infras-tructure (symbolized by the red spot) to the refuge zone. (c) Compositing region showing population grid in the evacuation zone.
5. Implementation and Performance Evaluation
Roth observed that when users interact with a map view, the display should be refreshed with a minimum frequency of 10Hz “for the user to feel as though the system is responding immedi-ately”and 1Hz “to avoid interrupting [his] thinking process” (Roth 2013b). This is especially true for interactive exploratory tasks, that will benefit from high frame rates. Multi-layer maps are complex graphical objects that are resource intensive in terms of graphics rendering. Map-Mosaic’s compositing techniques add even more complexity to the rendering pipeline. We thus implemented our prototype in Java and OpenGL using JOGL (Java Bindings for the OpenGL API) to ensure interactive frame rates: Java’s event dispatching thread handles input events, feeding a FIFO (first-in/first-out) queue processed by the JOGL rendering loop at each iteration. Our prototype implementation is not a full-fledged GIS front-end, but rather a proof-of-concept implementation of our dynamic compositing model, and demonstrator of novel tech-niques that could be integrated in existing GIS software. We thus only support a subset of input data formats, including Esri shapefiles for vector data and GeoTIFF for raster images. Vector
data are imported using GeoTools(http://www.geotools.org) and converted to
OpenGL-renderable shapes using the poly2tri algorithm (Liang 2008).
Compositing regions are drawn using shader programs written in GLSL (the OpenGL Shading Language). Different shaders are used depending on the shape’s content (texture or solid color) and border style (featuring smooth blending or not). Data such as model-view and orthographic projection matrices, textures, and colors, are passed to the shaders using global variables.
The rendering of compositing regions that feature filters can be resource-intensive, as it in-volves many operations on a potentially large number of shapes, including the computation of intersections. We adopt the following strategy to ensure interactive frame rates when moving those regions. We render the compositing region’s main target layer into a frame buffer object (FBO) whose dimensions match those of the map view. For each filter activated, we then render the corresponding layer clipped to the shape of the vector objects that match this filter, along with the associated styling instructions. The resulting texture is then drawn on screen, clipped to the shape of the compositing region. Thus, the texture held in the FBO only needs to be recomputed when users pan and zoom the map view, or when one of the filters is modified.
Additional frame buffer objects are necessary when rendering translucent traces that help users keep track of their exploration path. More frame buffer objects are also necessary when rendering smooth blending effects between a compositing region and the surrounding area, as this requires
SCENECHARACTERISTICS
Number of entities 28 1153 3714
Number of points
Mean (Standard deviation) 597.8 (2027.0) 8.6 (6.8) 6.9 (4.6)
Min / Max 11 / 9713 5 / 89 5 / 77
Pixel area
Mean (Standard deviation) 9526 (32265.8) 16.8 (30.2) 3.6 (4.0) Min / Max 1.8 / 180567.3 0.32 / 369.81 0.2 / 72.3 PERFORMANCE
Creating CR (in ms) 16 230 915
Editing CR (in ms) 2 23 73
Moving CR (in fps) 170(∗) 170(∗) 170(∗)
(∗)Constant, depends on the GPU’s characteristics.
Table 2. MapMosaic performance with a compositing region (CR) whose scope is all lines in a 2260×1330 pixels scene.
Scene 1 Scene 2
SCENECHARACTERISTICS
Number of entities 506 1980
Number of points
Mean (Standard deviation) 7.4 (7.2) 10.7 (11.6)
Min / Max 2 / 52 2 / 154
Pixel length
Mean (Standard deviation) 16.2 (23.9) 20.0 (22.6)
Min / Max 0.45 / 249.16 0.42 / 295.18
PERFORMANCE
Creating CR (in ms) 69 620
Editing CR (in ms) 15 37
Moving CR (in fps) 170(∗) 170(∗)
(∗)Constant, depends on the GPU’s characteristics.
applying multiple gaussian blur effects to the region’s silhouette and using the resulting texture as alpha channel data for the fragment shader that draws the compositing region on screen.
In order to better evaluate the performance of our prototype implementation of MapMosaic’s dynamic compositing model, we ran five rendering tests on a MacBook Pro Retina equipped with an NVIDIA GeForce GT 750M 2048 MB graphics card. The dimensions of the OpenGL panel were set to 2260×1330 pixels on a 2560×1600 Apple Thunderbolt display (the remaining space accommodating Java Swing widgets such as toolbars, menus and inspectors). Tables 1 and 2 summarize our results, when compositing all polygons and all lines of a scene, respectively. These results show how the number of entities impacts the time required to create a compositing region and, to a lesser extent, to edit it. They also show that our approach, which as described above consists of pre-rendering in textures, ensures very high frame rates no matter the scene’s characteristics. Performance could be further improved by grouping objects in the same Vertex Buffer Object (VBO), instead of using a different VBO for each object.
6. Comparison with MAPublisher and QGIS
As mentioned earlier, some industrial-strength GIS front-ends also feature advanced graphics
Adobe IllustratorTM, a powerful, general-purpose vector graphics editor. MAPublisher enables users to import and filter geospatial data directly in the Illustrator workspace, thereby making it possible to use all of the underlying graphics layering, masking and compositing techniques of the editor. What differentiates MapMosaic from these pieces of software is its simpler and more flexible interaction model, backed by its dynamic visual compositing capabilities. In this section, we compare this interaction model with that of QGIS and MAPublisher:
• QGIS is representative of what GIS applications offer in terms of data editing, publishing and analysis features. On the graphics side, QGIS provides an editor to build attribute queries that select subsets of objects from vector layers. Some visual compositing operations can be achieved using clipping tools, that enable users to set a vector layer as a mask applied to another layer, either raster or vector.
• MAPublisher allows users to produce high-quality static cartographic renderings, providing them with all the power of Illustrator’s vector graphics editing features. MAPublisher aug-ments the toolset with tools typically found in raster-image-editing software. Beyond support for geospatial data importing, MAPublisher extends Illustrator with MAP Selections, to select objects on the canvas based on both spatial and styling attributes.
Our evaluation is based on an analytical comparison of the three interaction models above, when performing the generic actions involved in dynamic compositing detailed in Appendix A: creating compositing regions, moving them, and editing their parameters. This analytical com-parison serves as a basis for a more general comparative discussion based on the “cognitive
dimensions” framework from Green and Petre (1996). Originally designed as an evaluation
technique for visual programming languages, many of the dimensions defined in the framework actually bear strong relevance beyond this particular type of interactive environment. They have been used to evaluate a much wider range of user interfaces. The following subsections discuss subsets of related cognitive dimensions. Some dimensions of the framework are omitted, such as Diffuseness and Secondary notation, as they do not directly apply to our specific case.
6.1. Viscosity, Premature Commitment and Progressive Evaluation
These four dimensions relate to the flexibility of the system; in our case, how flexible is the cre-ation and editing of layer composites. Viscosity captures resistance to change, i.e., how much ef-fort has to be put into making small changes (number and complexity of the associated actions).
Premature Commitmentarises when a specific order is imposed on the sequence of actions to
accomplish a goal. Progressive evaluation represents the capability to evaluate an action in its intermediary steps, “allowing users to stop in the middle to check work so far” (Blackwell and Green 2003).
As detailed in Appendix A, both MAPublisher and QGIS enable users to achieve elaborate graphical renderings based on layer compositing. MAPublisher, through Illustrator’s capabili-ties, has even more expressive power than MapMosaic. But achieving such elaborate renderings involves interacting with numerous interface menus and dialog boxes. Most importantly, the equivalent of MapMosaic’s compositing regions cannot be moved or edited: a new clipping mask has to be created from scratch whenever the position or filter settings of a region change, resulting in a very high level of viscosity, and a very high level of premature commitment.
MapMosaic’s compositing regions aim at making spatial compositing more flexible. Com-positing regions can be moved by simple drag & drop. Filter settings and comCom-positing param-eters can be adjusted using a simple inspector. This significantly lowers viscosity, as illustrated on the tasks detailed in Appendix A, and enables progressive evaluation, as all changes are im-mediately reflected in the visual representation. The use of an inspector to edit the settings of
compositing regions also helps address the issue of premature commitment encountered in the interaction models of QGIS and MAPublisher. The latter two impose a strong order on the spec-ification of the different settings through dialog boxes, that do not provide much feedback until the specification is complete and the user clicks theOKbutton.
The second task in Appendix A illustrates the difference on a concrete example: restricting compositing to buildings higher than 10m only. With MapMosaic, the user first enables the BUILDINGSfilter, and then specifies a constraint on their height. Adjusting the minimum height
to, e.g., 20m, only requires editing this value in the query builder. Creating the same filter in QGIS takes more steps. The user first has to filter the BUILDINGS layer, then use the vector clipping tool, and finally the raster clipping tool. A detailed breakdown of all these steps is available in the appendix. Adjusting the minimum height to 20m requires performing all those steps again.
The interaction model of both QGIS and MAPublisher assumes that users have a well-defined end-result in mind, and that they are able to specify all compositing rules when creating the clipping mask, before actually applying it. This puts a heavy cognitive load on users, and re-quires much premature commitment. On the opposite, MapMosaic’s dynamic model features compositing regions that remain manipulable throughout their lifecycle, enabling better pro-gressive evaluation.
6.2. Abstraction, Role Expressiveness
Abstractionsare groupings of objects that should be treated as a single entity for a particular purpose. Role expressiveness indicates to what extent the purpose of an entity is readily inferred by users. All three systems considered here make use of abstractions to enable users to specify compositing operations, but the role of those abstractions is not always obvious.
The main abstraction in MapMosaic is the compositing region. All objects that fall in the region and meet the filtering criteria are treated (composited) in the same way. The primary role of the compositing region, as an abstraction, is to define the scope of the compositing, and its settings. Filters represent a secondary abstraction, tightly bound to the compositing regions, the latter remaining the main entities exposed to, and manipulated by, users.
MAPublisher relies on two rather separate abstractions. The first is a clipping mask, associ-ated with two layers, that defines the scope of the compositing at the level of pixels. Abstracting objects rather than pixels requires first creating MAP Selections (the second abstraction), and combining them to create the aforementioned clipping masks, as detailed in Appendix A. These clipping masks are neither associated with the layers they were applied to, nor with the geograph-ical position of objects they were derived from. They are generic vector objects that delineate regions. Clipping masks could thus be used for a variety of purposes, but whose specific role in the context of compositing operations is not straightforward to understand, especially consider-ing the lack of immediate visual feedback when relocatconsider-ing them on the map (discussed in the previous section).
Finally, QGIS relies on one essential abstraction: the layers themselves. Achieving the same operation as in the previous two cases requires creating a temporary layer holding the delin-eation of the region of interest, loading the layer containing the objects involved in the filter (e.g., “all buildings higher than 10m”), using the vector clipping tool to combine them, and then using the raster or vector clipping tool to achieve the actual layer compositing with the target layer. Compared to MAPublisher, relationships between abstractions are preserved in terms of geographical location. But, as a consequence, the region of interest defined in the temporary layer cannot be moved easily, and the dependency relationships between layers are lost. Again, the lack of immediate visual feedback and the lack of support for direct manipulation makes the
role of the different layers involved in the compositing process hard to understand.
6.3. Hard Mental Operations, Error proneness
Hard Mental Operationsimply that the system is putting a high demand on the user’s cognitive resources. Error proneness is about the extent to which the interaction model invites mistakes by design, and to what extent it provides protection against certain types of mistakes.
In MapMosaic, compositing regions are treated as first-class objects whose properties can be edited using an inspector. The incremental and reversible nature of the creation process, coupled with the immediate visual feedback provided during construction, helps decrease errors. Users immediately see the consequences of their actions, ranging from selecting specific layers for compositing to adjusting filter settings. As illustrated in Appendix A, the much smaller number of actions required to create a compositing region or modify it also helps reduce the difficulty of the associated mental operations, as the degree of premature commitment is lower.
Both MAPublisher and QGIS expose lower-level, more generic abstractions to users. This means, at least in the case of MAPublisher, that users are given more expressive power. But it also means that more actions are required to achieve the same result, mechanically making them more error prone, and that planning for those actions involves more complex mental operations. For instance, in QGIS, layers represent the main abstraction. Their number grows with the com-plexity of the compositing configuration. Additional layers are created when adding filters within the region. Users consequently have to label those layers and remember their purpose, so as to select the correct one for each step. This also creates potential confusion between layers that ac-tually hold content, and layers that exist solely for the purpose of compositing. In MAPublisher, compositing essentially relies on the underlying generic mechanism offered by Illustrator. The vector shapes that will be used for clipping must thus be instantiated in the layer that contains the raster or vector objects to be cropped, which can lead to mistakes. Similarly, applying a filter relies on the generic set operations performed on shapes provided by Illustrator, requiring users to create two MAP Selections, and to select them in the correct order so as to subtract one from the other as intended.
6.4. Visibility and Juxtaposability
Visibility refers to the system’s capacity to readily make components-of-interest visible in the workspace. Juxtaposability refers more specifically to the capability of putting components side-by-side, which eases tasks related to their comparison.
The settings of a compositing region in MapMosaic are made visible in one single place, the inspector. Compositing regions can be freely relocated, making it possible to juxtapose them. However, the content of free compositing regions updates automatically as the region is dragged by the user, thus preventing side-by-side comparison of distant regions that do not fit in the same viewport. Docked regions help alleviate this problem, but in the current interaction model those regions revert back to their original location as soon as they are released. The model could be extended to enable the temporary pinning of docked regions, which would enable the juxtaposition of more than two of them.
In QGIS and MAPublisher, compositing settings are made visible through other means, since the abstractions used to achieve compositing are different, as discussed above. In QGIS, users can toggle layer visibility to display the intermediate layers involved in the compositing process. MAP Selections, associated with clipping masks in MAPublisher, can be displayed by making them the active selection in the workspace. Modifying their parameters is typically achieved us-ing pop-up dialog boxes. The geometric shapes involved in compositus-ing (masks and selections)
can be moved at will, enabling the side-by-side comparison of multiple – possibly distant – re-gions. Indeed, the content of a mask gets rendered at the time it is created. It never gets updated afterwards, meaning that moving the shape that delineates it to other geographical coordinates will not change its content. As discussed earlier, this behaviour negatively affects progressive evaluation, and increases viscosity. But it also favors juxtaposability. A side-effect of this behav-ior, however, is that changes to the content that are performed after the mask has been created will not be visible in the region that was composited in the first place.
7. Experts’ feedback
Different articles have been promoting empirical research in the visualization community start-ing approximately ten years ago – see, e.g., (Carpendale 2008) and (Sedlmair et al. 2012) – and an increasing number of papers are now reporting on user experience or user performance evaluations (Lam et al. 2012). Formal testing sessions that involve basic tasks, while required to evaluate user performance, seldom yield meaningful results (Fuhrmann et al. 2005) when evaluating the usefulness of systems such as MapMosaic for performing complex tasks, both because of the open-ended nature of cartographic and geovisualization activities (Carpendale 2008), and because of the need for users to feel engaged with the data (Lloyd and Dykes 2011). User experienceevaluation, “eliciting subjective feedback and opinions [about a visualization system]”(Isenberg et al. 2013), is more relevant in this context. Some studies evaluate usability by asking users to perform specific tasks (Roth and Harrower 2008), possibly using tailor-made applications (Jones et al. 2009). However, we were interested not only in evaluating MapMosaic for certain tasks or usage scenarios (Sedlmair et al. 2012), but also in finding specific contexts in which it would be useful. We thus chose another method: organizing workshop sessions to col-lect feedback from experts, with the aim of “maximiz[ing] the realism of the findings” (Isenberg et al.2013). Participants were encouraged to talk about their specific activities and then engaged into discussions about how MapMosaic could be helpful in such contexts.
In the first session, we invited six operators from the Database Curation and Land Cover &
Usedepartments at IGN to give feedback on MapMosaic. None of them had participated in the
interviews reported in Section 3. In the second session, we met the researcher who works on environmental risk management, that we had already talked to during an interview session. Both workshop sessions were conducted in a meeting room at IGN. They started with the participants describing their daily tasks or research interests informally in about 10 minutes, followed by a 20-minute presentation of MapMosaic’s features by the authors. Participants were then invited to comment on MapMosaic and to describe in which scenarios it would be helpful. They all commented very positively on the directness of the interaction model. The capacity to provide immediate visual feedback when moving compositing regions and when adjusting their param-eters was also well received, suggesting that the principles that drove the design of MapMosaic, such as direct manipulation, reification, polymorphism and reuse, are indeed relevant in this context. In both sessions, we had rich discussions (∼2 hours each) about scenarios in which MapMosaic would be useful. This section summarizes these discussions.
7.1. Cartographic data maintenance
Operators found it particularly useful to be able to quickly switch back-and-forth between lay-ers by selecting a region on the map, compositing it with a different layer, and temporarily moving it to collect and correlate information from the different sources. For instance, Land Cover & Useoperators have to categorize forest areas as coniferous or deciduous based on
4-Figure 4. (a) Highlighting all buildings in a given geographical area using color compositing. (b) Dy-namically adjusting query parameters to highlight buildings taller than 10m only.
Figure 5. (a) Scanning ortho-imagery for new roads. (b) A compositing region with styling rules to preview the new road on the map.
band (RGB+infrared) orthoimagery. Some operators rely on the RGB rendering only, others on the RG-Infrared rendering only, and yet others switch between both. As discussed earlier, the best representation not only depends on an area’s actual content, but also on the work habits of individual users. Operators mentioned that MapMosaic’s local compositing capabilities make the customization of the visual representation easy and flexible.
Operators also saw great value in the display and dynamic update of query results in the map view. The user interface front-end they currently use (QGIS) displays query result-sets as textual lists, making it difficult to spatially relate items and to get feedback about the impact of query parameter adjustments. One of the operators described a case he was currently working on, that involves fixing 3D building models. The process is semi-automated. It relies on an algorithm that compares the current 3D model with elevation models, applying corrections to it when finding inconsistencies. Operators then perform a manual (one by one) check of all corrections considered too large, according to a given threshold (for instance: “altitude modified by more than 5 meters”). Getting a clear picture of the spatial relationships between similar corrections (according to such a threshold) would help operators diagnose possible common sources of errors. A typical common source mentioned by one of the operators was the use of a lower-precision distance sensor in one particular area, which would have been diagnosed more quickly, had he been able to visualize the candidate corrections spatially and interactively, as MapMosaic enables him to.
Operators also appreciated the persistence of spatial queries and the possibility to adjust at-tribute filters at any moment using the inspector. An operator from the Database Curation de-partment mentioned that people in his group have to set thresholds on several attribute values when starting to work in a new area. This enables them to better anticipate the amount of work, and set a reasonable level of precision for edits that is compatible with the time resources allo-cated to the project. Going back to the above example about correcting building data: operators might have initially set 1m as the minimum error length, and then increased it to 5m when
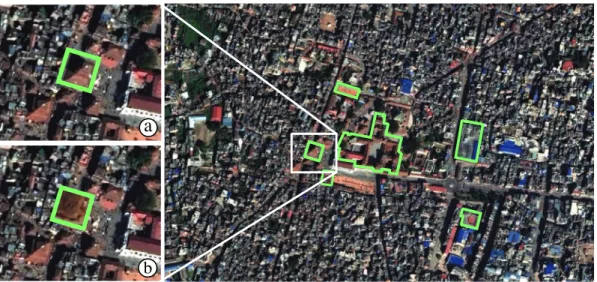
re-Figure 6. Nepal earthquake, 2015. Compositing vector objects to quickly identify buildings of interest and make a preliminary damage assessment. (a) Close-up on a building, showing imagery captured before the disaster. (b) Compositing post-event imagery inside these buildings only.
alizing that the initial value would have yielded too many buildings to check. Finding the right threshold is tedious with current tools, as operators have to create a new query each time they want to test a new value. Using MapMosaic’s query builder, they could easily edit the filters dynamically and immediately see the result in the map view (Figure 4). Another operator sug-gested creating multiple compositing regions configured with similar queries, differing only in their filter settings, and that would coexist in the same map view.
The Database Curation department is in charge of ensuring the completeness and timeliness of the main database. Operators work at the highest level of detail, and only get updates of the maps derived from their data every three months. They thus have to wait a long time before seeing the results of their modifications in the products made by the institute. An operator came up with the idea of using MapMosaic for “rapid symbolization”: following modifications made to the database, he would create a compositing region that approximately simulates the symbolization used for the considered type of object, and put this region over the corresponding area on the map to get a preview of the newly-added object. In Figure 5, an operator identifies a missing road, adds it to the database, and creates a compositing region on vector road elements, styling them to roughly match their actual map symbolization: black outline, solid orange fill as target layer, dilation by a few pixels.
7.2. Crisis Management
The presentation of MapMosaic led to a rich discussion with the researcher in risk management. He quickly came back to the usefulness of MapMosaic’s techniques for one of the activities discussed during the interview (Section 3): rapid mapping, which consists of creating maps in very short timeframes (between 6 hours and a day) to provide support to crisis management authorities. Such activities are performed by experts, as well as volunteers (Palen et al. 2015)
through Web sites such as Tomnod(http://www.tomnod.com).
Figure 6 illustrates our interviewee’s idea about how MapMosaic can help perform tasks such as rapid damage assessment. These tasks typically involve comparing satellite imagery captured before and after the event. While they provide valuable information, it can be hard to identify what areas have suffered significant damage. It can also take time to identify specific points of interest such as critical infrastructure just by looking at those images. MapMosaic can help focus
users’ attention on specific areas, first by compositing vector data with the satellite imagery to emphasize buildings of interest, and by restricting the compositing of before-and-after images to the interior of those vector objects. Applying some dilation to these compositing regions may help better assess the amplitude of the damage. Once categorized as, e.g., inaccessible or destroyed, buildings, roads or even entire areas, which have already been transformed into compositing regions, can be composited with the corresponding solid color to make them easily identifiable.
Similarly, MapMosaic could help users inspect the results of algorithmic techniques that per-form automatic classification on remote sensing imagery. Indeed, such inspection tasks often require moving back and forth between the layer holding the classification results, the layer holding the imagery on which the classification was performed, and possibly the layer holding imagery of higher spatial resolution for the considered area, that provides the ground truth.
The researcher in risk management also brought up a related use case. Images of the same area acquired from different satellites often suffer from distortion and parallax effects, which can be partially corrected through image registration. GIS front-ends let users register two images by identifying multiple locations in both rasters and then deriving the transformation from this set of matching pairs of points. The simplest interface juxtaposes both images and waits until users have input all matching locations before computing the transformation. But as the number of pairs required can be fairly high, depending on how complex the transformation is, some front-ends such as ArcGIS enable a more iterative process. They overlay the two images and dynamically adjust the transformation whenever the user inputs a new pair of points. This can be very useful, but it also makes interaction more cumbersome, as users have to frequently toggle between both image layers. In such situations, a compositing region could be displayed after the first point of a pair has been input to reveal the other layer in the vicinity of the cursor. It would let users scan for and select the matching point, and then disappear.
8. Summary and Future Work
MapMosaic defines a user interaction model based on the concept of dynamic compositing re-gions, that facilitate the spatial multiplexing of multiple map layers. Compositing regions can be moved freely on the map, and their parameters, including attribute filters, can be changed on the fly. Updates happen in real-time at interactive frame rates, providing users with immediate visual feedback and enabling them to explore the data using dynamic queries. This new model was well-received by a panel of GIS experts, who identified several concrete scenarios in which it would be useful.
Compared to existing editors, MapMosaic’s dynamic, local, and more interactive approach to visual compositing aims at better supporting users’ train of thought, and should be less cogni-tively demanding (Green and Petre 1996). Further user studies need to be conducted to verify this empirically. Beyond expert users, we believe that MapMosaic can be useful to a wider audi-ence, including lay users who want to design custom maps: marking an itinerary or making some entities or areas more salient using effects such as selective brightening or spotlight highlight-ing(Murphy 2015), which can all be achieved effortlessly with compositing regions. MapMosaic could also be useful for collaborative mapping (Fechner et al. 2015) to, e.g., inspect the history of objects, or the activity of collaborators by organizing changes into layers, per revision or per user.
Future work could focus on coupling compositing regions with recent focus+context tech-niques, including JellyLenses (Pindat et al. 2012), that dynamically adapt their shape to the geometry of the focused objects, and RouteLenses (Alvina et al. 2014), that make it easier to
follow paths. Another avenue for future work would be to investigate how vector tiling (Dufilie and Grinstein 2014) can make MapMosaic scale to very large data layers.
Acknowledgement(s)
This research was partly supported by ANR project MapMuxing (ANR-14-CE24-0011-02). We wish to thank the operators from IGN and the researchers who participated in our interviews and workshops. We also wish to thank Charlotte Hoarau, as well as Sidonie Christophe, Marion Dumont and Guillaume Touya from IGN, and Jean-Franc¸ois Girres from Universit´e Paul Val´ery Montpellier 3 for insightful discussions.