Contents lists available atScienceDirect
Catalysis Today
journal homepage:www.elsevier.com/locate/cattod
Aqueous phase reforming of pilot-scale Fischer-Tropsch water e
ffluent for
sustainable hydrogen production
Giulia Zoppi
a, Giuseppe Pipitone
a, Hannes Gruber
b,c, Gerald Weber
b, Alexander Reichhold
c,
Ra
ffaele Pirone
a, Samir Bensaid
a,*
aDepartment of Applied Science and Technology, Politecnico di Torino, Corso Duca degli Abruzzi 24, 10129, Turin, Italy bBEST– Bioenergy and Sustainable Technology GmbH, Mariahilfer Straße 51/1/15a, 1060, Vienna, Austria
cInstitute of Chemical, Environmental & Biological Engineering, TU Wien, Vienna, Austria, Getreidemarkt 9/166, 1060, Vienna, Austria
A R T I C L E I N F O
Keywords:
Aqueous phase reforming Aqueous by-product Biorefinery
Hydrogen production. Fischer-Tropsch product water
A B S T R A C T
Fischer-Tropsch (FT) synthesis produces an aqueous stream containing light oxygenates as major by-product. The low carbon concentration of the organics makes its thermal recovery unprofitable. Thus, novel processes are needed to utilize this waste carbon content. In this work, the aqueous phase reforming of the wastewater ob-tained from a 15 kWthFischer-Tropsch plant was explored as a promising process to produce hydrogen at mild temperatures. The FT product water wasfirstly characterized and afterward subjected to the reforming at dif-ferent reaction temperatures and time, using a platinum catalyst supported on activated carbon. It was observed that, besides activity, the selectivity towards hydrogen was favored at higher temperatures; equally, increasing the reaction time allowed to obtain the total conversion of most molecules found in the solution, without de-creasing the selectivity and reaching a plateau at 4 hours in the hydrogen productivity. In order to get more insights into the reaction mechanism and product distribution derived from the APR of FT product water, several tests were performed with single compounds,finding characteristic features. The importance of the position of the hydroxyl group in the molecule structure was highlighted, with secondary alcohols more prone to dehy-drogenation pathways compared to primary alcohols. Moreover, no interference among the substrates was re-ported despite the mixture is constituted by several molecules: in fact, the results obtained with the real FT product water were analogous to the linear combination of the single compound tests. Finally, the reuse of the catalyst showed no appreciable deactivation phenomena.
1. Introduction
The constant increase in energy needs and the consumption of fossil fuel lead to the necessity of developing new technologies to produce fuels and chemicals from renewable sources.
Nowadays, biomass can be converted into biofuels through several different processes [1]. Among the others, the biomass-to-liquid con-cept has driven the attention of the research. It can involve, in thefirst stage, the formation of a carbon monoxide/hydrogen gaseous mixture; after the purification of the outlet stream and the correction of the hydrogen/carbon monoxide ratio to adequate values, it can be con-verted in a Fischer-Tropsch (FT) reactor to produce hydrocarbons [2]. The hydrogenation of CO is a very old process andfirst insights were already published at the beginning of the 20thcentury [3–7]. The FT product contains mainly water, alkanes (1), alkenes (2) and to a minor extent oxygenates such as alcohols (3), carbonyl groups (aldehydes and
ketones, (4) and carboxylic acids (5) [8–11]. The mechanisms de-scribing the formation of these substance classes were discussed in further literature [8,11–15]. + + → + + n H n CO C H n H O (2 1) 2 n 2n 2 2 (1) + → + n H n CO C H n H O 2 2 n 2n 2 (2) + → + + − n H n CO C H O n H O 2 2 n 2n 2 ( 1) 2 (3) − + → + − n H n CO C H O n H O (2 1) 2 n 2n ( 1) 2 (4) − + → + − > n H n CO C H O n H O n (2 2) 2 n 2n 2 ( 2) 2 , ( 1) (5)
The desired product is the organic phase, which could be used to produce transportation fuels or basic chemicals [16–19].
Experiments performed at Güssing’s research center showed that on a mass basis more than half of the condensable FT product was water. It is polluted with short-chained organic oxygenates, with alcohols being
https://doi.org/10.1016/j.cattod.2020.04.024
Received 27 December 2019; Received in revised form 20 March 2020; Accepted 6 April 2020 ⁎Corresponding author.
E-mail address:samir.bensaid@polito.it(S. Bensaid).
the most prominent substance class.
The design of the product separation and applied temperatures le-vels affect the phase-preference of short organic oxygenates. From a process point of view, the amount of oxygen-containing products in-creases if i) the hydrogenation potential of the FT catalyst dein-creases, ii) the hydrogen partial pressure decreases or iii) temperature increases [19].
Literature suggests that organic oxygenates account for about 1 wt. % of the FT water produced by cobalt-based low-temperature Fischer-Tropsch (LTFT) [11,20].
The composition of the FT product water depends on operating conditions and catalyst type. The recovery of oxygenates from the product water is complex, especially when the oxygenate concentration is low. Therefore, if these compounds are not removed, the water has to be treated to minimize the environmental impact [21]. Purification of the acidic reaction water needs to be performed to permit its recycling within the FT facility or disposal.
Different approaches and technologies regarding wastewater treat-ment of FT product water were summarized by Miglio et al. [20]. One possibility is the physical separation through distillation steps, also involving extractive systems. However, this option is not cost-efficient due to the high dilution of the organics. Another option is exploiting the biological routes, producing methane thanks to the anaerobic digestion process.
Majone et al. investigated the anaerobic treatment of synthetic wastewater from an FT process at mesophilic conditions, obtaining up to 96% of COD removal and almost complete conversion to methane [22]. Wang et al. recently proposed the addition of magnetite to in-crease COD removal efficiency and methane production [23]. However, the performance of the process is sensitive to key parameters such as the pH of the solution or theflowrate of the feed, making the anaerobic digestion difficult to operate.
Aqueous phase reforming (APR) can be a suitable process to reduce the carbon content of FT product water, at the same time producing a gas phase rich in hydrogen.
The APR process was developed by Dumesic and coworkers [24]. In their pioneering works, they showed the possibility to convert oxyge-nated hydrocarbons at low temperature (below 300 °C) according to the reaction reported in equation 6 (strictly valid for carbohydrates). Op-erating at temperatures considerably lower than the ones of alkanes steam reforming brings two advantages: first, it has a lower energy demand, avoiding the cost of water vaporization (dealing with the pressurization of liquid water); second, it allows the production in one single reactor of a syngas with very low CO content, being the water gas shift reaction favorable in the same temperature range.
+ ↔ + +
C H On 2y n nH O2 nCO2 (y n H) 2 (6) Coronado et al. [25] studied the conversion of FT representative alcohols (methanol, ethanol, 1-propanol, and 2-propanol) with active-nickel based catalysts, proposing several reaction pathways looking at the product distribution. However, only single model compounds were tested in the cited work. Recently, the same research group reported the study of a kinetic modelling of a Fischer-Tropsch real water using a nickel-copper catalyst supported on ceria-zirconia [26].
Chen and co-workers suggested for thefirst time to use catalytic aqueous phase hydrodeoxygenation (APHDO) for converting FT aqu-eous effluent into fuel gas, using a Ru catalyst [27]. The same research group looked to the stability issues regarding the catalyst, proposing titania and zirconia as the most promising support due to their
hydrothermal stability [28]. Despite, the interesting results, a high consumption of hydrogen is necessary for the APHDO that is produced using fossil-based sources.
In the present work, we applied the aqueous phase reforming to process the real aqueous stream derived from the FT process with the purpose of both reducing the organic content of the water and produ-cing renewable hydrogen. The aqueous effluent derived from a pilot-scale FT plant was characterized and subjected to APR using a Pt/C reference catalyst. This catalyst formulation was chosen because it provides high performance in terms of activity, selectivity and stability for aqueous phase reforming of alcohols. Dedicated tests with presentative model compounds were performed to understand the re-sults obtained with the real phase.
The novel approach proposed in this work shows an alternative pathway to utilize the FT product water contaminated with light oxy-genates, at the same time increasing the carbon efficiency and produ-cing a valuable gas phase.
2. Materials and methods 2.1. Materials
Methanol, ethanol, 1-propanol, 2-propanol, butanol, and 2-butanol were purchased from Sigma Aldrich. Deionized water was obtained in laboratory thanks to an RO Cubic S2 system, whose purification system consists of low-pressure reverse osmosis and ion exchange resins. The water effluent from Fischer-Tropsch synthesis was provided by BEST GmbH. Developmental catalyst 5% Pt/C was provided by a commercial supplier. The Pt surface area was measured by H2pulse chemisorption
(details in paragraph 2.4) and was found to be approximately 20 m2/g. The catalyst was provided in powder form, of which 80% had a size < 106μm. The catalyst was used without any further pretreatment. 2.2. Fischer-Tropsch Laboratory unit
The 15 kWthlaboratory LTFT unit is fully automated and controlled
by a process control system (PLS). H2, CO, and N2(
˙
Vfresh gas) were mixedwith recycled tail gas. The compression stage compressed the gas to the desired operational pressure. Additionally, it was pre-heated to opera-tional temperature before entering the FT reactor. The conditioned synthesis gas was fed into the three-phase slurry bubble column reactor from the bottom. The catalyst used is cobalt-based. Practicable oper-ating conditions and important characteristics of the laboratory FT unit are shown inTable 1.
The space velocities (SV) were calculated according to equation 7, dividing the volume stream entering the reactor by the mass catalyst. The FT products and the not converted gaseous components exited the reactor at the top. The condensable products were separated from the gaseous phase through temperature reduction in a three-stage high-pressure condensation. The high molecular hydrocarbons were col-lected at 140-160 °C. The second and the third condensation stage were operated at 50 to 70 °C and 5 to 15 °C, respectively; here the FT reaction water was condensed. The volumeflow of the recycled tail gas (
˙
Vtail gas)was adjusted by the PLC to comply with the set tail gas recycling rate (TGR, equation 8). The hydrocarbon phase was split into a naphtha-, diesel- and wax phase.
Table 1
Practical operation conditions of the SBCR.
Operating pressure [barg] Operating temperature [°C] SV [Nm3/kg
cat∙h] TGR [%] VReactor[l] mCatalyst[kg]
=
˙ ˙
+SV V V
m
tail gas fresh gas
catalyst (7) = +
˙
˙ ˙
TGR V V V tail gastail gas fresh gas (8)
2.3. Aqueous phase reforming test
The APR reactions were performed in a 300 mL 4560 series mini benchtop reactor (Parr) equipped with a 4848 model reactor controller (Parr). The reactor was charged with 75 ml of the desired solution; 0.375 g of 5% Pt/C were used in each test performed in this work (except the tests carried out to assess the stability of the catalyst, where 100 mg were employed). Once fastened, the reactor was purged with nitrogen and pressurized at 0.3 MPa of N2. The absence of external mass
transfer limitation was assured increasing gradually the stirring. Having no difference in the activity and selectivity from 400 rpm, this value was chosen for the entire investigation. The absence of internal mass transfer limitations was confirmed by crushing the catalyst particles up to approximately 50μm. No variation was found in the activity and selectivity compared to the bigger particles; for this reason, the entire investigation was carried out with the particles provided, without fur-ther treatments.
Reaction time and temperature were varied to study their influence. At the end of the reaction, the reactor was cooled down thanks to an internal cooling loop and external water bath.
The gas phase was collected in a syringe and analyzed byμGC. The liquid phase wasfiltered by gravity to recover the catalyst and then analyzed through TOC and HPLC analysis. The spent catalyst was dried in an oven overnight (105 °C) and weighted afterward. When reuse tests were performed, the catalyst was used as such, without any further treatment.
2.4. Analytical methods
The characterization of FT aqueous products has been performed using a Perkin Elmer AutosystemXL gas chromatograph coupled with a Perkin Elmer Turbomass mass spectrometer. A 60 m Supelco Nukol capillary column, with an inner diameter of 0.25 mm and a film thickness of 0.25μm, was used to separate the different substance classes. The injection temperature was fixed at 200 °C, the injection volume was 0.5μL, while the split ratio was 150:1. Helium was used as carrier, with 1,2 mL/min constantflow. The temperature program was set as follows: hold 50 °C for 10 min, 4 K/min to 200 °C, hold 200 °C for 2.5 min. The temperature transfer line, temperature ion source, and mass spectrometer were set at 200 °C. The qualitative analysis was performed in full Scan 29– 200 amu, with scan period of 0.5 sec and Single Ion Recording (SIR) for water.
The characterization of APR products focused on both gas and liquid phases.
The gas phase was analyzed by an SRA Micro-GC, equipped with Molsieve 5A (argon as carrier) and PoraPLOT U columns (helium as carrier), with a TCD detector.
The quantification of the gaseous products has been performed using the initial moles of nitrogen as an internal standard. In fact, considering that nitrogen does not participate in the reaction, the moles of gaseous products can be derived knowing the molar fraction of ni-trogen in thefinal mixture (by Micro-GC analysis).
HPLC analysis (Shimadzu), with 5 mM H2SO4in water as mobile
phase and Rezex ROA-Organic acid H+ (8%) column (300 mm ·
7.8 mm), was performed to study the liquid composition. The quanti-fication of the products was determined through a refractive index detector (RID), using an external standard calibration.
Total organic carbon (TOC) analysis was performed using a
Shimadzu TOC-VCSHanalyzer equipped with a nondispersive infrared
detector. Carbon balance closure was reached within 90 ± 5%. The experimental results were reproducible with a maximum 5% error.
Temperature-programmed reduction (TPR) was carried out using a TPDRO-1100 equipment (Thermo Scientific). The sample (approxi-mately 100 mg) was heated at 5 K/min in a 20 mL/minflow of 5% H2/
Ar from 323 K to 1073 K. The TPR profile did not show any peak as-sociated with Pt reduction, confirming the metallic state of the sample and the possibility to use it without any pretreatment.
The platinum dispersion was evaluated by H2pulse chemisorption
using the same equipment. The sample (100 mg) was priorly heated from room temperature to 323 K at 10 K/min in He, dwelling for 30 min; afterward, H2wasflushed (20 mL/min) heating to 523 K at 5 K/
min, dwelling for 2 hours; maintaining the same temperature, He was used again for 1 h. After cooling down, the catalyst was titrated by H2
pulses, assuming an adsorption stoichiometry 1:1 for Pt:H.
The performance of the reaction was estimated using four para-meters conventionally used in the APR literature:
•
the carbon to gas conversion, defined as the ratio between the moles of carbon in the gas product molfinCgasand the moles of carbon in thefeed molinCfeedstock(eq.9);
•
the H2gas distribution, defined as the ratio between the moles ofhydrogen present in the gas phase as molecular hydrogen (molfinH2)
after the reaction and the moles of total hydrogen present in the final gas phase (that is, also as alkanes) (eq.10);
•
the H2productivity is defined as the moles of hydrogen producedmmolfinH2divided by the moles of carbon in the feed molinCfeedstock
(eq. 11). This parameter is useful especially for the FT product water, where the complex composition does not allow to use para-meters involving the classical reaction stoichiometry;
•
the conversion of the substrate, defined as the ratio between the number of moles reacted (molini– molfini) and the number of molesin the feed (molini) (eq. 12).
=
Carbon to gas (%) 100· mol C mol C
fin gas
in feedstock (9)
=
+ + +
H gas distribution (%) mol H
mol (H 2·CH 3·C H 4·C H ) 2 fin 2 fin 2 4 2 6 3 8 (10) = H productivity mmol H mol C 2 fin 2 in feedstock (11) = −
Conversion (%) 100 ·mol i mol i mol i
in fin
in (12)
3. Results and discussion
3.1. Characterization of the FT product water
InFig. 1the HPLC chromatogram of the FT product water is re-ported, together with the main information on its composition sum-marized in the table on the right (please note that only the compounds with weight concentration higher than 0.01% were reported). As re-ported in the introduction, the wastewater of the Fischer Tropsch pro-cess is typically constituted by alcohols and carboxylic acids. Alcohol formation may be due to parallel reactions that involve the insertion of carbon monoxide into a methylene- or methyl-metal bond [29]. As a matter of fact, the main compounds observed in the examined water fraction are low molecular weight primary alcohols C1-C4 such as methanol, ethanol, propanol, and butanol, together with their corre-sponding carboxylic acids. Secondary alcohols such as 2-propanol are present to a minor extent.
The quantification of these compounds is reported in the displayed table. The total organic content is around 4700 mg C/L. The HPLC
quantification accounted for 95% of the total carbon content. The use of GC-MS (not shown results) allowed to increase the range of identified compounds up to C6 alcohols and corresponding carboxylic acids. The main inorganic species identified and quantified by ICP-MS are calcium, sodium, and potassium.
3.2. Aqueous phase reforming of FT product water 3.2.1. Influence of reaction temperature
In this section, the influence of reaction temperature applied in APR
of Fischer-Tropsch product water is discussed.
InFig. 2-A the gas performance indicators of APR are reported at different temperatures in the range between 230-270 °C. It can be ob-served that each of the three indicators has been positively influenced by the increase of the reaction temperature. The carbon to gas increased from 40% to more than 60%, due to the more favorable C-C bond breaking with enhanced reaction temperature. Moreover, the hydrogen gas distribution was affected by the higher temperature. This is an important point, as it implies that the desired reactions (i.e. breaking of the C-C bonds and water gas shift) are more favored compared to Fig. 1. On the left, HPLC chromatograms of the Fischer-Tropsch product water (1: acetic acid 2: propionic acid 3: methanol 4: ethanol 5: butanoic acid 6: 2-propanol 7:1-propanol 8: butanol); on the right, quantification of the main organic and inorganic compounds.
Fig. 2. Influence of the reaction temperature on the APR of FT product water. A: gas performance indicators; B:HPLC chromatograms of the feed and products (1: acetic acid 2: propionic acid 3: methanol 4: ethanol 5: butanoic acid 6: 2-propanol 7:1-propanol 8: butanol), together with COD data; C: conversion of the main molecules present in the feed. Reaction conditions: 0.375 g Pt/C catalyst, 75 mL FT product water, 2 hours reaction time.
undesired reactions (such as methanation) with the increase of the temperature. The combination of the higher carbon conversion and H2
gas distribution led to higher hydrogen productivity, that is a major finding when complex mixtures are tested.
The HPLC chromatograms reported inFig. 2-B compare the feed with the liquid products obtained after APR at different temperatures. Firstly, it is important to observe that minor differences are present in the liquid phase composition among the investigated range of tem-peratures. At 230 °C, most of the alcoholic compounds converted, with only methanol showing a lower conversion and a higher dependency on the reaction temperature (Fig. 2-C). Its conversion stopped at 40% at 230 °C, while the conversion of ethanol and 1-propanol reached 85% and 92%, respectively. The reason for the observed behavior may be ascribed to slight competitive issues in the mixture with the other molecules, reducing its reactivity. Shabaker et al. reported that the order of reaction of methanol reforming is higher than ethylene glycol on Pt because of the weaker adsorption of the former on the metal sites compared to the latter adsorbed in a bidentate mode [30]. Being ethanol adsorption mode similar to the one of ethylene glycol, it can be assumed that its higher reactivity can be explained by analogous rea-sonings [31].
Looking at the comparison between primary alcohols at equal temperature, it is observed that there is an increase in the activity with the increase of the chain length, and the difference is more visible at low temperatures (230-250 °C).
Alcohols are known to be highly reactive to produce hydrogen via APR [32]. On the contrary, carboxylic acids remained almost entirely in the liquid phase. The concentration of acetic acid increased, moving from 630 to 730 ppm; this is the reason why an apparent negative
conversion is reported inFig. 2-C. Acetic acid can follow two different routes. It can be converted by reforming, leading to methane and carbon dioxide [33]; at the same time, it can be produced by primary alcohol (mainly ethanol) reforming, as reported in paragraph 3.2.3. During APR of ethanol, acetic acid was the only observed liquid by-product. As detailed later, ethanol may befirstly dehydrogenated to acetaldehyde, which in turn can lead to acetic acid via Cannizzaro/ Tishchenko-like reactions. Moreover, acetic acid can suffer from com-petitive adsorption when it is in mixture with alcohols. In our previous work with a platinum-based catalyst supported in alumina, we reported that in the case of a binary mixture of ethanol/acetic acid, the con-version of the latter was negligible [34]. Therefore, due to the re-calcitrance of the carboxylic acid when present in a mixture, in the current conditions its concentration globally increased. This is a major finding that was not reported yet in literature for the valorization of FT effluent because it was conventionally modeled only by alcohols. In-terestingly, propionic acid’s conversion showed a decreasing trend with temperature. Analogously with acetic acid, it can convert mainly pro-ducing ethane and carbon dioxide [33]; at the same time, it can be produced by 1-propanol reforming, as reported later. It is likely that in this case, due to the lower concentration of 1-propanol compared to ethanol, less propionic acid is obtained, globally leading to a positive conversion.
Finally, it is interesting to observe that the reforming of the product water considerably decreased the COD (chemical oxygen demand) of the stream as showed in the table enclosed inFig. 2-B. Indeed, it was reduced by more than 80% at 230 °C and up to 90% at 270 °C. These results are comparable to the ones obtained by Majone et al. using a packed bed biofilm reactor to decrease the organic content of a Fig. 3. Influence of reaction time on the APR of the FT product water. A: gas performance indicators; B: conversion of the main alcohols in the feed; C: evolution of the liquid species; D: evolution of the gaseous species and H2/CO2ratio. Reaction conditions: 0.375 g Pt/C catalyst, 75 mL FT product water, 270 °C reaction temperature.
synthetic FT product water [22]. 3.2.2. Influence of reaction time
The obtained results showed that two hours are not enough time to convert a sufficient amount of organic oxygenates and reduce the COD down to legislative wastewater regulations, being methanol and car-boxylic acids still present in the liquid APR product. In order to assess if more time could lead to a higher conversion of the organic alcohols and increase the hydrogen production, the influence of reaction time on the performance indicators was studied.
Fig. 3-A shows the progression of the main gas performance in-dicators at the different reaction time investigated. Please note that the point at 0 hours indicates the achievement of the operating temperature (270 °C), that is the starting point for the reaction time. For this reason, the evolution of the molecules in the liquid and gaseous phase (Fig. 3C/ D) originates at“-1”, taking into account the time necessary to heat the solution to 270 °C.
The three indicators constantly raised until two hours, whereas in-creasing the reaction time up to 4 hours did not improve appreciably the performance. Similarly, with the temperature increase, both the carbon to gas conversion and the H2 gas distribution increased,
in-dicating that the FT product water did not suffer from series-selectivity issues in the current reaction conditions.
In the liquid phase, each of the alcohols started to react to a high extent already during the heating time of the reactor (0 h), as reported in Fig. 3-B. From this point on, methanol was almost the only com-pound present in the liquid phase (Fig. 3-C). Methanol conversion rate was approximately 5.2 mmol/h, while ethanol conversion rate was about 4.3 mmol/h; however, methanol’s concentration in the FT water is almost double than the ethanol’s concentration. Therefore, it was reasonable to expect a higher difference between the two conversion rates. This outcome, consistent with the results reported in the previous paragraph, may suggest that methanol suffer from competitive ad-sorption with the other alcohols (mainly ethanol in the current case), reducing its consumption rate.
The hydrogen production constantly increased over time (Fig. 3-D); at 0 hour, 17 millimoles of hydrogen were produced, which increased up to 31 at 4 hours; it can be motivated by an almost complete con-version of 1-propanol and ethanol at this time. Indeed, as we reported in the previous paragraph, ethanol and 1-propanol reached a high conversion already at 230 °C. On the other hand, methanol, having a slower conversion over time, can cause an increase of hydrogen and CO2observed during longer reaction time. In fact, the H2/CO2ratio
tends to be close to 3, which is the theoretical H2/CO2ratio for
me-thanol APR (equation 13). Looking at methane and ethane, their pro-duction reached its plateau already at 0 hour; as reported in the fol-lowing paragraph, methane is produced by the conversion of ethanol and ethane by the conversion of 1-propanol; indeed, they both con-verted already at 0 hour and, for this reason, their presence does not increase after that point.
3.2.3. Aqueous phase reforming of single compounds
The complexity of the FT product water does not allow us to get qualitative information on the reactions that lead to the observed product distribution. To get deeper into these outcomes, in this section the results obtained from the APR of the main compounds present in the FT product water are discussed.
APR tests of methanol, ethanol, 1-propanol, 2-propanol, 1-butanol, and 2-butanol at 0.9 wt. % of carbon were carried out at the optimal reaction conditions identified for the real mixture (5% Pt/C catalyst, 270 °C, 2 hours).
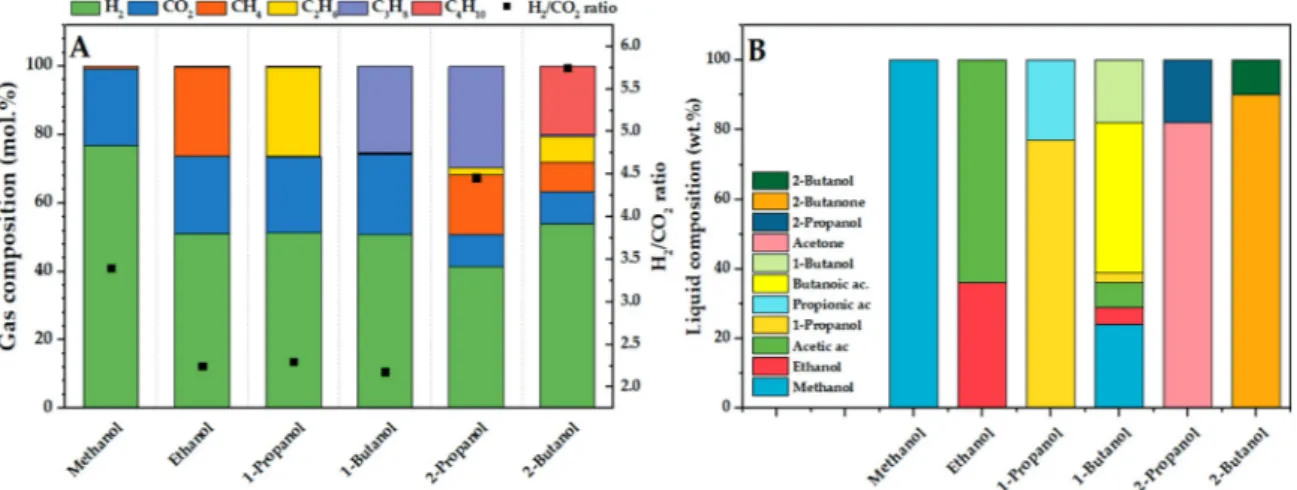
InFig. 4-A the gas composition obtained from the APR of single-compound solutions is reported.
Methanol follows the conventional aqueous phase reforming stoi-chiometry. In fact, the reforming ratio (i.e. the ratio between moles of hydrogen and carbon dioxide), calculated from the gas composition
reported inFig. 4, is 3.5 and it is close to the theoretical value (i.e. 3) derived from eq. 13. The higher ratio can be explained by the con-tribution of hydrogen-producing reactions (dehydrogenation), com-monly considered thefirst step of the APR reaction mechanism, not leading to the contemporary production of a mole of carbon dioxide (such in the case of water gas shift reaction).
C:OH = 1:1 CH3OH + H2O→ CO2+3H2 (13)
Looking at the gas composition obtained from the APR of C2-C4 primary alcohols, it is highlighted that, despite the difference, the gas composition can be considered analogous. Indeed, the APR of primary alcohols is accompanied by a gas composition with 2:1:1 ratio in hy-drogen: carbon dioxide: methane (or ethane, or propane) from ethanol (or 1-propanol, or 1-butanol).
Looking at the liquid conversion of the primary alcohols, no main differences were found between the tests and they converted almost completely (Fig. 4-B). The corresponding aldehydes, largely reported in the literature as thefirst reaction intermediates of APR, were not ob-served in the liquid phase. This difference should not be ascribed to a change in the reaction mechanism. It can be due to the high reactivity of both reactants and intermediates, together with the high conversion reached in this work compared to some of the commonly reported low conversions in other researches [35]; moreover, due to the high vola-tility of the aldehydes, they can be lost during thefiltration step.
The liquid phase derived from methanol APR was constituted only by the unconverted molecule (Fig. 4-B). On the other hand, the C2-C4 primary alcohols produced the homologous carboxylic acid as the main by-product. This is likely due to a Cannizzaro or Tishchenko reactions, as suggested by Lobo et al. [36]. Therefore, it is supposed that the al-dehyde formed during the dehydrogenation of the primary alcohol may lead to the corresponding carboxylic acid via condensation of two al-dehydes, followed by hydrolysis.
In our previous work with Pt/Al2O3,it was reported a similar
be-havior of primary alcohols in the range 230-270 °C [34]. Lobo et al. carried out the APR of 1-propanol on platinum supported on several materials (alumina, titania, ceria),finding different activities among the catalytic systems, but similar selectivity in the product distribution [36]. These results suggest that the support does not play a role in determining the gas product distribution of primary alcohols APR.
Coronado and co-workers reported results with a Ni-based catalysts on APR of methanol, ethanol, and 1-propanol [25]. Regardless of the composition of the catalyst (undoped or doped with Cu/Ce), the molar fraction of hydrogen in the APR of ethanol and 1-propanol was higher than 50% as it was in the present work, ranging from 63% to 85%. Several reasons may justify this difference. It should be excluded that the higher concentration of hydrogen is due to more favorable WGS, as it was reported the presence of CO with the use of Ni catalysts, while it was not detected in the current work; it can be suggested that Pt is more prone to activate the decarbonylation of the aldehyde (Fig. 5-A, with the APR scheme of 1-butanol for the sake of representativeness), leading to a higher production of gaseous products. This hypothesis would explain also the difference regarding the composition of the li-quid phase. In fact, we observed no other lili-quid products apart from the unconverted alcohol and the corresponding carboxylic acid; on the other hand, the use of a Ni catalyst led only to the corresponding al-dehyde as liquid product [25].
Comparing in a rigorous way the two results is complex due to the different reaction conditions (starting from the use of a batch and a continuous reactor). However, having reported that the APR selectivity of primary alcohols is quite insensitive to different reaction temperature and concentration of the feedstock, we may ascribe the reported dif-ferences to the nature of the active site.
Most of the literature highlights the importance of the C:O ratio for aqueous phase reforming [32]. However, as already mentioned by Godina et al., only one carbon can be removed as CO in molecules
where only one OH group is present [37]. Afterward, it can react with water through WGS reaction producing H2and CO2. As reported in [34]
for the linear alcohols with only one OH, the real reaction path in the APR reaction using a platinum catalyst are the following (eq.14–16) C:OH = 2:1 C2H5OH + H2O→ 2H2+ CH4+ CO2 (14)
C:OH = 3:1 C3H7OH + H2O→ 2H2+ C2H6+ CO2 (15)
C:OH = 4:1 C4H9OH + H2O→ 2H2+ C3H8+ CO2 (16)
On the other hand, secondary alcohols such as propanol and 2-butanol showed a completely different reaction path. As reported in Fig. 4-A, two main differences can be highlighted in the gas phase. The first one regards the hydrogen/carbon dioxide ratio, equal to 4.5 from 2-propanol and 5.7 from 2-butanol. The second one regards the
presence of the corresponding alkane, i.e. 28% of propane from 2-propanol and 20% of butane from 2-butanol. The much higher ratio between hydrogen and carbon dioxide than the one proposed by the APR, together with the presence of alkanes with the same number of carbon atoms, let us suppose that other mechanisms are involved in the hydrogen production, without water gas shift and C-C bond breaking. The difference in the gas composition between primary and secondary alcohols is reflected also in the liquid composition (Fig. 4-B), where acetone from 2-propanol APR and 2-butanone from 2-butanol APR were found as only liquid products.
From this information on the gas and liquid phase, it can be pro-posed that the main reaction in which the secondary alcohols are in-volved is the dehydrogenation (Fig. 5-B). The presence of butane sug-gests that also hydrogenation reactions are involved in the mechanism. Furthermore, smaller alkanes are present in the gas phase, such as Fig. 4. Influence of the feed on the gas (A) and liquid (B) composition. Reaction conditions: 0.375 g Pt/C catalyst, 75 mL solution 0.9 wt.% C, 270 °C reaction temperature, 2 hours reaction time.
ethane and methane. We propose that one hydrogen molecule is in-volved in the cleavage of the C-C bond, leading to the formation of one molecule of methane and one mole of the linear alcohol (1-propanol in the case of 2-butanol APR). At this point, the latter can react giving the already known products, that are hydrogen, carbon dioxide and ethane. The suggested mechanism is confirmed by the relative composition of the gas phase, where a 1:1:1 ratio is reported between methane, carbon dioxide, and ethane. Even if not reported in thefigure, an analogous pathway can be suggested for 2-propanol, where is coherently observed a 2:1 ratio between methane and carbon dioxide (in this case, ethanol is the intermediate primary alcohol that is consumed).
The reported results underline not only the importance of the C:OH ratio but also the effect of the position of the hydroxyl group. To the best of our knowledge, it has been reported here for thefirst time for 2-butanol, allowing to confirm the peculiar behavior of secondary alco-hols reported by us and other authors in previous works [25,34].
To summarize the differences between primary and secondary al-cohols, the followingTable 2depicts the main products (liquid and gas) observed from their APR.
Based on the APR of the single compounds and the conversion of FT product water, it is possible to address the contribution of each com-ponent of the liquid phase to determine possible interferences among the reactions that involve each alcohol (Table 3). For the sake of comparison, the gas products obtained during the APR of FT water fraction at 270 °C and 2 h reaction time was reported.
The linear combination of the single reactions, was calculated with the following equation 17 for each gas:
= + + − + −
nH2 nH methanol2 nH ethanol2 nH21 propanol nH21 butanol (17)
where = ⋅ n n SCT n SCT n FT H methanol H methanol conv methanol conv methanol 2 2
nH2is the number of moles of hydrogen reported inTable 3in the
row named“Total”. The same can be written for CO2, CH4, etc. They are
calculated summing the moles of H2produced by each alcohol during
the corresponding test (e.g., if methanol is taken as an example,
nH methanol2 refers to the moles of hydrogen produced during the APR of
methanol). However, the amount of each alcohol used during the single-compound test (SCT) is different from its amount present in the FT water. Therefore, if we assume that the moles of product
i e n SCT
( . . H methanol2 )per mole of alcohol reacted i e n( . . conv methanolSCT)
remain constant between the single-compound test and the FT test (i.e. the selectivity remains constant), we can obtain the“ideal” contribution
of each compound multiplying this ratio by the moles of alcohols re-acted during the FT test i e n( . . conv methanolFT)to obtain thefinal value. The same expression detailed for methanol was applied individually to the other alcohols.
As it can be observed, the product distribution in the case of the FT water APR is consistent with the summation of the results obtained in the case of single-compound APR.
Thank to this outcome, we may assume that no major cross-inter-ferences occur among alcohols. This result is in line with previous outcomes reported with a mixture of polyols [38].
3.2.4. Catalyst stability
To assess the feasibility of the exploitation of the FT product water a test in which the catalyst was reused at 270 °C was performed.
The tests were performed using 100 mg of catalyst to reduce the conversion of the reactants and detect possible catalyst deactivation. After the first use, the catalyst was recovered and dried in the oven overnight at 105 °C. InFig. 6the conversion of the main compounds is reported at each test, together with the hydrogen productivity. The plot highlights that no deactivation occurred during the three tests. More-over, a slight increase of the hydrogen productivity was reported due to the increase of the selectivity. This result may be coherent with the outcome reported by Lehnert et al., who showed that higher particle size led to similar glycerol conversion but higher hydrogen selectivity [39]. We may assume that during the current reaction conditions, our catalyst suffers from slight sintering phenomena, as reported with platinum-based catalysts used in previous works [40]. In our previous works, we saw a quick deactivation of the catalyst with real feedstocks [33,38]. It is noteworthy that the Fischer-Tropsch water fraction may be an ideal feedstock for APR valorization. Indeed, it was reported that the hydrolysate derived from a commercial bioethanol plant can Table 2
Main products of APR of alcohols.
H2 CO2 Alkanes Ketones Carboxylic acids
MeOH X X no no no
EtOH X X CH4 no Acetic acid
1-PropOH X X C2H6 no Propionic acid
1-ButOH X X C3H8 no Butanoic acid
2-PropOH X X C3H8, CH4 Acetone no
2-ButOH X X C4H10, C2H6 2-Butanone no
Table 3
Linear combination of single model compound in comparison with FT water fraction results.
Test H2(mmoles) CO2(mmoles) CH4(mmoles) C2H6(mmoles) C3H8(mmoles)
FT- 270 °C 2h 29.0 10.4 4.1 0.9 0.5 Methanol 23.6 7.2 0 0 0 Ethanol 7.1 3.1 3.3 0 0 1-Propanol 0.9 0.4 0 0.4 0 1-Butanol 0.8 0.4 0 0 0.4 Total 32.4 11.1 3.3 0.4 0.4
Fig. 6. Influence of catalyst re-use on the APR performance of FT product water. Reaction conditions: 0.1 g Pt/C, 75 mL FT product water, 270 °C reaction temperature, 2 hours reaction time.
deactivate the catalyst because of the formation of solid deposits (hu-mins) derived from homogeneous reactions of the sugars [38]. More-over, the aqueous stream derived from lignin-rich hydrothermal li-quefaction can lead to catalyst deactivation due to polymerization reactions involving the phenolics present in the solution [33]. There-fore, due to the absence of unstable compounds in the solution (like sugars or phenolics), the FT water fraction may not constitute a chal-lenging feed to be valorized via APR, from the point of view of the catalyst stability. Further research with a continuous reactor is sug-gested to better evaluate this phenomenon.
4. Conclusion
The water fraction produced by Fischer-Tropsch synthesis has been investigated for its valorization via aqueous phase reforming. The in-fluence of reaction temperature and time on the performance of the process was investigated, using a reference platinum-based catalyst. The increase of temperature affected both the activity and the se-lectivity of the catalyst, increasing the hydrogen production. The COD of the mixture was reduced up to 90% of the original one, working at 270 °C and in 2 hours. Representative model compounds have been tested in similar conditions to understand the phenomena involved in the APR of the real mixture. Methanol reached the complete conversion after 4 hours, while higher alcohols converted at shorter reaction time. Despite the complexity of the mixture, neither interference between the molecules nor deactivation phenomena were observed in the aqueous phase reforming. The difference in the product distribution for primary and secondary alcohols reforming pointed out the importance of the position of the hydroxyl group in the molecule and helped to propose a general reaction mechanism for the studied substrates.
Declaration of Competing Interest
The authors declare that they have no known competingfinancial interests or personal relationships that could have appeared to in flu-ence the work reported in this paper.
CRediT authorship contribution statement
Giulia Zoppi: Writing - original draft, Writing - review & editing, Investigation, Conceptualization.Giuseppe Pipitone: Writing - review & editing, Investigation, Conceptualization.Hannes Gruber: Writing -original draft, Investigation, Conceptualization.Gerald Weber: Writing - original draft, Supervision, Conceptualization.Alexander Reichhold: Supervision, Conceptualization. Raffaele Pirone: Supervision, Conceptualization. Samir Bensaid: Writing - review & editing, Supervision, Project administration, Conceptualization.
Acknowledgment
The project leading to this research has received funding from the European Union's Horizon 2020 research and innovation program under grant agreement No 764675.
References
[1] A. Demirbaş, Energy Convers. Manag. 42 (2001) 1357–1378.
[2] M. Stöcker, Angew. Chemie - Int. Ed. 47 (2008) 9200–9211.
[3] P. Sabatier, J.B. Senderens, C.R. Hebd, Seances Acad. Sci. 134 (1902) 514–516. [4] F. Fischer, H. Tropsch, Brennstoff-Chemie 5 (1924) 201–208.
[5] F. Fischer, H. Tropsch, Brennstoff-Chemie 4 (1923) 276–285. [6] F. Fischer, Brennstoff-Chemie 6 (1925) 234–235.
[7] F. Fischer, H. Tropsch, Patent Deutsches Reich - Verfahren zur Gewinnung mehr-gliedriger Parffinkohlenwasserstoffe aus Kohlenoxyden und Wasserstoff auf kata-lytischem Wege, (1925).
[8] A. de Klerk, Chapter 4 - Fischer–Tropsch Synthesis, Fischer–Tropsch Refin, Wiley-VCH Verlag & Co, KGaA, 2011, pp. 73–104.
[9] A.K. Dalai, B.H. Davis, Appl. Catal. A Gen. 348 (2008) 1–15. [10] A.J.V. Underwood, Ind. Eng. Chem. 32 (1940) 449–454.
[11] M.E. Dry, Chapter 3 - Chemical concepts used for engineering purposes, in: A. Steynberg, M.E. Dry (Eds.), Fischer-Tropsch Technol, Elsevier Science & Technology Books, 2004, pp. 196–258.
[12] A.W. Weitkamp, C.G. Frye, Ind. Eng. Chem. 45 (1953) 363–367. [13] V. Subramanian, K. Cheng, Y. Wang, Fundamentally Understanding
Fischer–Tropsch Synthesis, in: K. Wandelt (Ed.), Encycl. Interfacial Chem. - Surf. Sci. Electrochem, Elsevier, 2018, pp. 107–114.
[14] R.B. Anderson, J.F. Schulz, L.J.E. Hofer, H.H. Storch, Univ. North Texas Libr. Digit. Libr. Https//Digital.Library.Unt.Edu; Credit. UNT Libr. Gov. Doc. Dep, (2020) (n.d.).
[15] D. Chakrabarti, V. Prasad, A. de Klerk, Chapter 11 - Mechanism of the Fischer-Tropsch Process, in: B.H. Davis, M.L. Occelli (Eds.), Fischer-Fischer-Tropsch Synth. Catal. Catal. Adv. Appl., 1st Editio, CRC Press, 2016, pp. 183–222.
[16] A. Lappas, E. Heracleous, Chapter 18 - Production of biofuels via Fischer-Tropsch synthesis: biomass-to-liquids, in: R. Luque, C. Lin, K. Wilson, J. Clark (Eds.), Handb. Biofuels Prod. - Process. Technol, 2nd Editio, Elsevier Ltd, 2016, pp. 549–593. [17] S. Blakey, L. Rye, C.W. Wilson, Proc. Combust. Inst. 33 (2011) 2863–2885. [18] S. Yang, S. Lee, K.-Y, S.C. Kang, S.J. Han, K.-W. Jun, K.-Y. Lee, Y.T. Kim, RSC Adv 9
(2019) 14176–14187.
[19] A. de Klerk, P.M. Maitlis, Chapter 4 - What Can We Do with Fischer–Tropsch Products? in: P.M. Maitlis, A. de Klerk (Eds.), Greener Fischer-Tropsch Process. Fuels Feed. Wiley-VCH Verlag & Co, KGaA, 2013, pp. 81–106.
[20] R. Miglio, R. Zennaro, A. de Klerk, Chapter 15: Environmental Sustainability, in: P.M. Maitlis, A. de Klerk (Eds.), Greener Fischer-Tropsch Process, Fuels Feed., Wiley-VCH Verlag & Co., KGaA, 2013, pp. 311–336.
[21] R.J.J. Nel, A. De Klerk, Ind. Eng. Chem. Res. 46 (2007) 3558–3565.
[22] M. Majone, F. Aulenta, D. Dionisi, E.N. D’Addario, R. Sbardellati, D. Bolzonella, M. Beccari, Water Res 44 (2010) 2745–2752.
[23] D. Wang, Y. Han, H. Han, K. Li, C. Xu, H. Zhuang, Bioresour. Technol. 257 (2018) 147–156.
[24] R.D. Cortright, R.R. Davda, J.A. Dumesic, Nature 418 (2002) 964–967. [25] I. Coronado, M. Pitínová, R. Karinen, M. Reinikainen, R.L. Puurunen, J. Lehtonen,
Appl. Catal. A Gen. 567 (2018) 112–121.
[26] I. Coronado, A. Arandia, M. Reinikainen, R. Karinen, R.L. Puurunen, J. Lehtonen, Catalysts 9 (2019) 936.
[27] L. Chen, Y. Zhu, H. Zheng, C. Zhang, B. Zhang, Y. Li, J. Chem. Technol. Biotechnol. 87 (2012) 112–122.
[28] L. Chen, Y. Zhu, H. Zheng, C. Zhang, Y. Li, J. Chem. Technol. Biotechnol. 87 (2012) 1089–1097.
[29] B.H. Davis, Fuel Process. Technol. 71 (2001) 157–166.
[30] J.W. Shabaker, R.R. Davda, G.W. Huber, R.D. Cortright, J.A. Dumesic, J. Catal. 215 (2003) 344–352.
[31] R.R. Davda, R. Alcalá, J. Shabaker, G. Huber, R.D. Cortright, M. Mavrikakis, J.A. Dumesic, Stud. Surf. Sci. Catal. 145 (2003) 79–84.
[32] R.R. Davda, J.W. Shabaker, G.W. Huber, R.D. Cortright, J.A. Dumesic, Appl. Catal. B Environ. 56 (2005) 171–186.
[33] G. Pipitone, G. Zoppi, S. Bocchini, A.M. Rizzo, D. Chiaramonti, R. Pirone, S. Bensaid, Catal. Today. (2019),https://doi.org/10.1016/j.cattod.2019.09.040. [34] G. Pipitone, G. Zoppi, S. Ansaloni, S. Bocchini, F.A. Deorsola, R. Pirone, S. Bensaid,
Chem. Eng. J. 377 (2019),https://doi.org/10.1016/j.cej.2018.12.137. [35] T. Van Haasterecht, C.C.I. Ludding, K.P. De Jong, J.H. Bitter, J. Energy Chem. 22
(2013) 257–269.
[36] R. Lobo, C.L. Marshall, P.J. Dietrich, F.H. Ribeiro, C. Akatay, E.A. Stach, A. Mane, Y. Lei, J. Elam, J.T. Miller, ACS Catal 2 (2012) 2316–2326.
[37] L.I. Godina, A.V. Tokarev, I.L. Simakova, P. Mäki-Arvela, E. Kortesmäki, J. Gläsel, L. Kronberg, B. Etzold, D.Y. Murzin, Catal. Today. 301 (2018) 78–89.
[38] G. Pipitone, G. Zoppi, A. Frattini, S. Bocchini, R. Pirone, S. Bensaid, Catal. Today. (2019),https://doi.org/10.1016/j.cattod.2019.09.031.
[39] K. Lehnert, P. Claus, Catal. Commun. 9 (2008) 2543–2546.
[40] G. Pipitone, D. Tosches, S. Bensaid, A. Galia, R. Pirone, Catal. Today. 304 (2018) 153–164.