JSLHR
Supplement Article
Voice Quality and Gender Stereotypes:
A Study of Lebanese Women
With Reinke
’s Edema
Nayla Matar,a,bCristel Portes,bLeonardo Lancia,c Thierry Legou,band Fabienne Baiderc
Purpose: Women with Reinke’s edema (RW) report being mistaken for men during telephone conversations. For this reason, their masculine-sounding voices are interesting for the study of gender stereotypes. The study’s objective is to verify their complaint and to understand the cues used in gender identification.
Method: Using a self-evaluation study, we verified RW’s perception of their own voices. We compared the acoustic parameters of vowels produced by 10 RW to those produced by 10 men and 10 women with healthy voices (hereafter referred to as NW) in Lebanese Arabic. We conducted a perception study for the evaluation of RW, healthy men’s, and NW voices by naïve listeners.
Results: RW self-evaluated their voices as masculine and their gender identities as feminine. The acoustic parameters that distinguish RW from NW voices concern fundamental frequency, spectral slope, harmonicity of the voicing signal, and complexity of the spectral envelope. Naïve listeners very often rate RW as surely masculine.
Conclusions: Listeners may rate RW’s gender incorrectly. These incorrect gender ratings are correlated with acoustic measures of fundamental frequency and voice quality. Further investigations will reveal the contribution of each of these parameters to gender perception and guide the treatment plan of patients complaining of a gender ambiguous voice.
A
lthough voicing is produced by a stream of airdelivered by the lungs and trachea and inducing vibrations of the vocal folds, it is influenced by various parallel and interconnected processes: namely, it is affected by anatomical, social, cultural, physical, and cogni-tive constraints. In addition to supporting the linguistic message, a voice also reveals important paralinguistic fea-tures related to the speaker, such as age, gender, sexual orientation, race, and emotional status (Kreiman & Sidtis, 2013). Gender, defined by Oakley (1972) as the social clas-sification into masculine and feminine, and by Collins,
Chafetz, Blumberg, Coltrane, and Turner (1993) as a continuum between masculinity and femininity, is a key part of the information transmitted by voice. As soon as a listener hears a voice, the physical features of that voice interact with the listener’s own socioculturally driven per-ceptual expectations and stereotypes, and a judgment is made about the speaker’s gender. Gender conceptualization not only helps the listener to adapt the choice of his or her words to the speaker’s identity, but it is also a strong predic-tor of word recognition, whether a particular gender actu-ally utters a gender-associated word more than the other gender or not. Sumner, Kim, King, and McGowan (2013) suggest that phonetically cued social information is ex-tracted from speech along with linguistic information and that this social information modulates the encoding of spo-ken words and word forms.
Women with cigarette smoking history may develop a vocal fold pathology known as Reinke’s edema (RE). RE is an accumulation of a gelatinous substance, mostly on the superior surface of Reinke’s space, responsible for a homogenous polypoid aspect of the membranous part of the vocal folds (from the anterior commissure to the vocal process). It is frequently symmetrical, although rare cases of asymmetrical, unilateral, or localized RE can be found.
aDepartment of Otolaryngology Head and Neck Surgery, Hôtel-Dieu
de France Hospital, Faculty of Medicine, Saint-Joseph University, Beirut, Lebanon
bAix-Marseille Université, Aix-en-Provence, France cUniversity of Cyprus, Nicosia
Leonardo Lancia is now at Laboratoire de Phonétique et Phonologie, UMR 7018, CNRS/Université Sorbonne Nouvelle–Paris 3, France. Correspondence to Nayla Matar: nayla.matar@hdf.usj.edu.lb, nmatar.orl@gmail.com
Editor: Jody Kreiman
Associate Editor: Susanne Fuchs Received February 2, 2015 Revision received September 9, 2015 Accepted February 11, 2016
DOI: 10.1044/2016_JSLHR-S-15-0047
Disclosure:The authors have declared that no competing interests existed at the time of publication.
Yonekawa (1988) proposed a classification of RE into three categories according to the severity of the edema, with Type I being a limited edema, with adequate vocal fold movement and preservation of the phonatory quotient, and Type III being a voluminous edema, causing permanent contact between the vocal folds and limiting the abduction of the vocal folds to the posterior third during inspiration. These women complain of being addressed as men, espe-cially in situations in which other gender cues are not avail-able, such as being called“sir” over the phone (see online Supplemental Material S5). A well-documented explanation is that their voices have lower fundamental frequencies (F0) compared with healthy controls (Zeitels, Hillman, Bunting, & Vaughn, 1997). However, gender cues in voice identifica-tion are numerous. Andrews and Schmidt (1997) showed that F0 is not the only cue for that purpose, given that many women with low F0 are still recognized as women. This raises the following questions: Where does the anecdotally reported complaint of women with RE come from? Is it only based on self-evaluation? Can it be confirmed in an experimental setting? Which acoustic parameters make women with RE sound like men?
Men and women with healthy voices represent the two extremes of the gender continuum (Owen & Hancock, 2010). Many studies suggest that mean value and variations of F0 are the main parameters that distinguish feminine and masculine voices (Andrews & Schmidt, 1997; Avery & Liss, 1996; Hillenbrand & Clark, 2009; Munson, 2007). Other studies, though, attribute a major role to formant frequencies (Andrews & Schmidt, 1997; Avery & Liss, 1996). Some other studies link voice quality to gender, with a rough or irregular voice being considered more masculine and a breathy voice more feminine (Klatt & Klatt, 1990; Van Borsel, Janssens, & De Bodt, 2009). Note that although voice quality is a perceptive element, various qualities have been linked to multiple objective acoustic parameters. For instance, breathiness has been linked to harmonic-to-noise ratio (HNR) and spectral tilt, creakiness to spectral tilt and roughness to jitter, shimmer, as well as to HNR (Biemans, 2000). As a matter of fact, women with RE, as well as men with RE, do have higher jitter, higher shimmer, and lower HNR than healthy controls (Zeitels et al., 1997). However, this is also the case of other hoarse patients who do not system-atically complain about the gender ambiguity of their voice.
Therefore, this supplement article aims at improving our knowledge of the role of various acoustic parameters in gender distinction by evaluating their impact on an understudied population, women with RE, through a self-evaluation study (in which a participant rates the gender of his or her own voice and gender identity), a production study, and a perception study. The studied language is Lebanese Arabic, for which no studies on gender and voice have yet been proposed to date.
Speakers and Recording Session
Three groups of speakers participated in the study: 10 healthy women (hereafter referred to as NW), 10 healthy
men (hereafter referred to as NM), and 10 women affected by RE (hereafter referred to as RW), with a mean age of 51.4 (SD = 2.9), 47.2 (SD = 3.8), and 54.7 (SD = 3.77) years, respectively. Speakers in the healthy groups were selected from a larger speaker sample according to the partici-pants’ age in RW group because of the known influence of age on voice quality. The Institutional Review Commit-tee at Saint-Joseph University, Beirut, Lebanon (CEHDF 390), approved the procedures. Participants signed an informed consent before the beginning of the experiment. As for the RW group, the diagnosis of RE was confirmed in all participants after endoscopic examination of the vocal folds by the first author, using a video endoscope (Storz, Germany). The morphological difference between their vocal folds and healthy vocal folds is shown in Figure 1.
Instructions were presented to speakers on a laptop screen using E-prime software. We used a H2 Handy Recorder (Zoom Corporation, Tokyo, Japan) with an AKGC520 headset microphone (AKG Acoustics, Vienna, Austria) to ensure a constant distance between the micro-phone and the participant’s mouth. Microphone-to-mouth distance was set at 5 cm. Recorded signals were sequenced and annotated using Praat software (Boersma & Weenink, 2001). After a test trial, participants were instructed to pro-duce three stable vowels /a/, /i/, and /u/ continuously for 3 s and five words containing these vowels: /ʒaras/ “bell,” /bu:za/“ice-cream,” /baˈti:x/ “watermelon,” /banadu:ra/ “to-mato,” /tanʒra/ “pot,” using habitual vocal pitch and loud-ness. There were three repetitions for each stimulus. In each category, the stimuli were presented randomly. At the end of the recording session, the speakers were immediately asked to rank their voice and their gender identity using scales displayed in Lebanese Arabic.
Self-Evaluation Study
Method
In the self-evaluation study, the aim is to determine if the study’s sample of RW reported a masculine voice and whether there was a relation between the self-evaluation of their voice and the self-evaluation of their gender identity. The self-evaluation of gender associated with voice, as well as the gender identity can be performed by using different types of scales (see online Supplemental Material S1). We used a unique scale of masculinity and femininity. In doing so, we adopted the standpoint from postmodern theory (Butler, 2006; Collins et al., 1993; Owen & Hancock, 2010) stating that gender perception is not binary but is spread on a continuum. The instructions were given in Lebanese Arabic (see online Supplemental Material S2). Speakers were asked to rate the gender associated with their voice, as well as their own gender identity by giving numbers ranging from 1 to 9, with 1 = maximal masculinity and 9 = maximal femininity. The self-evaluation scores of the gender associ-ated with voice, as well as the gender identity were compared between the groups using the nonparametric Kruskal–Wallis and Mann–Whitney tests.
Results
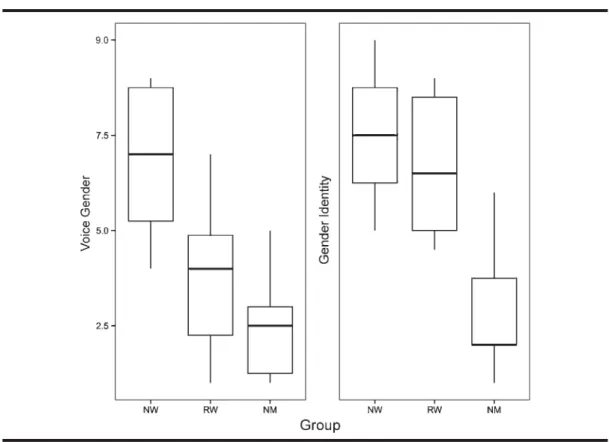
Figure 2 shows the results of the self-evaluation study. The mean scores of the voice self-evaluation were as follows: 6.9 (SD = 1.8) for NW, 2.5 (SD = 1.3) for NM, and 3.6 (SD = 1.9) for RW. A Kruskal–Wallis test revealed signifi-cant differences in the way speakers from different groups evaluated their own voice ( p < .001). However, a Mann– Whitney test failed to show any significant difference in the way RW and NM ranked their own voices ( p > .05). The self-evaluation scores of gender identity were 7.4 (SD = 1.7) for NW, 2.7 (SD = 1.5) for NM, and 6.6 (SD = 1.8) for RW. A Kruskal–Wallis test revealed significant differences in the way speakers from different groups evaluated their gender identity ( p < .001). However, a Mann–Whitney test failed to show any significant difference in the way RW
and NW rank their gender identity ( p > .05). This self-evaluation study demonstrated that the study group of RW described their voice as masculine, which is in contradiction to the way they perceived their gender identity.
Production Study
Methods
The aim of the production study is to investigate the acoustic parameters that distinguish the voices of RW from those of NM and NW. Voice quality measures were collected by using the VoiceSauce program implemented in MATLAB (Shue, Chen, & Alwan, 2010). These mea-sures included the fundamental frequency (F0) in hertz, the acoustic energy level (energy), the cepstral peak prominence
Figure 1. (Left) healthy vocal folds during inhalation; (center) vocal folds with Reinke’s edema (Type I) during inhalation; (right) vocal folds with Reinke’s edema (Type III) during inhalation.
Figure 2. Box plots for self-evaluation of voice (left) and gender identity (right) of women with Reinke’s edema (RW), healthy men (NM), and healthy women (NW). In the y axis, 1 = maximal masculinity, 9 = maximal femininity.
(CPP), and the HNR at various frequency bands, which included the following: 0–500 Hz (HNR05), 0–1.5 kHz
(HNR15), 0–2.5 kHz (HNR25), and 0–3.5 kHz (HNR35).
The subharmonic-to-harmonic ratio, two measures of spec-tral slope at low frequencies included the following: the amplitude of the first harmonic minus the amplitude of the second harmonic (H1−H2) and the amplitude of the second harmonic minus the amplitude of the fourth harmonic
(H2−H4). Because automatic algorithms for formant
detection often fail when analyzing pathological voice qualities, we measured the values of the first and second formant frequencies (F1 and F2) semiautomatically by using a Praat script. This script is based on the analysis of spectrograms and spectra and allows the manual correc-tion of the detected formant frequencies.
Following Iseli and Alwan (2004), we corrected the measures of spectral slope by taking into account formants and bandwidths. However, to reduce the erroneous estima-tions of these parameters, we computed the median values of formants and bandwidths for each combination of speaker and stimulus, and we used them to correct the slope mea-sures extracted from the considered signals.
To understand which acoustical parameters differen-tiate RW from NW and NM, we built separate linear mixed models for each parameter. In each model, the speaker group was represented by a three-level factor with RW as a reference level. The vowel identity was also represented by a three-level factor, but it was coded with a deviation from the mean contrast (assess the deviation of the behavior observed during the production of /i/ and /u/ from the behav-ior observed on average across vowels). The interaction be-tween speaker group and vowel quality was also included. Due to the coding scheme chosen for the vowel identity, the mean effect of speaker group represented the average effect across the three vowels. Analyses were restricted to isolated vowels and stressed vowels in words. We used the average stable midportions of the vowels to conduct the statistical analysis. The random effects structure included a random intercept for each speaker and vowel, in addition to a ran-dom intercept specific to the word containing the vowel (with an additional level for vowels produced in isolation). Moreover, we included a speaker-specific random term for the effect of the vowel (models including a speaker-specific random term, for the effects of the word containing the vowel, did not converge). Only interactions that resulted in significant effects or whose inclusion determined a signif-icant improvement of the model’s fit (as assessed through a chi-square test between the residuals of the models with and without the interaction) were retained.
The p values were computed using the Satterthwaite’s approximation (Bolker et al., 2009) for the degrees of freedom as implemented in the R package ImerTest (Kuznetsova, Brockhoff, & Christensen, 2015). To be able to correct for multiple testing from the same data, p values were ad-justed with the false discovery rate criterion, as proposed by Benjamini and Yekutieli (2001). We adopted the False Discovery Rate approach instead of the Bonferroni correc-tion, because the Bonferroni correction becomes increasingly
conservative the higher the number of factors tested, whereas methods on the basis of the false discovery rate maintain their statistical power, even in presence of a large number of factors (Benjamini & Yekutieli, 2001).
Results
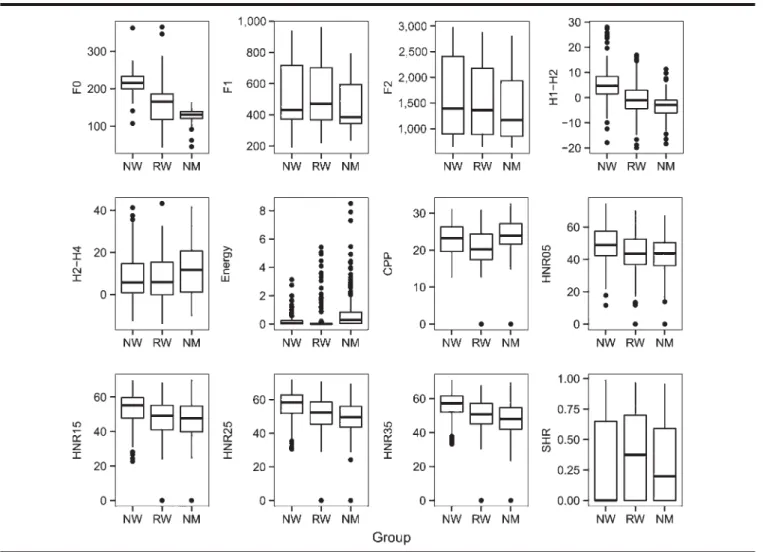
The box plots of the acoustic parameters are displayed in Figure 3. The results of the linear mixed models are found in online Supplemental Material S3. F0 is higher in NW than in RW (estimate = 54.8; t = 4.45; p = .005). There is no statistically significant difference in F0 between RW and NM (estimate =−34.06; t = −2.8; p = .22).
Concerning formant frequencies, there are significant differences between values found in RW compared with those found in NM, but no differences in the values found in RW compared with those found in NW. F1 is smaller in NM than in RW (estimate =−69.6; t = −5.5; p = .0005).
F2 is smaller in NM than in RW (estimate =−186.8;
t =−6.5; p = .0000). F2 is smaller for /u/ than the average vowel at least for RW (estimate =−713.06; t = −31; p = .0000). The difference in F2 between /u/ and the average vowel is significantly reduced in NM (estimate = 127.06; t = 4.1; p = .01).
The following paragraph focuses on voice quality features. H1–H2 is higher for NW than for RW (estimate = 5.9; t = 3.7; p = .02). The difference in H1–H2 between NW and RW is reduced when the vowel /u/ is produced within words (estimate =−3.7; t = −3.1; p = .049). There are no major differences for H2–H4 between the three groups except when the vowel /u/ is produced in the word internal position; in this situation, the difference in H2–H4 between NW and RW is significantly reduced (estimate = 10.09; t = 5.4; p = .0000). CPP is lower in the production of vowel /u/ for RW (estimate =−1.9; t = −7.3; p = .0000), but the difference in CPP between /u/ and the other vowels is stronger for NW (estimate =−1.4; t = −4.3; p = .0083). HNR05 is lower in vowel /u/ for NW (estimate =−5.08; t =−3.9; p = .02) and for NM during the production of words (estimate =−4.4; t = −3.5; p = .02). HNR15 is higher in vowel /i/ than in the average vowel for RW (estimate = 3.9; t = 3.9; p = .01). HNR15 is lower in vowel /u/ for NW (estimate =−5.2; t = −4.7; p = .002). HNR15 is lower for NM in the production of words (estimate =−4.3; t = −3.5; p = .016). HNR25 is higher for /u/ in RW (estimate = 3.6; t = 4.7; p = .0013). HNR25 is lower for vowels produced within words in RW (estimate =−2.9; t = −3.5; p = .016). The difference in HNR25 between /u/ and the other vowels is reduced in NW (estimate =−5.4; t = −5.4; p = .0005). The difference in HNR25 between isolated vowels and vowels in words is reduced in NM (estimate =−4.1; t = −3.6; p = .01). HNR35 is higher in vowel /u/ for RW (estimate = 4.7; t = 5.9; p = .0000), but the effect is reduced in vowels located in words’ internal position in NM (estimate = −4.7; t =−4.3; p = .0009) and is also reduced for vowels produced by NW (estimate =−4.2; t = −3.7; p = .01).
In summary, F0 is lower in RW than in NW, F1 and F2 are lower in NM than in RW but are not significantly
different between RW and NW, H1–H2 is lower in RW than in NW, CPP is lower in RW than in NM and NW, and HNR05, HNR15, HNR25, and HNR35 are higher in RW than the other two groups.
Perception Study
Methods
The aim of the perception study is to determine if the voice gender ambiguity of RW is perceived by naïve listeners who listen to the speakers’ voices without additional cues. The experimental material includes the vowels and the words of all speakers of the three groups.
First, vowels were randomly presented using head-phones to a panel of 25 naïve listeners: 11 women, mean age = 24.7 years (SD = 1.5); 14 men, mean age = 24 years (SD = 1). They were asked to judge each vowel using a button box with 1 = surely feminine, 5 = surely masculine, and a color gradient ranging from pink to blue.“Due” to the listeners being bilingual and the use of French in our academic setting, instructions were given in French. They
were as follows:“Pour chaque son que vous allez entendre, choisir entre les 5 options que vous avez, avec comme extrémité gauche 1 = sûrement féminin et extrémité droite, 5 = sûrement masculin.”1After a 10-min break, the same experiment was conducted with full words.
We chose this binary definition in this part of the experiment because listeners in everyday life are forced to make binary judgments. In fact, according to Eckert (2014), because it is a fundamental ideological construct, the gender binary can coerce listeners into seeing through a binary lens things that might be seen differently, as a continuum, for example.
All listeners were native speakers of Lebanese Arabic, and none reported a history of speech, language, or hearing disorders. Listeners were medical students; they were un-familiar with the speakers they were rating. Due to the bimodal distribution of the data (cf. Figure 4), we only
1
The terms surely feminine and surely masculine will be used throughout the Results section to indicate responses 1 and 5, respectively.
Figure 3. Box plots of the acoustic parameters of the three groups: healthy women (NW), women with Reinke’s edema (RW), and healthy men (NM). F0 = fundamental frequency; H2–H4 = second to fourth harmonics; HNR15 = 0–1.5 kHz.
submitted trials with extreme response values (1 or 5) to the statistical analyses, and we built a logistic regression model. The dependent variable was the probability to observe a response of surely masculine. The fixed factors were the speaker group (RW, NW, and NM, with RW as reference level), the listener sex (with male as reference level) and the stimulus class (isolated vowel or word, with isolated vowel as reference level), as well as all their possible two-way and three-way interactions. The random effects structure included one random intercept per speaker, one per listener, and one per stimulus. An initial model included also a ran-dom slope per speaker group specific to listener identity (to account for listeners’ specific effects of speaker group). However, this model did not converge. Therefore, the ran-dom slope had to be removed. Due to the coding of factors, the basic effects of speaker group and stimulus class were computed on evaluations by male listeners, while the basic effect of the listener sex was computed on stimuli produced by RW.
Results
The effect of the speaker group shows that male lis-teners perceived NW as surely masculine less often than RW (estimate:−0.6777, z value: −4.022, probability (Pr; >|z|): 0.0001) but perceived NM as surely masculine more often than RW (estimate: 1.1848, z value: 7.289, Pr (>|z|): 0.0000).
The effect of the listener sex is significant and positive, meaning that in the evaluation of isolated vowels, female listeners judged RW more often as surely masculine than male listeners did (estimate: 0.5409, z value: 2.733, Pr (>|z|): 0.0063). The effect of the stimulus class is significantly nega-tive (estimate:−0.2776, z value: −2.379, Pr (>|z|): 0.0174), meaning that in the evaluation of isolated vowels, male listeners judged RW more often as surely masculine than when producing full words.
The interaction between the listener gender and the speaker group is significant and negative when comparing the judgment of RW and NW (estimate:−0.8218, z value: −4.557, Pr (>|z|): 0.0000). This means that, compared with male listeners, female listeners judged NW as surely masculine less often than RW. This interaction is signifi-cantly positive when comparing the judgments of RW and NM (estimate: 0.3582, z value: 2.038, Pr (>|z|): 0.0415), suggesting that female listeners judged NM as surely mas-culine more often than RW, when compared with male lis-teners. These effects combined together suggest that RW are perceived as more different from both NW and NM by female listeners than by male listeners.
Furthermore, the interaction between the stimulus class and the speaker group was significant, both when comparing the judgments of RW and NW (estimate: 0.4794, z value: 3.187, Pr (>|z|): 0.0014) and when comparing the judgments of RW and NM (estimate: 0.4261, z value: 2.965,
Figure 4. Counts of each perceptual response separated by stimulus type (top panels vs. bottom panels) by listener sex (left column panels vs. right column panels) and by speakers’ group (colors). RW = women with Reinke’s edema; NW = healthy women; NM = healthy men.
Pr (>|z|): 0.0030). This time, the interaction was positive in both cases, suggesting that for male listeners (a) the dif-ference between the probability of evaluating RW and NW as surely masculine decreased in the evaluation of full words and (b) the difference between the probability of evaluating RW and NM as surely masculine increased in the evalua-tion of full words.
The interaction between stimulus class and listener gender is significantly negative (estimate:−1.2639, z value: −7.405, Pr (>|z|): 0.0000). Considering that female lis-teners evaluated RW as surely masculine more often than male listeners when hearing isolated vowels, this interaction indicates that in the evaluation of full words, the behavior of female listeners converged toward that of male listeners.
The triple interaction between listener gender, stimu-lus class, and speaker group is significant both for NW (estimate: 0.9228, z value: 4.028, Pr (>|z|): 0.0001) and for NM (estimate: 0.8845, z value: 3.922, Pr (>|z|): 0.0001), and in both cases, the effect is positive.
When female listeners evaluated full words, the prob-ability of NW and RW being evaluated as surely masculine converged. This is consistent with the effect of interaction between listener gender and stimulus class (showing that RW were perceived less often as surely masculine by female listeners in the evaluation of full words). On the other hand, the probability of NM and RW being evaluated as surely masculine diverged.
Overall, RW were perceived as surely masculine more often than NW and less often than NM. The mis-classification of RW was reduced when listeners heard full words. In the evaluation of isolated vowels, female listeners judged RW more often to be surely masculine than male listeners did. Moreover, they differentiated better between RW and NM than male listeners did. The behavior of female listeners was closer to that of male lis-teners in the evaluation of full words.
The Relation Between Production
and Perception Studies
A final analysis was conducted to establish the rela-tions between acoustic parameters and listener evaluarela-tions of produced vowels. To relate perceptual judgment to the properties of vowels, we limited analyses to sustained vowels. We chose to study sustained vowels in this pre-liminary study to avoid the variability observed in vowels produced in words.
As for the analysis of production data, only the lis-teners’ responses corresponding to the extreme values of the judgment scale were considered. We also built separate logistic mixed models for each acoustic parameter and adjusted the p values adopting the False Discovery Rate criterion to correct multiple testing as mentioned previously. In each model, the dependent variable was the probability of observing a surely masculine answer, while the fixed fac-tors were the value of the model-specific acoustic parameter, speakers’ groups (with RW as reference) and vowel identity
(with the vowel /a/ as reference). We also considered all possible interactions between these factors. Random effects included a speaker-specific intercept and a speaker-specific slope for each of the fixed factors.
Six parameters show a significant relation with per-ceptual responses, namely, those that measure F0 and voice quality. The results of these mixed models are found in online Supplemental Material S4. The first factor is F0. Its effect is significant and negative for all three groups, which means that when F0 increases, the probability of a speaker being judged as surely masculine decreases. This is especially true for RW (estimate =−0.004; t = −3; p = .03). The second factor is H1–H2. Its effect is significant and negative. When H1–H2 increases, the probability of RW being judged as surely masculine decreases (estimate =−0.035; t =−3.4; p = .01).
The third factor is CPP. Its effect is significant and negative. When CPP increases, the probability of RW be-ing judged as surely masculine decreases (estimate =−0.07; t =−4.15; p = .001). The effect of CPP is specific to the RW group, as it is significantly reduced in NW (estimate = 0.076; t = 3.5; p = .009) and in NM (estimate = 0.074; t = 3.2; p = .02).
The fourth factor is HNR05. For the vowel /i/, the effect is significant and positive, meaning that when HNR05 for the vowel /i/ increases, the probability of being judged as surely masculine increases, compared with the average vowel (estimate = 0.02; t = 3.05; p = .024). For the vowel /u/, the effect is significant and negative, which indicates that when HNR05 for the vowel /u/ increases, the probability of being judged as surely masculine decreases, compared with the average vowel (estimate =−0.03; t = −3.9; p = .002; online Supplemental Material S4, Line 77). The effect observed for the vowel /i/ in RW is significantly reduced in NM (estimate = −0.03; t = −2.9; p = .03). This is also the case for the effect observed for the vowel /u/ (estimate = 0.03; t = 3.3; p = .01).
The fifth factor is HNR15. For the vowel /u/, its effect is significant and negative, which indicates that an increase in HNR15 in vowel /u/ is associated with a decrease in the probability of being judged as surely masculine compared with the average vowel (estimate =−0.03; t = −3.2; p = .015). The effect observed in RW for the vowel /u/ is reduced in NM (estimate = 0.03; t = 2.75; p = .05).
The last factor is HNR25. Its effect is significant and negative, indicating that an increase in HNR25 is associ-ated with a decrease in the probability of being judged as surely masculine (estimate =−0.02; t = −2.7; p = .05). This effect is more important in RW for the vowel /u/ (estimate = −0.04; t = −3.4; p = .01), although this is not the case in NM, where the combined effect of HNR25 and vowel /u/ is significantly reduced (estimate = 0.04; t = 2.79; p = .05).
General Discussion
This is the first study on gender in Lebanese Arabic voices. It is also one of the few studies tackling gender perception of women’s voices (Munson, 2007). We have demonstrated, through the self-evaluation study, that RW
describe their voices as masculine, whereas they describe their gender identity as feminine. This observation confirms what has been previously reported anecdotally in the litera-ture referring to the complaints of RW concerning the mas-culinity of their voices. Results in RW can be related to those of transgender speakers who have a conflict between their self-perception of a feminine gender identity with a masculine voice (Owen & Hancock, 2010). These findings might be responsible for the psychosocial complaints that need to be addressed when treating RW.
In the perception study, participants had the option of classifying the voices on a scale ranging from surely masculine to surely feminine, reflecting their degree of confidence; we found that the options in the middle were less frequently used than the extremes, suggesting that listeners were, most of the time, confident with their decision and that they tended to perceive masculine and feminine voices on a binary basis rather than on a continuum (Eckert, 2014). However, this conclusion should be interpreted with cau-tion because all adopted labels are related to both gender categories (with intermediate values coding the level of confidence of listener judgments). RW were more often classified as surely masculine than NW and less frequently classified as surely masculine than NM. These results con-firm the incorrect classification of RW’s voices with respect to gender information and make these voices suitable for studying the acoustic parameters responsible for the per-ception of voice gender.
It seems that the perception of voice gender depends on the listeners’ sex because female listeners judged RW more often to be surely masculine than male listeners. This finding may be explained by the fact that female listeners are often reported as more precise in their perceptual judg-ments (Namy, Nygaard, & Sauerteig, 2002) or by the fact that due to differences between male and female anatomy, female listeners can rely on internal models more closely matching the production systems of other female speakers. This is important to note because it means that the mascu-linity of RW is mostly established by other women. This observation was reported by one of the RW speakers who said that men say that she has a sexy voice over the phone, but women often call her“sir” over the phone. Regardless of the interpretation, this result contradicts the hypothesis that people have an increased discrimination of voices of the opposite sex due to an increased attention to evolutionary relevant stimuli (Junger et al., 2013). This is especially true for isolated vowels. RW were more often judged as surely masculine when producing isolated vowels than when pro-ducing words. This is compatible with the words containing more suprasegmental gender information that allows a finer tuning of the gender classification of voice.
We found that F0 is lower in RW than in NW as previ-ously mentioned in literature (Lim, Choi, Kim, & Choi, 2006; Zeitels et al., 1997). Other measures related to voice quality have been found to distinguish the voices of RW: H1–H2,
H2–H4, CPP, HNR05, HNR15, HNR25, and HNR35.
H1–H2 is related to the open quotient. Therefore, the lower value observed in RW indicates a shorter open
phase and less breathy voice with respect to NW. This is compatible with the fact that RW have edematous vocal folds that limit the duration of the open phase. Indeed, RW do have different glottal characteristics from those found in NW because the homogenous edema allows a com-plete glottal closure (comcom-plete glottal closure is also often observed in healthy men) leading to less energy loss at the glottis and lower H1–H2 values (Hanson, 1997). H2–H4 is higher in RW for the vowel /u/: This might be due to the anticorrelation between H1–H2 and H2–H4 (Garellek, Keating, Esposito, & Kreiman, 2013) or may have other explanations that should be further studied.
CPP is a measure of the degree of harmonic organiza-tion. A voice with a well-defined harmonic structure will have a strong cepstral peak. CPP has been primarily linked to breathiness rather than to the severity of hoarseness without a direct link to a specific voice quality (Fraile & Godino-Llorente, 2014). In this study, CPP is lower in RW than in NM and NW. This reflects a lack of a well-defined harmonic structure in RW’s voices related to their hoarse-ness. This finding is confirmed by the higher HNR05 in RW, which is related to rough voices (Biemans, 2000). How-ever, HNR15, HNR25, and HNR35 are higher in RW compared with NW. Such findings have been reported in breathy voices often judged as more feminine (Biemans, 2000). According to these results, RW seem to have some masculine voice features such as F0, H1–H2, CPP, and HNR05; however, they also have some feminine features, such as HNR15, HNR25, and HNR35, as well as formant frequencies. These are not significantly different between NW and RW.
The results of the correlation study between acoustic parameters and voice perception show that factors related to F0 and voice quality play the most important role in listener judgment. The fundamental frequency seems to be the most important factor used by listeners for the judgment of gender in voice in this setting. For F0, higher values re-lated to high-pitched voices are judged as surely feminine, whereas lower values related to low pitched voices are judged as surely masculine independently of the speakers group. CPP is also a relevant factor but plays a more important role in RW. Lower values, related to hoarse voices, are judged as surely masculine. CPP has also been linked to voice attractiveness (Balasubramanium, Bhat, Srivastava, & Eldose, 2012) and to gender classification in children (Chen, Feng, Shue, & Alwan, 2010). However, it is a measure that deserves further investigation, especially in relation to the gender of voice. It seems that H1–H2, HNR05, HNR15, and HNR25 are less important cues used in the evaluation of the gender in voice in healthy groups. We found that they were used, especially in the case of RW, and that they were more salient in the vowel /u/. This might be explained by the fact that listeners need more cues to classify gender when they hear ambiguous voices.
We acknowledge the limitations of the study. First, it includes only 10 speakers in each category and investigates only three vowels. Second, we did not study full words, although we acknowledge that the production of full words
is closer to everyday life situations; the relation between the acoustic parameters measured in full words and the percep-tion of gender will be the object of future studies. Third, because acoustic parameters analyses were performed on sustained vowels and stressed vowels contained in words, we had to restrict the choice of acoustic parameters to be studied. Fourth, we did not study intra- and interrater reli-ability in the perception study. These results open several perspectives for future development. We plan to study (a) if differences between NW and RW observed in the perception of isolated vowels and words are still observed when listeners hear complete sentences; (b) if male and female listeners rely on different cues to classify gender when they hear voices, especially gender ambiguous voices; and (c) if the perception of RW voices changes after treatment.
Conclusion
RW are perceived as having masculine voices, partic-ularly when judged by female listeners. The perception of gender in RW is linked to F0 and voice quality parameters. RW represent another example of gender ambiguity in voice that has to be further studied and could be used to reveal parameters on which listeners rely to discern gender in voice. A better understanding of how each of these parame-ters contribute to gender perception could guide the treatment plan of patients complaining of gender-ambiguous voices.
Acknowledgments
This research was funded by the Conseil de la recherche de l’Université Saint-Joseph, Lebanon and by the CNRS, France (Projet PEPS, Défi Genre). Leonardo Lancia’s work, carried out within the Labex BLRI (Brain and Language Research Institute, ANR-11-LABX-0036) and ASLAN (Advanced Studies on Language complexity, ANR-10-LABX-0081), has benefited from support from the French government, managed by the French National Agency for Research (ANR), under the program Investissements d’Avenir (ANR-11-IDEX-0001-02 and AQ13 ANR-11-IDEX-0007).
The authors thank all speakers and patients, as well as Josephine Sacre, Leslie Akl, Valery Joe Haddad, and Stephanie Matar for their contribution to this work. The authors also thank Chantal Choueiry Akiki, Ingrid Verduyckt, and Zoukaa Sargi, for their valuable comments when reading the article.
References
Andrews, M. L., & Schmidt, C. P. (1997). Gender presentation: Perceptual and acoustical analyses of voice. Journal of Voice, 11, 307–313.
Avery, J. D., & Liss, J. M. (1996). Acoustic characteristics of less-masculine-sounding male speech. The Journal of the Acoustical Society of America, 99, 3738–3748.
Balasubramanium, R. K., Bhat, J. S., Srivastava, M., & Eldose, A. (2012). Cepstral analysis of sexually appealing voice. Journal of Voice, 26, 412–415. doi:10.1016/j.jvoice.2011.03.011 Benjamini, Y., & Yekutieli, D. (2001). The control of the false
discovery rate in multiple testing under dependency. Annals of Statistics, 29, 1165–1168. doi:10.1214/aos/1013699998 Biemans, M. (2000). Gender variation in voice quality. Retrieved
from http://www.lotpublications.nl/Documents/38_fulltext.pdf
Boersma, P., & Weenink, D. (2001). Praat, a system for doing phonetics by computer. Glot International, 5, 341–345. Bolker, B. M., Brooks, M. E., Clark, C. J., Geange, S. W., Poulsen,
J. R., Stevens, M. H. H., & White, J.-S. S. (2009). Generalized linear mixed models: A practical guide for ecology and evolu-tion. Trends in Ecology & Evolution, 24, 127–135. doi:10.1016/j. tree.2008.10.008
Butler, J. (2006). Gender trouble: Feminism and the subversion of identity. New York, NY: Routledge.
Chen, G., Feng, X., Shue, Y., & Alwan, A. (2010). On using voice source measures in automatic gender classification of children’s speech. Proceedings of Interspeech, 2010, 673–676). Retrieved from http://www.seas.ucla.edu/spapl/paper/chen_interspeech_ 10.pdf
Collins, R., Chafetz, J. S., Blumberg, R. L., Coltrane, S., & Turner, J. H. (1993). Toward an integrated theory of gender stratifica-tion. Sociological Perspectives, 36, 185–216. doi:10.2307/ 1389242
Eckert, P. (2014). The problem with binaries: Coding for gender and sexuality. Language and Linguistics Compass, 8, 529–535. doi:10.1111/lnc3.12113
Fraile, R., & Godino-Llorente, J. I. (2014). Cepstral peak promi-nence: A comprehensive analysis. Biomedical Signal Processing and Control, 14(1), 42–54. doi:10.1016/j.bspc.2014.07.001 Garellek, M., Keating, P., Esposito, C. M., & Kreiman, J. (2013).
Voice quality and tone identification in White Hmong. The Journal of the Acoustical Society of America, 133, 1078–1089. doi:10.1121/1.4773259
Hanson, H. M. (1997). Glottal characteristics of female speakers: acoustic correlates. The Journal of the Acoustical Society of America, 101, 466–481.
Hillenbrand, J. M., & Clark, M. J. (2009). The role of f0and
formant frequencies in distinguishing the voices of men and women. Attention, Perception, & Psychophysics, 71, 1150–1166. doi:10.3758/APP.71.5.1150
Iseli, M., & Alwan, A. (2004). An improved correction formula for the estimation of harmonic magnitudes and its application to open quotient estimation. Proceedings of the IEEE Inter-national Conference on Acoustics, Speech, and Signal Processing, 2004, 669–672, doi:10.1109/ICASSP.2004.1326074
Junger, J., Pauly, K., Bröhr, S., Birkholz, P., Neuschaefer-Rube, C., Kohler, C., & Habel, U. (2013). Sex matters: Neural corre-lates of voice gender perception. NeuroImage, 79(1), 275–287. doi:10.1016/j.neuroimage.2013.04.105
Klatt, D. H., & Klatt, L. C. (1990). Analysis, synthesis, and per-ception of voice quality variations among female and male talkers. The Journal of the Acoustical Society of America, 87, 820–857.
Kreiman, J., & Sidtis, D. (2013). Foundations of voice studies: An interdisciplinary approach to voice production and perception (1st ed.). Malden, MA: Wiley-Blackwell.
Kuznetsova, A., Brockhoff, P. B., & Christensen, R. H. B. (2015). lmerTest: Tests in Linear Mixed Effects Models (Version 2.0-25) [Computer software]. Retrieved from http://cran.r-project. org/web/packages/lmerTest/index.html
Lim, J.-Y., Choi, J.-N., Kim, K.-M., & Choi, H.-S. (2006). Voice analysis of patients with diverse types of Reinke’s edema and clinical use of electroglottographic measurements. Acta Oto-Laryngologica, 126, 62–69. doi:10.1080/00016480510043927 Munson, B. (2007). The acoustic correlates of perceived masculinity,
perceived femininity, and perceived sexual orientation. Language and Speech, 50, 125–142.
Namy, L. L., Nygaard, L. C., & Sauerteig, D. (2002). Gender differences in vocal accommodation: The role of perception.
Journal of Language and Social Psychology, 21, 422–432. doi:10.1177/026192702237958
Oakley, A. (1972). Sex, gender and society. San Francisco, CA: Harper Colophon.
Owen, K., & Hancock, A. B. (2010). The role of self- and listener perceptions of femininity in voice therapy. International Journal of Transgenderism, 12, 272–284. doi:10.1080/15532739.2010. 550767
Shue, Y., Chen, G., & Alwan, A. (2010). On the interdependencies between voice quality, glottal gaps, and voice-source related acoustic measures. Proceedings of Interspeech, 2010, 34–37. Retrieved from http://www.seas.ucla.edu/spapl/paper/shue_ interspeech_10.pdf
Sumner, M., Kim, S. K., King, E., & McGowan, K. B. (2013). The socially weighted encoding of spoken words: A dual-route approach to speech perception. Frontiers in Psychology, 4, 1015. doi:10.3389/fpsyg.2013.01015
Van Borsel, J., Janssens, J., & De Bodt, M. (2009). Breathiness as a feminine voice characteristic: A perceptual approach. Journal of Voice, 23, 291–294. doi:10.1016/j.jvoice.2007.08.002 Yonekawa, H. (1988). A clinical study of Reinke’s edema. Auris
Nasus Larynx, 15, 57–78. doi:10.1016/S0385-8146(88)80010-5 Zeitels, S. M., Hillman, R. E., Bunting, G. W., & Vaughn, T.
(1997). Reinke’s edema: Phonatory mechanisms and manage-ment strategies. The Annals of Otology, Rhinology, and Laryn-gology, 106, 533–543.

![[PDF] Manuel complet pour apprendre à utiliser le CMS Drupal | Cours informatique](data:image/gif;base64,R0lGODlhAQABAIAAAP///wAAACH5BAEAAAAALAAAAAABAAEAAAICRAEAOw==)