Critical Enhancements of a Dynamic Traffic
Assignment Model for Highly Congested, Complex
Urban Network
MASSACHUSETTS INSTITUTE
by
OF TECHNOLOGYZheng Wei
MAR 2 3 2010
Bachelor of Science in Automation (2008)
LIBRARIES
Tsinghua University, Beijing, China
Submitted to the Department of Civil and Environmental Engineering
in partial fulfillment of the requirements for the degree of
Master of Science in Civil and Environmental Engineering
at the
ARCHVES
MASSACHUSETTS INSTITUTE OF TECHNOLOGY
February 2010
@
Massachusetts Institute of Technology 2010. All rights reserved.
Author...
...
Department of Civil and Environment alAngineering
January 15, 2010 C ertified by ... ... . ...
Moshe E. Ben-Akiva
Edmund K. Turner Professor of Civil and Environmental Engineering
Thesis Supervisor
Accepted by ...
...
.
Daniele Veneziano
Chairman, Departmental Committee for Graduate Students
Critical Enhancements of a Dynamic Traffic Assignment
Model for Highly Congested, Complex Urban Network
by
Zheng Wei
Submitted to the Department of Civil and Environmental Engineering on January 15, 2010, in partial fulfillment of the
requirements for the degree of
Master of Science in Civil and Environmental Engineering
Abstract
To accurately replicate the highly congested traffic situation of a complex urban net-work, significant challenges are posed to current simulation-based dynamic traffic as-signment (DTA) models. This thesis discusses these challenges and corresponding so-lutions with consideration of model accuracy and computational efficiency.
DynaMIT-P, an off-line mesoscopic DTA model is enhanced. Model success is achieved by
several critical enhancements aimed to better capture the traffic characteristics in urban networks. A Path-Size Logit route choice model is implemented to address the overlapping routes problem. The explicit representation of lane-groups accounts for traffic delays and queues at intersections. A modified treatment of acceptance ca-pacity is required to deal with the large number of short links in the urban network. The network coding is revised to maintain enough loader access capacity in order to avoid artificial bottlenecks. In addition, the impacts of bicycles and pedestrians on automobile traffic is modeled by calibrating dynamic road segment capacities.
The enhanced model is calibrated and applied to a case study network extracted from the city of Beijing, China. Data used in the calibration include sensor counts and floating car travel time. The improvements of the model performance are indicated
by promising results from validation tests.
Thesis Supervisor: Moshe E. Ben-Akiva
Acknowledgments
First of all, I would like to express my heartfelt thanks to my research supervisor, Prof. Moshe Ben-Akiva for his constant encouragement and invaluable guidance during my graduate study at MIT. It has been a privilege to work with him. I am deeply grateful to Prof. Song Gao, University of Massachusetts and Dr. Yang Wen, Oracle Corp. for guiding me and being constant source of knowledge and inspiration. They have spent countless hours going through every detail of my work, giving me feedback on my research.
I would also like to thank my academic advisor Prof. Cynthia Barnhart, MST
program director Prof. Nigel H.M. Wilson, Kris kipp, Patty Glidden,and Tina Xue for all their help.
Thanks to Beijing Transportation Reseach Center (BTRC) and Liyun Zhu for their data and financial support. I am also thankful to the people who have worked on this study, my labmate Lang Yang, Fan Wei, and visiting students Hongliang Ma, Li Qu from Tsinghua University, Nale Zhao from Beijing Jiaotong University.
A special thanks goes to Dr. Yuelong Su from Tsinghua University for his help and
interest in my research.
During my studies in the U.S., I have acquainted myself with a lot of new friends in and out of MIT. I would like to express my thanks to them for making my life wonderful and memorable. They are: Tina Xue, Eric Huang, Maya Abou-Zeid, Cristian Angelo Guevara, Sujith Rapolu, Shunan Xu, Ying Zhu, Vikrant Vaze, Xin Zhang, Xiaoning Wang, Yinyin Zhu....
Finally, my deepest gratitude goes to my family, my parents and my wife Guannan Wang, for their love, understanding, constant support and encouragment. This work is dedicated to them.
Contents
Abstract 3 Acknowledgements 5 Contents 6 List of Figures 10 List of Tables 13 1 Introduction 151.1 Motivation and Problem Statement . . . . 15
1.2 Thesis Contribution . . . . 17
1.3 Thesis O utline . . . . 18
2 Literature Review 19 2.1 General Background of DTA Approach . . . . 19
2.2 Simulation-Based DTA . . . . 21
2.2.1 Macroscopic Models.. . . . . . . . 21
2.2.2 Microscopic Models... . . . . . . . 22
2.2.3 M esoscopic M odels . . . . 23
2.3 Congested Large-Scale Network Simulation . . . . 24
2.4 Calibration Algorithm... . . . . . . . . 27
3 Modeling Challenges and Solutions 3.1 Revised Route Choice Model ...
3.1.1 Logit route choice model . . .
3.1.2 C-Logit model . . . .
3.1.3 Path Size Logit Model (PSL) 3.1.4 Result . . . .
3.2 Lane-Group-Based Queuing Feature . 3.3 Treatments for Short Links . . . .
3.3.1 Increase the Minimum Speed
3.3.2 Dynamic Acceptance Capacity
3.3.3 Result . . . . 3.4 Centroid (Loader) Access Capacity
3.4.1 Adding Centroid Connector 3.4.2 Result . . . .
3.5 Variable Output Capacity . . . .
4 Off-4.1 4.2 4.3 4.4
line Model Calibration
Need for DTA Calibration . . . . Calibration Methodology . . . . Problem Formulation and Characteristics . Solution Algorithm . . . . 4.4.1 Algorithm Feature . . . . 4.4.2 Choice of the Gain Sequences . . .
4.4.3 Algorithm Process Description . . .
5 Case Study : City of Beijing
5.1 Introduction to DynaMIT-P . . . .
5.2 Network and Data . . . .
5.2.1 Surveillance Data . . . ...
5.2.2 Sensor Data Analysis . . . .
5.3 Calibration. . . . .. 31 . . . . . 32 . . . . . 32 . . . . . 33 . . . . . 33 . . . . . 36 . . . . . 38 . . . . . 43 . . . . . 44 . . . . . 46 . . . . . 48 . . . . . 51 . . . . . 52 . . . . . 55 . . . . . 57 59 59 61 61 63 63 64 65 69 . . . . 69 . . . . 7 0 .. . . . . . 73 . . . . 7 6 . . . . 7 8
5.3.1 Calibration Variables . . . . 78 5.3.2 Methodology... . . . . . . . . . . . .. 78 5.3.3 R esults . . . . 79 5.4 Application Analysis . . . . 84 6 Conclusion 89 6.1 Sum m ary . . . . 89
6.2 Future Research Directions... . . . . . . . 91
A MATLAB Code for SPSA Algorithm 93
B Fit-To-Counts for Every Simulation Interval 105
List of Figures
1-1 Congestion Growth Trend in the U.S. (Source: Schrank and Lomax, 2009) 15
2-1 Structure of Generic DTA (Source: Balakrishna, 2006) The Overlapping Path Problem . . . .
Choice Probabilities for the Overlapping Path Network Path set for OD pair: 1616 - 1584 . . . .
Deterministic Queuing Model . . . .... Left-turn lane block the through and right turn traffic . Off-ramp block the through traffic on the freeway . . . Group of lanes according to turning movement . . . . .
A complicated interchange with short links . . . . A Typical Freeway Short Link #372 . . . .
Density Change on Short Link #372 . . . .
Speed Change on Short Link #372 . . . .
Flow Change on Short Link #372 . . . . Real world network of the area of interest . . . .
Computer representation of the area of interest . .
Simulation result of the artificial bottleneck . . . . Compare of the network with-and-without connecter Density change on link 419 (ring road freeway) . . . . . Density change on link 420 (off ramp) . . . . Severe interferences from non-motorized . . . .
. . . . 34 . . . . 35 . . . . 37 . . . . 38 . . . . 40 . . . . 41 . . . . 42 . . . . 44 . . . . 49 . . . . 50 . . . . 50 . . . . 51 . . . . 53 . . . . 53 . . . . 54 . . . . 55 . . . . 56 . . . . 56 . . . . 57 3-1 3-2 3-3 3-4 3-5 3-6 3-7 3-8 3-9 3-10 3-11 3-12 3-13 3-14 3-15 3-16 3-17 3-18 3-19
4-1 Off-line calibration framework (Source: Balakrishna R. , 2006) . . . . 60
4-2 SPSA Algorithm Workflow . . . . 67
5-1 Network V/C ratios of morning peak on a weekday, 2007 . . . . 71
5-2 Study area (within the black rectangle) . . . . 72
5-3 Frequent on- and off-ramps . . . . 72
5-4 Deployment of RTMS detectors . . . . 74
5-5 Coverage of FCD system . . . . 74
5-6 Network of the study area . . . . 75
5-7 Locations of inconsistent RTMS detectors (1) . . . . 76
5-8 Locations of inconsistent RTMS detectors (2) . . . . 77
5-9 Trend of objective value for 530 iterations . . . . 81
5-10 Calibration results for the peak periods . . . . 82
5-11 Fit to counts analysis . . . . 83
5-12 Fit to link travel time analysis . . . . 83
5-13 Fit to path travel time analysis . . . . 85
5-14 Application analysis in TianNingSi Area, 7:00AM . . . . 86
5-15 Application analysis in XiZhiMen Area, 7:15AM . . . . 87
B-1 Fit-To-Counts for 6:30 to 7:00 . . . . 105
B-2 Fit-To-Counts for 7:00 to 8:00... . . . . . . . . 106
B-3 Fit-To-Counts for 8:00 to 9:00... . . . . . . . 107
List of Tables
3.1 Path Choice Probabilities Before/After PSL Enhancement . . . . 36
3.2 Typical Lane Groups for Analysis(Source: HCM 2000) . . . . 43
5.1 Inconsistent Observed Counts from RTMS detectors . . . . 78
5.2 Starting values of model fit . . . . 80
5.3 Overall calibration results . . . . 81
5.4 Fit-to-counts by time interval . . . ... 84
Chapter 1
Introduction
1.1
Motivation and Problem Statement
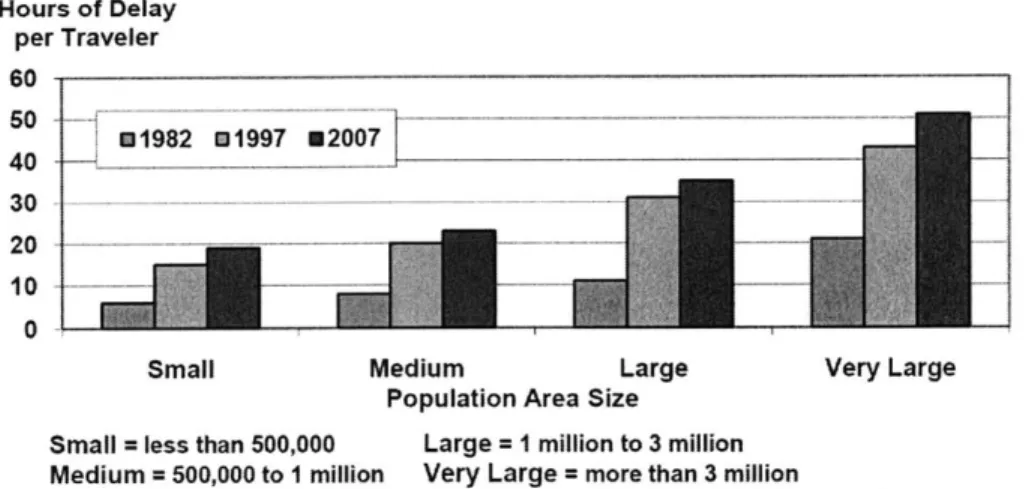
Demand for urban trips continues to grow as population increases, particularly in metropolitan areas. According to the Traffic Congestion and Reliability Report (FHWA, 2005), congestion has grown substantially throughout the U.S. over the past 20 years, regardless of city size. The 2009 Urban Mobility Report (Schrank and Lomax,
2009) estimates that, " In 2007, congestion caused urban Americans to travel 4.2
bil-lion hours more, resulting an extra 2.8 bilbil-lion gallons of fuel for a congestion cost of
$87.2 billion, an increase of more than 50% over the previous decade "
Hour per 60 50 40 30 20 10 0 s of Delay Traveler 81982 01997 82007 ... ... ....- ---- - - - - --... -... - - --
-Small Medium Large Very Large
Population Area Size
Small = less than 500,000 Large = I million to 3 million Medium = 500,000 to I million Very Large = more than 3 million
Traffic congestion poses a number of environmental, social and economic chal-lenges for major cities around the world. The construction of new roads to increase capacity has not kept pace with the continual growth in vehicle ownership and travel demand due to physical and economic constraints. Therefore, Advanced Traffic Man-agement Systems (ATMS) and Intelligent Transportation Systems (ITS) are attract-ing increasattract-ing attention. The design, operation and management of these traffic systems in metropolitan areas call for traffic network model that can address large-scale congested urban traffic networks. A large-large-scale congested urban traffic network is generally marked by the following characteristics:
a) Large number of directional links, usually in the thousands or more;
b) Large number of relatively short links, at-grade intersections and separate-grade
interchanges;
c) Closely-spaced on- and off-ramps connecting elevated roadways and surface roads;
d) Severe congestion with queues and spillbacks frequently occurring in the
net-work;
e) Complex mixed traffic interaction. Motorized vehicles receive significant inter-ference from non-motorized traffic at intersections.
Each of these characteristics may pose extra challenges that only sophisticated models, retaining certain corresponding feature can handle.
While rough estimates of traffic impacts from a conventional static traffic as-signment model might be adequate for the analysis of major infrastructure changes, models that can capture the dynamic nature of both the travel demand and traffic flow are required to evaluate demand management and traffic control strategies, such as high-occupancy-vehicle (HOV) or high-occupancy-toll (HOT) lanes and congestion pricing. One of the critical components of such models is known as Dynamic Traffic Assignment (DTA). Unfortunately, until recently, real-world DTA applications have
been limited in highway networks, which are relatively simple with relatively small number of links and low congestion level. There have been some attempts to deal with either congestion problems (Barcelo and Casas, 2003; Dittberner and Kerns, 2002; Ido and Prashker, 2009; Kaysi et al., 2003; Tong and Wong, 2000; Varia and Dhingra, 2004; Xu, 2009a) or large-scale networks (Caliper Corporation, 2009; Mahut, 2009; Wen, 2009). But few of them are tested and validated on networks that are both large-scale and heavily congested (Ben-Akiva et al., 2010).
This has motivated the attempt to better understand and to solve the problems that prevent current DTA models from replicating the urban traffic situation realis-tically within reasonable running time. Several key elements and enhancements that are critical to DTA applications in large-scale congested urban network were identified and implemented in this thesis.
A case study on a traffic network in Beijing, China was used to demostrate the
modelling process and to validate the enhancements identified in this thesis. The Bei-jing network is large and heavily congested. Without model enhancements, attempts to calibrate the model in order to replicate the real-world traffic situation failed be-cause of the emergence of non-existing gridlock in the simulation. After implementing the discussed enhancements, the gridlocking problem was resolved and the enhanced model was successfully calibrated using the observed data.
1.2
Thesis Contribution
The main contribution of this thesis is in the identification of an array of important modeling features that are required for the application of DTA models in large-scale congested urban networks, which include:
i) An enhanced route choice model which can account for overlapping routes to address the identified route choice bias on freeways.
ii) Explicit representations of lane groups and lane based queuing models to prop-erly model traffic queues and spillbacks;
iii) The ability to handle a large number of short links without the artificial modi-fication of their geometric representation;
iv) Revised network coding to avoid artificial bottlenecks by maintaining enough centroid (loader) access capacity;
v) The impacts of bicycles and pedestrians on auto traffic, modeled by calibrated dynamic road segment capacities.
Although, DynaMIT-P was used (as described in Section 5.1 and Appendix A of Balakrishna (2006)) and enhanced for the modeling of the case study, the fea-tures aforementioned are generally applicable to most current simulation-based DTA frameworks. The methodologies and conclusions in the discussion are by no means specific to DynaMIT-P, and can be generalized to a wider range of DTA models.
1.3
Thesis Outline
The remainder of this thesis is organized as follows. Chapter 2 presents a detailed review of simulation-based DTA and applications on real world networks. Then the problems encountered during the simulation of a highly congested large-scale urban network and the corresponding enhancement solutions are discussed in Chapter 31.
The model calibration methodology is presented in Chapter 4. Chapter 5 is a case study in the city of Beijing, China, where DynaMIT-P, a state-of-the-art simulation-based DTA system with a mesoscopic traffic (supply) simulator, is calibrated suc-cessfully by applying the model enhancements discussed here. A traffic management case analysis is presented after using the calibrated model. Finally conclusions and direction for future research are discussed.
'Chapter 3,4,5 are based on the research in paper: Ben-Akiva, M., S. Gao, Z. Wei and Y. Wen.
Chapter 2
Literature Review
This chapter reviews current simulation-based DTA models and their applications, with focus on congested large-scale networks. The general background of DTA sys-tems will also be briefly reviewed.
2.1
General Background of DTA Approach
Enabled advancements in technology and computational power, DTA is a high-fidelity
model designed to replicate and predict complex traffic phenomena. Peeta and Ziliaskopoulos (2001) offers a comprehensive review of the research on DTA models. Figure 2-1
presents a generic DTA model structure(Balakrishna, 2006), which consists of two main components (see, e.g., Cascetta, 2001; Florian et al., 2001):
1) A demand model with the ability to determine the path-dependent flow rates
of paths in a network. This model estimates and predicts OD flows and drivers' decision, and subsequently converts the aggregate OD flows into individual vehicles
(a.k.a. packets), which are used as input for the supply model.
2) A supply model capable of performing network loading. This model explicitly simulates the interaction between demand and the network, reproducing measure-ments such as time-dependent flow, travels times, and queue lengths.
DTA captures complex traffic dynamics and replicates traffic phenomena using
Model Input and Parameters
Demand Spl
Origin-Destination(OD) Network
flows interactions Traffic control Route ChoiceInietadevt
Response to informciensindevn
Output
Traffic Conditions
Figure 2-1: Structure of Generic DTA (Source: Balakrishna, 2006)
All DTA approaches developed up to this point can be categorized into four classes
based on the nature of the modeling and solution frameworks:
(1) Mathematical programming;
(2) Optimal control;
(3) Variational inequality (VI);
(4) Simulation-based.
Models in groups one through three are considered analytical models, which gener-ally contain mathematicgener-ally proven prosperities that provide insights into their capa-bilities. While analytical models are mathematically rigorous, they rely on simplified assumptions to account for traffic dynamics, making them unsuitable for large-scale real-world applications focused on traffic congestion and management. (see, e.g., Balakrishna, 2006; Peeta and Ziliaskopoulos, 2001; Wen, 2009; Ziliaskopoulos et al., 2004)
Effective large-scale, real-world applications require models that capture the stochas-tic characterisstochas-tics of traffic dynamics in detail, by estimating and predicting OD flows, travel times, queues and spill-backs. These capabilities are generally beyond that of
existing analytical models, and therefore, simulation is required. The rest of Chap-ter 2 reviews state-of-art simulation-based dynamic traffic assignment models. Their applications are also discussed.
2.2
Simulation-Based DTA
There are three types of simulation-based DTA models, which are distinguished, based on the level of detail with which they represent the studied system. They range from Macroscopic to Microscopic as follows:
o Macroscopic (Low Fidelity); o Mesoscopic (Middle Fidelity); o Microscopic (High Fidelity);
To begin with, macroscopic models treat traffic in an aggregate manner, such as a uniform or homogeneous flow, without considering each consitituent part (individual vehicle). They propagate approximate flows throughout the network using physical concepts or analytical methods. Microscopic models depict individual entities, de-cisions and interactions with a high degree of detail. Each vehicle maneuvers at a specific simulation time step based on estimates derived from a list of driving be-havior models, such as car following, lane changing, merging and yielding models. Mesoscopic models combine elements from microscopic and macroscopic approaches. While they represent individual vehicles with a high degree of detail, mesoscopic mod-els depict the activities and interactions of each vehicle with less detail, in comparison to a microscopic model.
2.2.1
Macroscopic Models
Early macroscopic DTA models, such as the LWR model (Lighthill and Whitham,
1955; Richards, 1956) applied physical methodologies such as fluids theory in
differential equations. While analytical methods are usually used to solve these equa-tions, they lack the ability to evaluate the interaction between vehicles and roads, leading some macroscopic DTA models to include simulations.
The common way of macroscopic simulation-based DTA is to discretised road section into cells. In Daganzo's Cell Transmission Model (Daganzo, 1994, 1995), the volume of vehicles that can cross cell boundaries at each time step is calculated using a density function on the upstream and downstream cell. The simulation tracks vehicles in each cell, recording their behavior at each time step. Another macroscopic simulation model, METACOR, which is an analytical continuum model, developed by Payne (1971) employs a similar method to describe the propagation of vehicle flows (Elloumi and et al., 1994; Papageorgiou and et al., 1989).
These macroscopic models have become increasingly popular, thanks to their ef-ficient and easy implementation with other traffic measurement systems already in-stalled in major urban areas and motorways.
2.2.2
Microscopic Models
Microscopic models depict traffic at a high degree of detail, explicitly modeling in-dividual vehicles and their interactions with each other and the road infrastructure. Thus the models' dynamic variables, such as the position and velocity of a single vehicle, represent microscopic properties. Models that govern vehicle behavior in-cluded, but are not limited to, a car-following model, a lane changing model, and a route-choice model. In addition, traffic controls, including signal operation, loca-tion and traffic detectors, are also modeled in detail. However, microscopic mod-els often require a large amount of data and the detailed calibration of model pa-rameters, which is very time consuming, and have high computational resource de-mands. Examples of microscopic models include VISSIM (PTV, 2005), AIMSUN/2 (Barcelo and Casas, 2003), Paramics (Smith and S. Druitt, 1994),and MITSIMLab (Ben-Akiva et al., 2002b), etc.
2.2.3
Mesoscopic Models
Mesoscopic models generally describe traffic entities at a high level of detail, but describe the behavior and interactions of these entities at a lower level of detail.
These models can vary in form depending on how they simulate traffic. One way is to group vehicles into packets, and then route those packets through the network (CONTRAM, Leonard et al., 1989). The packet of vehicles acts as one entity, sharing the speed derived from the speed density function defined for each link, and the density on the link at the moment of entry.
Another popular mesoscopic paradigm is the queue-server approach used by some state-of-the-art models, such as: DynaMIT (Ben-Akiva et al., 1997), DYNASMART (Mahmassani et al., 2004), FASTLANE (Gawron., 1998), and DTASQ (Mahut, 2001). In this approach, road segments are modeled with a queuing and a moving part. The vehicles travel through the moving part with the speed calculated using a macroscopic speed-density function. As the vehicle moves through the segment, a queue-server transfers the vehicles downstream to another segment, or forms queues on the current segment, representing congestion. This approach combines the advantages of dynamic disaggregate traffic modeling (since the vehicles are modeled individually), with easy calibration and the use of macroscopic speed-density relationships. Signal controlled intersections can be modeled by adding gates at the end of segment that open and close according to the phase of the signal control. Adaptive signals can also be modeled (Tian, 2002). Another advantage of representing individual vehicles is the ability to model disaggregate route-choice, which is important for modeling en-route route choice and the use of traffic information and guidance in ITS systems to help drivers make plans.
Boxill and Yu (2000) presents a discussion of various traffic simulators.
Simulation-based models were first developed for the evaluation of ITS as a plan-ning tool to generate and test scenarios, optimize control, and forecast network behav-ior at the operational level. As rapid technological advancements, simulation-based
transporta-tion planning. An advantage to these models is the testing of new management strategies without interrupting real-world traffic. Examples of real-world applica-tions of simulation-based DTA models include: DynaMIT (Balakrishna et al., 2008;
Ben-Akiva and Ramming, 1998; Wen et al., 2006a), DYNASMART (Mahmassani and Hawas,
1997); (Mahmassani et al., 2004), VISTA(Ziliaskopoulos et al., 2004), DynusT (Chiu et al., 2008), Dynameq (Florian et al., 2005, 2006), AIMSUN (Barcelo and Casas, 2002, 2006) TRANSCAD (Caliper Corporation, 2009), INTEGRATION (Aerde et al., 1996),
METROPOLIS (de Palma and Marchal, 2002).
2.3
Congested Large-Scale Network Simulation
Over the past decade, congestion mitigation has become an important urban devel-opment concern, prompting research in simulation-based DTA to focus on the traffic modelling of congested situation. The following presents a detailed list of studies.
Tong and Wong (2000), employed a simulation-based approach to develop a method for bottleneck identification in congested capacity-constrained networks. They give a numerical example of a simple network with 6 traffic zones and 44 nodes to test the effectiveness of their approach.
Varia and Dhingra (2004) developed a supply and demand focused simulation-based DTA model for congested urban road networks that was validated on a network with 14 nodes and 38 links.
Barcelo and Casas (2003), presents AIMSUN, a microscopic simulation model, for the Borough of Amara in the city of San Sebastian. The network studied is comprised of 365 road sections with 100 junctions and intersections. 24 of the 100 junctions and
intersections are signalized. There are also 13 centroids de?ning 135 O-D pairs, and
15 traffic detectors tracking traffic flows. The evening peak period from 18:00-20:00
was used as the simulation horizon.
Dittberner and Kerns (2002) present a simulation project for the Pennsylvania Avenue area in Washington D.C., USA, with a discussion on the key methods applied in the simulation process.The study area includes 72 intersections and the model is
calibrated using speeds and counts.
Kaysi et al. (2003), applies DYNASMART to model the network of the greater Beirut area (GBA), Lebanon, in order to evaluate the impacts of Hot Spot Manage-ment (HSM).
Ido and Prashker (2009) developed a DTA model with the capability of evaluat-ing the travel-time and travel-path impacts of movevaluat-ing bottlenecks on network perfor-mance.
Xu (2009a), applied DynaMIT-P to analyze the dynamic congestion pricing model in the Lower Westchester County, NY network, using morning and evening peak hours as the simulation period.
These studies on congested situations all share a low-level network complexity. The models are tested on networks with comparatively few links and nodes. While there have been successfully deployed simulation-based DTA models on large urban network, such as TransDNA on Columbus, IN (8811 links) (Caliper Corporation,
2009), Dynameq on Tel Aviv (3700 links, 200,000 car demand/3 hours) and Ljubljana
networks (8500 links,180000 car demand/3 hours) (Mahut, 2009), these cases do not present high congestion levels. To the best of our knowledge, there have been no successful DTA applications in highly congested, large-scale urban networks.
There are three major difficulties in applying DTA systems to analyze congested large-scale networks : Computational Efficiency, Scalability, and Model Accuracy. The main challenge is the trade-off between Computational Efficiency and Model Accuracy. The processing time of a DTA system is highly sensitive to the scale of the problem, which is affected by the amount of links, nodes and demand. Studies in this field contain a wide range of approaches, from identifying computational bottlenecks for the overall DTA approach (Wen, 2009; Ziliaskopoulos et al., 2004), designing more effcient data structures and algorithms (Wen et al., 2006b; Ziliaskopoulos et al., 2004) to using distributed computing resources (Wen, 2009). However, the application of
DTA systems in real-world urban networks, generally requires high-fidelity between
the network respresentation and the actual network, which is often characterized
simulator that can handle dense traffic volumes.
Furthermore, there is a dilemma between high- and low-fidelity network repre-sentations. Low-fidelity models are more cost-efficient in terms of computational demands, developmental effort and maintenance. However, their representation of real-world traffic dynamics may also be less accurately, and even inadequte. High-fidelity simulation models, on the other hand, are usually more accurate, but are very computationally demanding. In addition, the potential level of accuracy is not always be realized because of the complexity of the system, which results in the large amount of parameters that require calibration.
As a common solution, researchers of DTA systems will make various levesl of traoffs between representational realism and computational effciency in the de-mand and supply models. This allows researchers to have an adequately realistic rep-resentation of traffic dynamics and the computational ability to analyze large-scale networks.Several major DTA model studies (Ben-Akiva et al., 2001a; Mahmassani, 2001; Mahut, 2001; Taylor, 2003) have applied mesoscopic supply simulation models, which represent single vehicle movements using aggregate traffic flow relationships, instead of microscopic models.
A second major difficulty in applying DTA for large-scale congested urban
net-works is the realistic representation of traffic congestion. As mentioned before, many characteristics of urban networks such as complicated intersections, short links, and route choice are challenging to model. For example, non-motorized traffic, such as bicycles and pedestrians, often create significant interferences at intersections, espe-cially in developing countries. If a DTA model does not account for this phenomenon, congestion levels at intersections are likely to be misrepresented and underestimated. Vice versa, if short links and segments (the link length is comparable to that of a car) are inadequately represented, false queues and spillbacks may result. In addition, frequent on- and off-ramps in a network create a large amount of weaving sections. Models that do not distinguish between lane-based movements are likely to forecast non-existent traffic jams. Furthermore, when a slight overestimation of traffic flows on a route could transition the simulated traffic from a stable to an unstable stage,
any error in route choice modeling can also lead to non-existent congestion in the simulation. Therefore, in order to eliminate unrealistic gridlocks from occurring in a DTA model, these complications need to be addressed (Ben-Akiva et al., 2001a; Hughes, 2002; Ziliaskopoulos et al., 2004).
2.4
Calibration Algorithm
To accurately represent congestion, the model calibration requires real data. Usually, model inputs such as Origin-Destination (O-D) flows and a priori parameters (e.g., socio-economic characteristics, speed-density relationships for the segments or links) for different networks have different values, and are obtained from archived data. This process is referred to as the calibration of DTA models. Peeta and Ziliaskopoulos (2001) showed that the estimation and prediction of time-dependent O-D demand is one of the most difficult tasks when trying to apply DTA as a planning tool.
This thesis applies a calibration algorithm in addressing a complex congested traffic network that is highly non-linear, stochastic, and large-scaled. There are no explicit analytical relationship between the objective function with the parameter to be calibrated, making analytical derivatives with respect to the parameters difficult to achieve.
Balakrishna (2006) summarized the optimization algorithms that are potentially suitable for large-scale, non-linear problems with implicit expressions into three cat-egories: path search methods, pattern search methods, and random search methods. The main difference between these three is how to decide the search direction. The path search method searches along a path. In each moving step, the decision vector moves forward by a certain distance in a particular direction. Usually, the function gradient can be derived as the direction of movement. If analytical derivatives are not available, certain measurements can be used to estimate the derivatives before the subsequent step. Path search methods include: SNOBFIT (Huyer and Neumaier,
2006), FDSA (Kiefer and Wolfowitz, 1952) and SPSA (Spall, 1992, 1999, 1998), etc.
determine the direction of movement for each step. It is suitable for problems in which the analytical derivative is hard to achieve because of the existence of implicit relationships. The effectiveness of pattern search algorithms are very sensitive to the efficiency of the objective function evaluation. Usually, the objective function needs to be evaluated several times before achieving a new pattern, making the pro-cess time consuming and inappropriate for large-scale problems. The Box-Complex method(Box, 1965), Nelder-Mead method (Nelder and Mead, 1965) and Hooke and Jeeves method (Hooke and Jeeves, 1961) are three typical pattern search methods.
In the random search methods,the search is performed using the entire feasible space. The decision vector is updated using probabilistic mechanisms that try to achieve optimality. Examples of random search methods include: Simulated an-nealing (Corana et al., 1987; Metropolis et al., 1953) and Genetic algorithms (GA) (Goldberg, 1989; Holland, 1975).
Xu (2009a) presents a detailed review and comparison of these optimization algo-rithms. While traffic assignment model calibration itself has drawn more attention (see, e.g., Balakrishna, 2006; Kunde, 2002; Mahut et al., 2004), few researchers have focused on specific issues in large-scale congested urban networks.
Although using the appropriate calibration method is crucial for modeling success, it is more critical to enhancement traffic models with the capability to handle specific issue since a model without the necessary features to address the full complexity of urban networks could potentially cause additional difficulties during the calibration.
2.5
DTA Model Enhancement
Boxill and Yu (2000) and Smart Project(1997) have identified limitations within the
ITS framework for traffic simulation. These include the inability to appropriately
simulate the congestion, environmental impact and safety, as well as computational inefficiency, etc.
Over the past decade, traffic assignment models have been greatly enhanced to meet practical requirements. A comprehensive example is INTRAS, a microscopic,
stochastic simulation model, which was reprogrammed and enhanced to include ge-ometric and operational capabilities such as lane type, ramp metering, surveillance system, driver habits and warning signs, etc. and employs car following and lane-changing models. The new version is renamed as FRESIM and has the ability to realistically simulate freeway traffic and operations features (FHWA, 2005).
DYNASMART (Dynamic Network Assignment simulation Model for Advanced Road Telematics), a traffic assignment and optimization tool was enhanced and re-named DYNASMART-X. In DYNASMART-X, advanced network algorithms were combined with the modeling of the trip-maker's behavioral response to guidance generated in a simulation(Mahmassani et al., 2004). The most recent updates in DYNASMART-X improved the network editing interface, and its ability to capture large scale networks. Finally, a GIS importer was also incorporated into the simulator. MITSIMLab(Ben-Akiva et al., 2002b), a microscopic traffic simulator developed
by the MIT ITS program, has enhanced urban modeling capabilities for unsignalized
intersections and roundabouts, drivers path awareness, and signal control and public transportation (Ben-Akiva et al., 2001b) . The enhancements were validated using a case study conducted in Stockholm, Sweden.
Together with advancements in computational power, the simulation can run faster than before on a single CPU. However, it still lagged far behind in terms of the increase in network scale and traffic demand. As a result of the increased demand in effective congestion mitigation tools, researches in efficient traffic assignment model and model scalability have drawn increasing attention. Several traffic simulators, such as DynaMIT, TRANSIMS, AIMSUN and PARAMICS have been enhanced through parallel implementations. Wen (2009) provides a comprehensive review.
The traffic assignment model were developed with the main purpose of replicat-ing real-world traffic situations for better traffic management, such as the accurate prediction and simulation of congestion and queues formulation in order to identify bottlenecks. Many of the enhancements that have been incorporated into current traf-fic assignment models to deal exclusively with congestion involve route choice model, queuing model, capacity model,etc. The challenges in modeling congestion include
how to handle queue spillbacks, and the interaction between queuing vehicles and moving vehicles within a single road segment. Chiu et al. (2008) implemented a lane group structure in AMS, a mesoscopic simulator, to account for the spillback from the downstream segments, which artifficially impede traffic under highly congested situations.
Gentile et al. (2007) proposed a new DTA model for road networks, that explicitly addresses queue spillovers. The proposed model combines spillback congestion into an existing DTA formulation.
Another way to enhance model capability is to incorporate congestion pricing models into the existing traffic assignment model framework. Using a discrete choice framework, Xu (2009a) developed a dynamic congestion pricing model, which was implemented in DynaMIT-P and subsequently improved the behavioral choice models. The model enhancement was validated on the Lower Westchester network in New York.
In summary, while the demand for tools to address traffic congestion have in-creased as a result of accelerated urban development, traffic assignment models that can adequately meet the needs of a large-scale, high-density urban network are still lacking. This thesis presents modeling processes, and a subsequent enhanced model that can replicate the traffic dynamics in a highly congested complex urban network.
Chapter 3
Modeling Challenges and Solutions
In a recent study on dynamic traffic assignment models and traffic simulation using DynaMIT-P for the city of Beijing (Ben-Akiva et al., 2010), researchers encountered gridlocking problem when the traffic demand was increased to reflect reality. Non-existent queues formed in lanes along the freeways and arterials. Few cars could get to their destination, and most of the sensor counts reported in the simulator were close to 0.
The study area in Beijing is a large urban network in an area of around 35 square miles, consisting of freeways, ramps, and signalized arterial roads. These roads are modeled as 3180 directed links. Some of them are unusually short - as short as 20 feet, which caused further complication in the simulation.
The traffic load for this network is also very heavy. On a typical weekday, the model reproduces roughly 630,000 vehicles traveling within the study network between
6:00 AM to 10:00 AM. Severe congestion and spillbacks frequently occur throughout
the network. During peak hours, the traffic density in many areas approach jam density, resulting in extremely low speeds. Modeling such conditions is difficult be-cause the congestion is so severe that a small over-estimation in demand or a small under-estimation in supply would result in a grid lock.
Moreover, the mixed traffic conditions in Beijing are unparalleled by previous studies. Most urban residents commute via bicycle to and from work, accounting for a large portion of the traffic. In 2007, the total volume of bicycles in Beijing was
approximately 50.94 million (Sun, 2009). The mix and interaction of different trans-portation modes result in capacity reductions and intersection delays. This thesis is motivated by the need for a model that can properly simulate such a network and address the current model limitation for better traffic management. The remainder of this chapter discussses the identified problems identified and the corresponding enhancement solutions for these specific network modeling problems. Furthermore, generalizations of these challenges and solutions applicable to all traffic network mod-eling cases with similar large-scale, highly congested characteristics are presented.
3.1
Revised Route Choice Model
DynaMIT-P was used for the modelling of the Beijing case study. Model input in-cludes the traffic network of the study area, dynamic OD flows, Speed-Density rela-tionship parameters for each segment and the route choice parameter. From the initial simulation results, which were obtained before any model enhancements, we observed excessive congestion on the freeways (ring roads) but little flow on the parallel roads. The links on freeway usually experienced jam density and low speed near to 0, while most of the arterial roads had little traffic on them. A further analysis showed that route choices were biased toward the ring roads, and the adjustments to the route choice model parameters had little effect in mitigating the bias. An investigation on the current route choice model had to be done before any enhancements.
3.1.1
Logit route choice model
A Logit route choice model was initially adopted to calculate path choice probabilities
in DynaMIT-P. This model is simple but has a critical limitation in terms of the assumption that the error terms are identically and independently distributed (i.i.d.). Under the route choice context, this assumption requires that all alternatives have to be independent. A complex urban network like the Beijing network does not abide
by this assumption because there are a large number of overlapping paths that share
3.1.2
C-Logit model
In order to overcome such a problem, previous researchers proposed the addition of a deterministic correction term to the utility function for overlapping paths. The first attempt was made by Cascetta et al. (1996). A "commonality factor" (CF) term was added to the deterministic part of the utility that captures the degree of similarity between alternatives in the choice set. P,(i) - the probability of user n choosing path i among his/her individual choice set C,(i) - is defined in Equation 3.1:
eVin-CFin
Pn(i) eVn-CFjn (3.1)
jECn
3.1.3
Path Size Logit Model (PSL)
Motivated by the C-Logit model, Ben-Akiva and Ramming (1998) proposed the Path Size Logit Model (PSL) (see also Ben-Akiva and Bierlaire, 2003), which has a simi-lar form but uses a "Path Size" (PS) attributero correct for the utility for overlap-ping paths. The PS attribute was originally derived from the discrete choice theory for aggregate alternatives (Ben-Akiva and Lerman, 1985). Ben-Akiva and Ramming
(1998) defined the correction term PSin as the "size" of path i (see Equation 3.2):
PSin = la 1 (3.2)
aEFi .
Z
3aj 'ECnwhere li is the set of links on path i, la the travel time on link a, Li the total travel time on path i, Cn is the choice set of paths for individual n, and 3aj a binary
variable which equals 1 if link a is a part of path
j
and 0 otherwise. For a path not overlapping with any other path, the path size is 1, and the systematic utility is not adjusted. For a path partially overlapping with other paths, the path size is less than 1, and the systematic utility is adjusted downwards. For a path completely overlapping with J - 1 other paths (J being the size of the choice set Cn), the path size is 1/J. Once the PS attribute is defined, the utility associated with path i for individual n is adjusted as V, + In PSm, with the probability Pn(i) computed as inOverlapping Segment
of Path
1
and 2
Intermediate Node
Equation 3.3:
eVin+ln PSin Pn (i) = ' eVjn+lnPSin
jECn
(3.3)
Pn(i) ,C, and Vi, are similarly defined as in Equation 3.1.
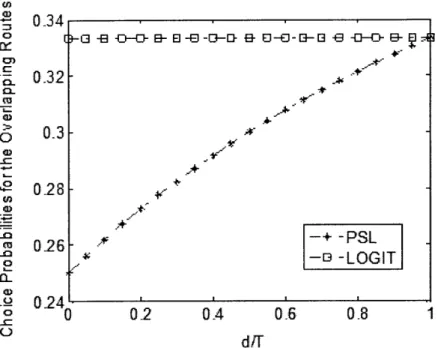
The example shown in Figure 3-1 was used by Ramming (2002) to illustrate the overlapping path problem and how the PSL choice compares against other model types, especially with MNL model. There are three paths with the same total travel time T. Path 1 and 2 overlap from the Origin Node to the Intermediate Node with an overlapping travel time of T - d. The MNL model predicts equal shares for the three paths, one third each. This is correct only when d = T, when there is no overlap.
The choice probabilities for the overlapping path (Path 1 or 2) are presented in Figure 3-2. The horizontal axis is the fraction of T that d represents. When the proportion approaches 0, that is d = T, Path 1 and 2 are the same physical path with
two separate "labels". In this case, we expect the combined choice probabilities for Path 1 and 2 to be 50%, and Path 3, the other physical path, should have a choice
Link T T =- T-d
Link T T =d
Path 1
OriinLink
T T
=d
Path 2
De0naton
Link TT =T
Path 3
C) 0- 34 0.32 a) 0-26 - ,-+-PSL . -13 -LOGIT S024 S 0 02 O.4 0-6 0.8 1 d/
Figure 3-2: Choice Probabilities for the Overlapping Path Network
probability of 50%. The PSL reflects our expectation, but the MNL model gives a flat choice probability of 33% which means that it is not sensitive to the overlap.
Now apply the above example in complicated urban networks. Consider a traveler is planning his/her route choice from home to work. The overlapping segment can be viewed as the freeway, and there are N different paths to the work place after getting off the freeway. In addition, he/she has the choice to use rterial roads the whole way. In an extreme case, assume all paths have the same total travel time, and the overlapping segment is long enough. We can expect 50% probability that s/he will choose the freeway, which concurs with the prediction generated by the PSL model. However, the MNL model will give a probability of N to the freeway, and a probability of to the arterial. This bias will lead to a non-existent higher demand for the freeway, and cause unrealistic congestion in simulation. N is potentially very large in a dense urban network and the bias could be very serious.
3.1.4
Result
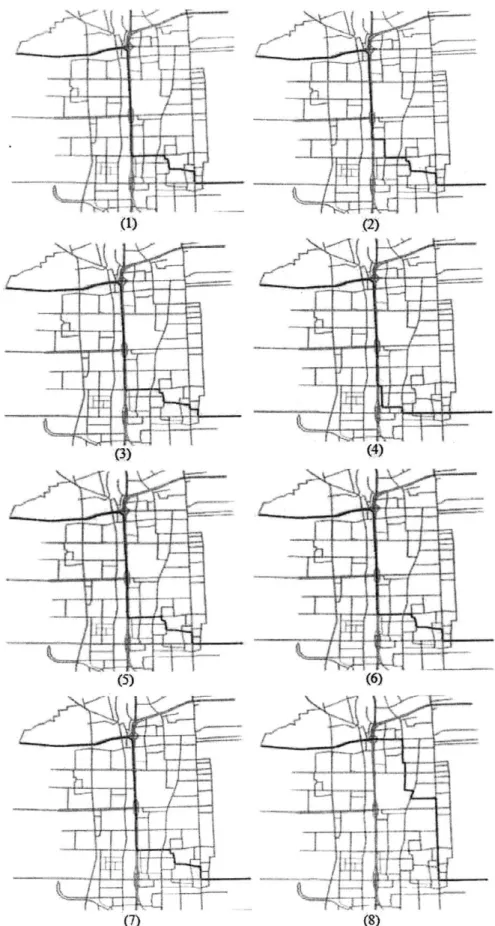
The bias mentioned in the previous section was verified in the simulation of the Beijing network. Figure 3-3 shows the path set generated by DynaMIT-P for a typical OD pair (1616-1584). There are 8 paths in the path set, 7 of which share the ring road (the freeway from north to south), except the 8th Path. Consequently, as discussed above,
it is very likely that the MNL route choice model over-predicted the probability of choosing paths containing ring road links, which led to unrealistic congestion along these roads. To prove the hypothesis, the path choice probabilities generated before and after the PSL model was enhanced, were calculated and are shown in Table 3.1 (the results may vary when the route choice parameter changes). Note that, before the enhancement, the probability of choosing a path containing the ring road is 98.74% (the sum of the probabilities of the first 7 paths). The probability of choosing the 8th path is only 1.26%. However, since the difference in average travel time between
the 8th path and other paths are not significant enough (781.4s vs. 735.1s) to cause
the traveller to refrain from choosing the 8th path, we should expect a much higher
probability for choosing the 8th path than the MNL model predicts here. Table 3.1: Path Choice Probabilities Before/After PSL Enhancement
Path No. Travel Time(s) I Path Size I Prob. Before I Prob. After
1 719.4 0.149 10.03% 2.61% 2 841.2 0.326 0.17% 0.22% 3 732.3 0.201 6.52% 3.10% 4 665.8 0.329 60.11% 76.49% 5 731.1 0.173 6.79% 2.39% 6 726.8 0.179 7.84% 2.95% 7 729 0.197 7.28% 3.32% 8 781.4 0.774 1.26% 8.93%
To correct for this bias, the route choice model was modified from MNL to PSL. The path choice probabilities after this enhancement are also shown in Table 3.1. The new results show a 8.93% probability of choosing a non-ring road path(the 8th path),
and among those who would use the ring road, more people would choose the path with shortest travel time (path No.4).
(1) (2)
(7) (8)
After this enhancement the gridlock situation in the Beijing case study was re-solved. In addition, we observed more realistic route choice behavior in terms of traffic flow and density distributions on the network.
3.2
Lane-Group-Based Queuing Feature
In the mesoscopic supply models used by some DTA systems (including DynaMIT-P), links are divided into segments in order to capture changing section geometries. Each segment may contain a moving part at the start of the segment and a dynamic queuing part at the end of segment. The length of the moving part and the queuing part may vary as the simulation proceeds. In the moving part, in-flow vehicles move at a certain speed governed by the speed-density relationship, which is propagated till the end of the queue. In the queuing part, (lane- or link-based) queues are formed following a queuing model.
time 0
Moving part Queuing part
miIe I
in- Ct - 2
timte t
Ving part Queuing part
w~
rnnwi
zz
- > Flow direction =
Figure 3-4: Deterministic Queuing Model
A deterministic queuing model is illustrated in Figure 3-4. (Ben-Akiva et al.,
2001a) During a period of time t, there are pt vehicles leaving the queue, where p is the output capacity of the segment. At time t, given that there is a vehicle reached
the end of queue, the position of the end of the queue is calculated as:
q(t) = go - l(pt - m) (3.4)
Where q0 is the position of the end of the queue at time t = 0, 1 is the average
length of vehicles(including headways), m is the number of moving vehicles between the vehicle being considered and the end of the queue at time t = 0, under the assumption that the position of the end of the upstream segment is 0. Note that the model is relevant only when 0 < q(t) < L, where L is the link's length. If q(t) < 0, then the queue has already dissipated by time t. The explicit spill-back
model guarantees that q(t) > L will never occur. When a vehicle is approaching the end of the queues in a segment, it will try to merge into a feasible lane that has the shortest queuing length. A set of feasible lanes for a given vehicle is defined as a set of lanes that can reach the downstream segment according to the vehicle's path to the destination.
In most conventional supply models, a dynamic queue is formed at the link level. The lane connections are simplified based solely on link connectivity. In other words, if two links are connected, all lanes on the upstream link are connected to those in the downstream link. DynaMIT was initially designed with the capability for flexible net-work representation (Ben-Akiva et al., 2001a), which allows lane-based queuing and the orgnization of lanes going in the same direction into lane groups. However, due to practical reasons, this feature was rarely utilized in previous DynaMIT applications. Most applications employed the link-based queuing model.
Liu et al. (2008) discussed the drawbacks in the link-based queuing model and proposed a set of lane-group-based macroscopic formulations to address them. One of these drawbacks is the blocking effects between different movements. Specifically, queues that spilled back from the downstream link can mistakenly be allowed to form in all lanes in the upstream link. For instance, the left turn queue may block the through and right turn traffic because the model will generate a single queue for the link, regardless of the turning movement (Figure 3-5). Chiu et al. (2008) also
presented the lane group structure in AMS, a mesoscopic simulator. This structure is designed to account for spillbacks from downstream links and ensure that vehicles located in turning bays do not artificially impede through traffic, unlike the link-based queuing moddel.
rn
TrT T R
Figure 3-5: Left-turn lane block the through and right turn traffic
The blocking effects may not be significant in typical highway models, where such intersections are rare. However, it can cause severe problems in the simulation of urban networks such as the one in Beijing. In such urban networks, lane restrictions at complicated intersections are commonly seen. Moreover, on- and off-ramps con-necting the freeways and side roads are often highly congested. Consequently, lane restrictions have significant impacts on the throughput of those intersections. If such restrictions are not modeled properly, unrealistic congestion caused by exit queues blocking through traffic could result in the simulation, as they did in our initial our case study.
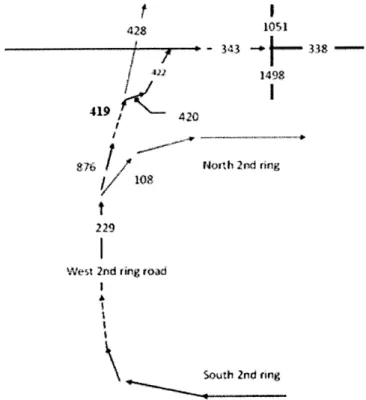
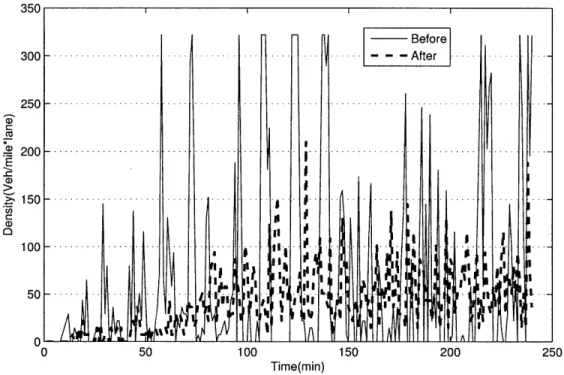
Figure 3-6 demonstrates a typical scene from the early stages of our study before a lane-group-based queuing feature being implemented. The segments with red color denote a jam density, while the green shows a segment with low traffic volumes. Due to the downstream spillback, segment 343 is filled up with queuing vehicles, showing a jam density with flow near to zero. The queue extended to segment 422 and segment 420. In this case, segment 420 is an off-ramp connected to freeway segment 419 with service road segment 422. Segment 419 consists of 3 lanes, while segment 420 only has one lane. The lack of lane groups classifications for segment 419 (only one lane group on 419) resulted in the spillback from segment 420 mistakenly form in all 3 lanes on segment 419. Therefore, the through traffic was blocked from getting
onto the downstream freeway segment 428. An unrealistic bottleneck formed in this area. The queue and congestion accumulated along the freeway and throughout the network. Finally, the traffic on most parts of the 2nd ring road became paralyzed in the simulation. 108~ 419 420 i r,
1/
r rrr o ~ d 2n So,-hO 2ndl nfieFigure 3-6: Off-ramp block the through traffic on the freeway
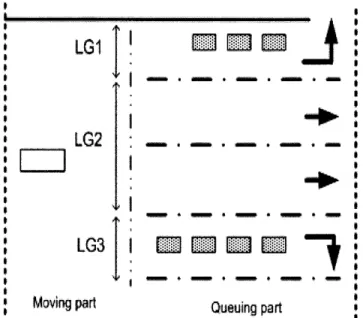
To address the aforementioned issue, our initial DTA model was enhanced to capture the lane restrictions through "lane groups". A lane group is defined as a set of lanes established at an intersection approach for separate capacity and level-of-service analysis (Highway Capacity Manual, FHWA (2000)). In a lane group model, lanes are grouped according to their specific turning movements. For example, Figure
3-7 shows an approach to an intersection with a queuing part that is comprised of
three lane groups: left only, through, and right only. No lane group is required for the moving part of the link in our model. The advantages of this representation are twofold: 1) the moving part is not over-complicated and capitalizes on the efficiency
of mesoscopic traffic simulation; and 2) the queuing part is based on lane groups and thus spillbacks onto one lane group will not mistakenly impact movements on other
LG3
LG IAM M 3EfAving pa Queuing part
Figure 3-7: Group of lanes according to turning movement
lane groups.
Most existing mesoscopic simulation studies employ link-level implementations of queues, and lane groups or similar constructs are rarely seen. This is probably because networks and lane restrictions for many previous studies were not complicated enough to entail the additional efforts (usually non-trivial) required for the implementation of explicit lane groups, such as determining the boundary of the moving and queuing part, grouping the lanes according to lane restrictions and setting demand capacities for each lane group.
To effectively apply the lane-group-based queuing feature, the construction of lane groups should accounts for both geometry changes and lane restrictions at intersec-tions. We generated the lane connections following the guideline given by the Highway Capacity Manual (HCM 2000). Table 3.2 shows the typical lane groups for analysis. For the Beijing study, with a queuing part based on lane groups, the mistakenly formed queues resulting from the limited capacity of another lane group were resolved, and a large number of unrealistic bottlenecks disappeared. This feature combined with the Path Size Logit model contributed significantly in resolving the unrealistic gridlocks generated in the simulations.
Table 3.2: Typical Lane Groups for Analysis(Source: HCM 2000)
3.3
Treatments for Short Links
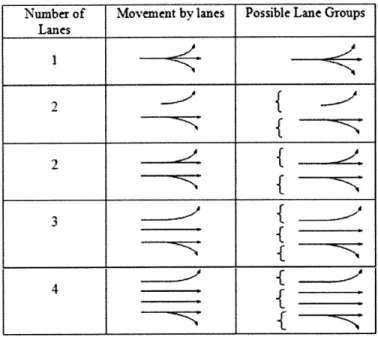
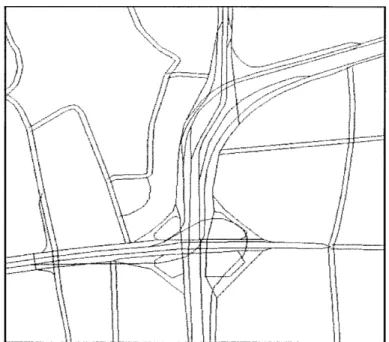
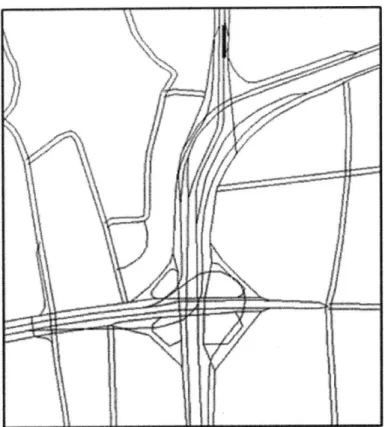
As it is in the Beijing network, short links are not uncommon in the traffic simulation. See Figure 3-8 for an example of a complicated interchange with short links in the Beijing network. Short links are known as links with relatively short length, usually that of a fer cars and sometimes even shorter than the length of one car. Short links in traffic simulation can be generally divided into two categories: 1) the short links exist in the real-world network; 2) the short links do not exist in the real-world network. Examples of the first group are links at an at-grade intersection, connecting two same-direction roadways separated only by a divider, or the links connecting different direction roadways to capture turning movement(such as u-turns). In this case, the short links usually occur on intersections and ramps.
Short links that do not exist in the real-world network are usually generated dur-ing the network coddur-ing process to capture geographic feature, such as the curvature of the roadway. While some state-of-the-art simulators like DynaMIT can represent link curvature with an additional "Bulge" attribute for the link and it is unnecessary
Number of Movement by lanes Possible Lane Groups Lanes