HAL Id: hal-02620152
https://hal.inrae.fr/hal-02620152
Submitted on 25 May 2020
HAL is a multi-disciplinary open access
archive for the deposit and dissemination of
sci-entific research documents, whether they are
pub-lished or not. The documents may come from
teaching and research institutions in France or
abroad, or from public or private research centers.
L’archive ouverte pluridisciplinaire HAL, est
destinée au dépôt et à la diffusion de documents
scientifiques de niveau recherche, publiés ou non,
émanant des établissements d’enseignement et de
recherche français ou étrangers, des laboratoires
publics ou privés.
Distributed under a Creative Commons Attribution| 4.0 International License
Camille Buscail, Judith Gendreau, Paul Daval, Pierre Lombrail, Serge
Hercberg, Paule Latino-Martel, Chantal Julia
To cite this version:
Camille Buscail, Judith Gendreau, Paul Daval, Pierre Lombrail, Serge Hercberg, et al.. Impact of
fruits and vegetables vouchers on food insecurity in disadvantaged families from a Paris suburb. BMC
Nutrition, BioMed Central, 2019, 5 (1), �10.1186/s40795-019-0289-4�. �hal-02620152�
R E S E A R C H A R T I C L E
Open Access
Impact of fruits and vegetables vouchers
on food insecurity in disadvantaged
families from a Paris suburb
Camille Buscail
1,2*, Judith Gendreau
1,2, Paul Daval
3, Pierre Lombrail
2,4, Serge Hercberg
1,2,
Paule Latino-Martel
1and Chantal Julia
1,2Abstract
Background: Social inequalities in nutrition lead a high number of families to struggle with food insecurity, even in developed countries. We aimed to assess the impact of fruits and vegetables vouchers on food security among disadvantaged households from a Paris suburb.
Methods: We used a pre-post assessment design. Families answered face-to-face questionnaires on food consumption and food security status before and after a randomly assigned intervention. Households in the intervention group received vouchers to buy exclusively fruits and vegetables over one year. Both intervention and control groups benefitted from nutritional education through workshops performed by dieticians during the study period. The Household Food Security Module (HFSM) was used to assess food security status of households at inclusion. Food Insufficiency Indicator (FSI) was used to assess food security at inclusion and follow-up. Evolution of FSI on both groups was evaluated using McNemar test.
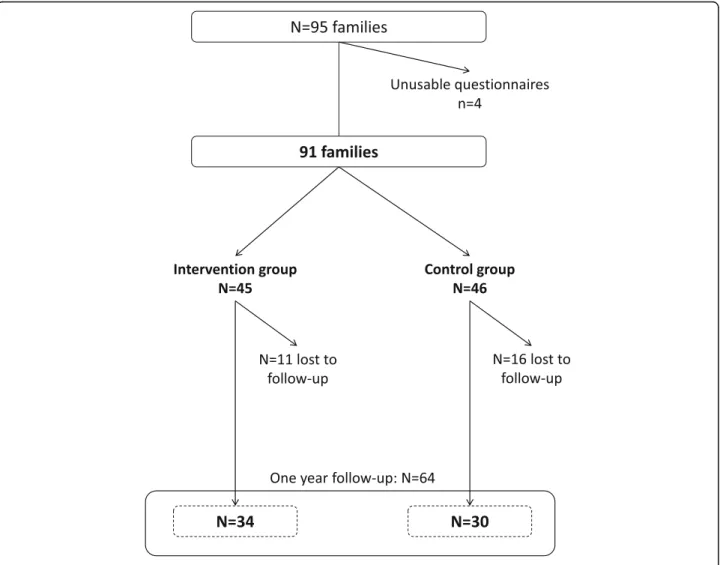
Results: Among the 91 families included between May 2015 and May 2016, 64 completed the post assessment questionnaire. At inclusion, 68.3% of families were experiencing food insecurity and 78.1% were experiencing food insufficiency. No association was found between food consumptions and food security status. After one-year follow-up, the prevalence of food insufficiency was significantly decreased in the intervention group (61.8%, with p value = 0.03), and unchanged in the control group.
Conclusion: In this pilot study, food insufficiency was significantly decreased in families receiving vouchers for fruits and vegetables over a one-year period.
Trial registration:NCT02461238, registered 3 June 2015– Retrospectively registered, https://clinicaltrials.gov/ct2/ show/NCT02461238
Keywords: Food insecurity, Food vouchers, Community-based participatory research Background
The Food and Agriculture Organization (FAO), stated that food security exists “when people at all times, have physical, social and economic access to sufficient, safe and nutritious food that meets their dietary needs and
food preferences for an active and healthy life” [1]. Con-versely, food insecurity (FI) occurs when people cannot have access to food according to the criteria defined above [1, 2]. FI is associated with low diet quality and adverse health effects in both adults and children [3–11]. In France, like in many developed countries, disadvantaged families are more likely to experience FI [12–16]. Accord-ing to a study performed in the French general population in 2016, 11% of adults and 12% of children had experi-enced FI over the last 12 months [17], and these preva-lence were increased compared to those of a similar study performed 10 years before [12,13]. Despite a considerable
© The Author(s). 2019 Open Access This article is distributed under the terms of the Creative Commons Attribution 4.0 International License (http://creativecommons.org/licenses/by/4.0/), which permits unrestricted use, distribution, and reproduction in any medium, provided you give appropriate credit to the original author(s) and the source, provide a link to the Creative Commons license, and indicate if changes were made. The Creative Commons Public Domain Dedication waiver (http://creativecommons.org/publicdomain/zero/1.0/) applies to the data made available in this article, unless otherwise stated.
* Correspondence:c.buscail@eren.smbh.univ-paris13.fr
1Equipe de Recherche en Epidémiologie Nutritionnelle (EREN), Université
Paris 13, Inserm U1153, Inra U1125, Cnam, Centre de Recherche en Epidémiologie et Biostatistiques (CRESS) Sorbonne Paris Cité, Bâtiment SMBH -74 rue Marcel Cachin, 93017 Bobigny cedex, France
2Département de Santé Publique, Hôpital Avicenne (AP-HP), 125 rue de
Stalingrad, 93000 Bobigny, France
web of food aid structures– more than 250 were identi-fied during a study performed in France in 2012 among the beneficiaries of food aid– a large number of disadvan-taged households are exposed to FI [18–20]. Besides, FI is not entirely explained by financial constraints [12,21].
In line with previous studies, the INCA2 study per-formed among the French general population showed that surveyed households with FI were mainly made of women and/or young people, facing barriers other than money to reach food security [13]. This indicator seems therefore relevant to be assessed beyond usual poverty markers.
Several studies assessing the impact of specific food vouchers on nutritional behaviour among disadvantaged population have been conducted in Europe, USA, and New-Zealand [22–28]. Overall, they show positive re-sults on dietary habits, particularly when supported by a nutritional education program. In the USA, the main current nutritional support programs (including WIC, SNAP and CEP) have shown their effectiveness in redu-cing the prevalence of FI [29–34]. In France, to the best of our knowledge, no work has evaluated the impact of a nutritional support program on food insecurity. The pilot interventional study “Fruits et légumes à la Mai-son” (FLAM) was conducted in a Paris suburban city. It primarily aimed to assess the impact of fruits and
vegetables vouchers and nutritional education over a one-year period on fruits and vegetables consumption among children from low-income families. The purposes of this ancillary analysis of the FLAM study were to 1) describe food insecurity prevalence and its association with sociodemographic characteristics and food con-sumption, and 2) determine whether the intervention improved food security among FLAM participants.
Methods
Study design
The study design has been fully described elsewhere [35]. Briefly, we used a pre-test - post-test design for this inter-ventional study, and participants were randomized in a control group or in an intervention group at inclusion (Fig.1). The study took place in Saint-Denis (Seine-Saint--Denis county, Ile-de-France region, France), a disadvan-taged suburb city of Paris. The intervention group received at home, during one-year period, vouchers allowing exclu-sively the purchase of fruits and vegetables (including fresh, canned or frozen vegetables and 100% fruit juices). The amount of the vouchers was proportional to the size of the household, ranging from 12€ per month for single-parent families with one child, to 24€ per month for households made of at least 4 persons. In parallel, each group were
proposed to participate to nutritional and culinary work-shops performed by dieticians in their neighbourhood. Inclusion criteria
Families with at least one child aged from 3 to 10 years old, living in the northern districts of Saint Denis were eligible to the study. For families with several children matching with the age criterion, we included the child with the closest anniversary birth date (regarding the in-clusion date). In addition, adult participants had to be unemployed, or benefit from social minima (Active Soli-darity Income, Allocation of minimum pension) or any income-terms allowance, or have incomes below the poverty line. The poverty line threshold was defined using the French National Statistical Institute (INSEE) according to the French incomes data (that is, 1234€ per month rounded up to 1300€ for a single-parent house-hold with at least one child aged under 14 years old, and 1777€ per month rounded to 2000€ for a couple with at least one child aged under 14 years old) [36, 37]. Finally, French language had to be well spoken and understood by participants.
Data collection
Data were collected via face-to-face questionnaires ad-ministered by trained interviewers at inclusion, after 6 months and one year. Volunteer families were inter-viewed at community centres, or at home in order to sign the consent form, and complete the questionnaires. Questionnaires were adapted from those used in the ABENA study, which was specifically designed to be administered to disadvantaged groups [20]. A food fre-quency questionnaire was used to describe the con-sumption of children and adults in 13 main food groups (cereal products, starches, vegetables, fruits, legumes, dairy products, meats and eggs, fish and sea-food prod-ucts, fast-food and pizza, salty snacks, sweet prodprod-ucts, and beverages). The baseline questionnaire also included information on inclusion criteria, living conditions, and food security (see details below). We relied upon the lat-ter data and sociodemographic characlat-teristics to com-pute the EPICES score [38]. Based on 11 questions on various socioeconomic determinants, this individual score assesses the precariousness level of subjects living conditions. It ranges from 0 (the less precarious situ-ation) to 100 (the most precarious situsitu-ation), with a threshold of 30.17 to define precariousness, a score upper than 53.84 reflecting a great precariousness. The baseline questionnaire had a duration of about one hour, and follow-up questionnaires about 30 min. The vouchers were electronically traceable, so we were able to know exactly the number of vouchers used for each household. After the interview, parent-child pairs were assigned in the intervention or in the control group
through an algorithm of random distribution performed on a laptop. The algorithm was computed to balance groups every 50 inclusions.
Ethics, consent and permissions
Each adult participant (whether the mother or the father included with his/her child) signed a consent form, after the interviewer made sure it was well understood. The study was approved by the Ethics Review Committee of the National Institute of Health and Medical Research (Institut National de la Santé et de la Recherche Médi-cale) (Inserm) IRB00003888 under the number 15–247. The declaration to the National Commission of Data Processing and Liberties (Commission Nationale de l’In-formatique et des Libertés) (CNIL) of February 26, 2015 was made under number 1838429v0. The study protocol has been registered on clinical trials website under no. NCT02461238.
Assessment of food insecurity
At inclusion, the 18-item Household Food Security Module (USDA HFSM), validated by the US Department of Agriculture (USDA), was used to measure food secur-ity [39]. We used the French version of the question-naire, adapted from the first translation performed in Quebec for the 2004 cycle of the Canadian Community Health Survey [40, 41], that was already used in two French studies ABENA [5, 20] and SIRS [14]. Based on the 18 items asked in order of severity, we used the guide provided by Bickel and colleagues to compute a continuous measure (ranging from 0 to 10) of FI, which was divided according the usual thresholds to obtain the 3 following categories: a) food secure (0–2.32), b) food insecure, without hunger (2.33–4.55), c) food secure with hunger (> 4.55) [42]. We also used the USDA Food Sufficiency Indicator (FSI), a single question with a four-part response [43]. This measure allows scaling FI in four categories: a) food security, b) qualitative food in-security (“enough but not the kinds we want com-bined”), c) quantitative food insecurity sometimes (“sometimes not enough”, and d) frequent quantitative food insecurity (“often not enough”). Given the heavi-ness of the 18-items module, and to shorten interview time, follow-up assessments of FI, were done only using the FSI. We relied on a comparative analysis showing that FSI was fairly accurate to estimate FI when combin-ing the three categories of food insecurity described above compared to module with more questions [43]. Given the small number of participants, we combined the two grades of the FSI that was therefore assessed through one two-category variable: food sufficiency and food insufficiency (including quantitative and qualitative food insufficiency).
Statistical analyses
The sample size calculation was based on the primary out-come of the FLAM study, which was defined by the propor-tion of low fruits and vegetables consumers (less than 3.5 servings of FV per day) in children. Based on the literature, the baseline proportion of low consumers was expected to be at 83.9%, and the target proportion of low consumers was expected equalling those of the French general popula-tion, 61.0% [5,44]. This led to an expected number of par-ticipants of 92 in each group, leading to a total of 184 participants [35]. The percentage of people lost to follow-up was estimated to be about 40%, and the calculation took into account a type I error of 5% and with an expected power of 90%, leading to an expected number of partici-pants of 300. Despite a wide range of recruitment strategies [45], we finally included 92 parent-child pairs, including 47 in the control group and 45 in the intervention group.
Comparison of sociodemographic characteristics ac-cording to the FI status were performed using Chi-square tests (or exact Fisher tests) for qualitative variables, and
using Anova tests for quantitative variables. Dietary con-sumptions were described depending on the compliance to the French nutritional recommendations within each food group. They were compared according to FI status using Chi-square or Fisher exact tests. A Spearman correl-ation test between the USDA HFSM and the FSI was per-formed. Comparison of food insecurity between inclusion and one-year follow-up based on USDA FSI as a dichot-omous variable (food secure vs. the 3 others categories) was performed using a McNemar test. We also performed a difference-in-difference assessing the evolution of the food insufficiency in the two study groups between inclu-sion and follow-up [46].
All statistical analyses were performed using SAS soft-ware (version 9.4, SAS institute, Cary, NC, USA).
Results
Of the 95 families recruited from May 2015 to May 2016, 91 were finally included (Fig.2). According to the USDA HFSM, 68.1% of households were experiencing
Table 1 Sociodemographic characteristics of the population according to USDA Household Food Security Module (N = 91)
Food insecurity status (HFSM) Food secure N = 29 (31.9%)
Food insecure, without hunger N = 24 (26.4%)
Food insecure, with hunger N = 38 (41.7%)
p value* mean +/−SD mean +/−SD mean +/−SD
Parent’s age (years) 39.4 7.9 40 7.2 39.6 7.2 0.81 Child’s age (years) 7.5 2.4 7.9 2 7.2 2.6 0.47 EPICES score 50.6 15 55.1 17.7 65 14.8 < 0.001 Budget for food (in€ /individual/month) 89.6 49.5 90.4 25.3 108.8 63.9 0.13 Budget for FV (in€ /individual /month) 25.0 17.5 28.6 17.5 30.6 21.1 0.26
n % n % n %
Place of birth of the parent
France 12 41.4 6 25 11 28.9 0.39 Other country 17 58.6 18 75 27 71.1
Marital status
Single 23 79 24 100 37 97.4 0.01
Cohabiting 6 21 0 0 1 2.6
Size of the household
2 people 8 27.6 4 16.7 9 23.7 0.93 3 people 7 24.1 7 29.2 10 26.3
4 people and more 14 48.3 13 54.2 19 50 Education level
Primary school 6 20.7 7 29.2 16 42.1 0.10 Secondary school 10 34.5 9 37.5 15 39.5
Baccalaureat and university 13 44.8 6 25 6 15.8
Other 0 0 2 8.3 1 2.6
Professional status
Working 10 34.5 6 25 10 26.3 0.69 Unemployed 19 65.5 18 75 28 73.7
Income level (in€ per c.u.)
260€ at the most 4 13.8 6 26.1 12 31.6 0.34 400€ at the most 13 44.8 10 43.5 18 47.4
800€ at the most 12 41.4 7 30.4 8 21.0 Perception of the financial situation of the household
It’s OK 2 6.9 0 0 0 0 < 0.01 Need to be very cautious 15 51.7 10 41.7 6 15.8
It’s difficult 8 27.6 9 37.5 16 42.1 Often making debts 4 13.8 5 20.8 16 42.1 Food aid use over the past 12 months
No 22 78.6 19 79.2 26 70.3 0.65
Yes 6 21.4 5 20.8 11 29.7
Purchasing frequency for FV
Several times a week 12 41.4 9 37.5 18 47.4 0.32 Once a week 9 31 13 54.2 14 36.8
2 or 3 times a month 8 27.6 2 8.3 5 13.2 Study group
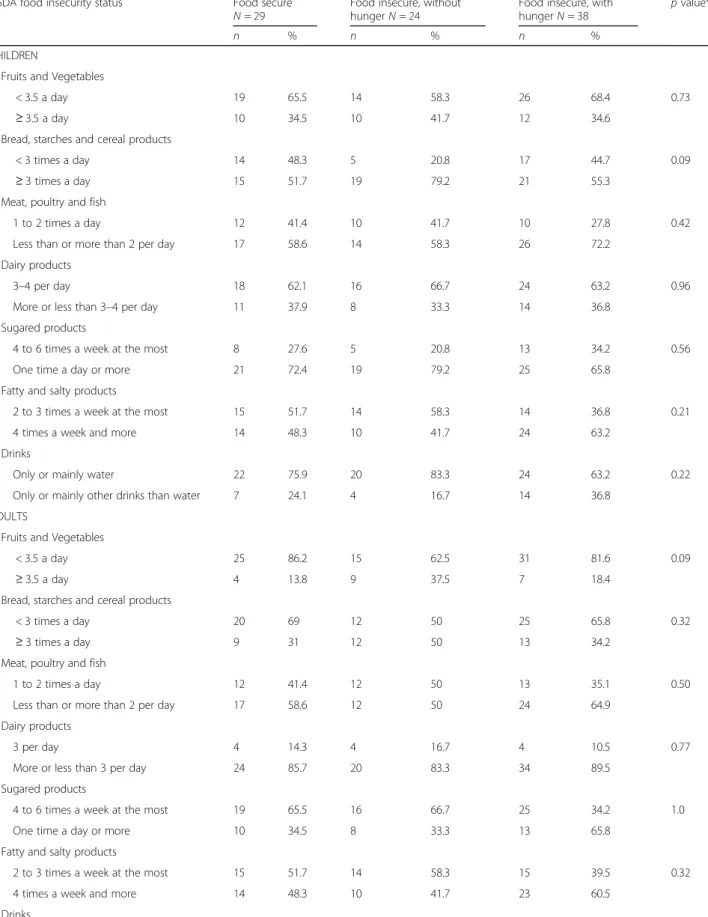
FI, and more than a half of them (n = 38) were describ-ing a FI with hunger. The overall proportion of FI was rising up to 80.2% when using the FSI. Qualitative FI was experienced by 47% of families and quantitative FI by 31% of families at inclusion. The USDA HFSM and FSI were positively correlated (Spearman correlation 0.59, with p < 0.0001). FI was significantly more frequent in sin-gle parent families (p = 0.01), when the financial situation of the household was perceived as difficult (p < 0.01), and when the deprivation EPICES score was higher (p < 0.001) (Table 1). No significant association was found between food consumptions and food insecurity (according to the USDA HFSM) at inclusion (Table2). Among the 64 fam-ilies who answered the last questionnaire after one-year follow-up, food insufficiency assessed by the FSI was sig-nificantly decreased in the intervention group (61.8% vs 85.3% at inclusion, with p = 0.03), while it remained stable (70%) in the control group (p = 1.0). However, the difference-in-difference test was not significant (p value = 0.12). No significant evolution of the food sufficiency sta-tus was observed depending on the participation to the nutritional workshops (Table 3). Overall 80.2% of vouchers were used, with similar proportion of vouchers used regardless the food sufficiency status after one year follow-up (data not tabulated).
Discussion
Results of this pilot study suggest that food insufficiency could be partly decreased in low-income households re-ceiving vouchers for fruits and vegetables over a one-year period.
The prevalence of FI at inclusion in our study popula-tion was similar to that measured in the ABENA study, conducted among food aid users in France [20]. Qualita-tive FI was experienced by 43% of households in the ABENA study vs. 47% in the FLAM study, and quantita-tive FI was experienced by 31% of families in both FLAM and ABENA studies. Yet, only a small proportion of participants in FLAM reported having used food aid over the last 12 months (24%). Indeed, the study ap-peared to have reached families which did not benefit from food aid at the time of the study, though they were facing difficulties to reach food security. This underlies
the need for increasing the knowledge on households ex-periencing FI, and the levers for reducing it at different levels. Such policies are relying upon the concept of “proportionate universalism” proposed by Michael Mar-mot in 2010 [47]. Based on the assumption that focusing solely on the most disadvantaged is not sufficient to re-duce health inequalities, the author explains that actions must be universal, but with a scale and intensity that is proportionate to the level of disadvantage to reduce the steepness of the social gradient in health.
In France, the National Nutrition and Health Program (programme national nutrition santé, PNNS) is a na-tional public health program aiming to improve the health of the general population through nutrition. Redu-cing nutritional health inequalities has become one of its priorities over the past few years, including use of vouchers for increasing FV consumption among disadvan-taged households [48, 49]. Accessing to adequate nutri-tious food is a basic necessity, and therefore a basic human right [1, 50–52]. Moreover long-term adverse ef-fects of FI on health have been widely reported [7,9,11]. Nutritional aid programs supported by evidence-based in-terventions have emerged in developed countries aiming to tackle FI among disadvantaged households [53–55]. Thus, several studies have assessed the impact of financial incentive programs including food vouchers, dietary coun-selling and farmer’s market incentive on dietary consump-tion and nutriconsump-tional status among low-income populaconsump-tions [22,56]. Yet, only a few of these programs focused specif-ically on the impact on food security status of the house-holds. In the USA, participants to the Women, Infants and Children (WIC) program was associated with an im-provement of the FI status [57]. Gundersen and colleagues showed a positive impact of the Supplemental Nutrition Assistance Program (SNAP) on the prevalence of FI in households with children by at least 6 percentage points [34]. In England, women recruited in the healthy Start program reported an improvement of the quality of family diets [23]. Targeting specific food groups of high nutri-tional quality like fruits and vegetables which are usually under-consumed in such populations seems efficient by guiding food choices, and therefore facilitating the shift of nutritional habits in the long term [7,22, 23]. That being said, such intervention could be perceived as paternalistic, Table 1 Sociodemographic characteristics of the population according to USDA Household Food Security Module (N = 91)
(Continued)
Food insecurity status (HFSM) Food secure N = 29 (31.9%)
Food insecure, without hunger N = 24 (26.4%)
Food insecure, with hunger N = 38 (41.7%)
p value* mean +/−SD mean +/−SD mean +/−SD
Control 17 58.6 13 54.2 16 42.1
Abbreviations:c.u consumer unit, € Euros, FV Fruits and vegetables, HFSM Household Food Security Module, SD Standard Deviation *Chi-square tests and exact Fisher tests were performed for qualitative variables and Anova tests were performed for quantitative variables;
Table 2 Food groups consumption according to food insecurity status at inclusion (N = 91)
USDA food insecurity status Food secure N = 29
Food insecure, without hunger N = 24
Food insecure, with hunger N = 38
p value*
n % n % n %
CHILDREN
Fruits and Vegetables
< 3.5 a day 19 65.5 14 58.3 26 68.4 0.73 ≥ 3.5 a day 10 34.5 10 41.7 12 34.6
Bread, starches and cereal products
< 3 times a day 14 48.3 5 20.8 17 44.7 0.09 ≥ 3 times a day 15 51.7 19 79.2 21 55.3
Meat, poultry and fish
1 to 2 times a day 12 41.4 10 41.7 10 27.8 0.42 Less than or more than 2 per day 17 58.6 14 58.3 26 72.2
Dairy products
3–4 per day 18 62.1 16 66.7 24 63.2 0.96 More or less than 3–4 per day 11 37.9 8 33.3 14 36.8
Sugared products
4 to 6 times a week at the most 8 27.6 5 20.8 13 34.2 0.56 One time a day or more 21 72.4 19 79.2 25 65.8
Fatty and salty products
2 to 3 times a week at the most 15 51.7 14 58.3 14 36.8 0.21 4 times a week and more 14 48.3 10 41.7 24 63.2
Drinks
Only or mainly water 22 75.9 20 83.3 24 63.2 0.22 Only or mainly other drinks than water 7 24.1 4 16.7 14 36.8
ADULTS
Fruits and Vegetables
< 3.5 a day 25 86.2 15 62.5 31 81.6 0.09 ≥ 3.5 a day 4 13.8 9 37.5 7 18.4
Bread, starches and cereal products
< 3 times a day 20 69 12 50 25 65.8 0.32 ≥ 3 times a day 9 31 12 50 13 34.2
Meat, poultry and fish
1 to 2 times a day 12 41.4 12 50 13 35.1 0.50 Less than or more than 2 per day 17 58.6 12 50 24 64.9
Dairy products
3 per day 4 14.3 4 16.7 4 10.5 0.77 More or less than 3 per day 24 85.7 20 83.3 34 89.5
Sugared products
4 to 6 times a week at the most 19 65.5 16 66.7 25 34.2 1.0 One time a day or more 10 34.5 8 33.3 13 65.8
Fatty and salty products
2 to 3 times a week at the most 15 51.7 14 58.3 15 39.5 0.32 4 times a week and more 14 48.3 10 41.7 23 60.5
by interfering with individual autonomy or freedom of the targeted population [58–60]. It seems therefore important to keep in mind that from an ethical point of view, the pri-ority always remains the decrease of the FI, with or with-out any impact on the overall nutritional quality. And despite using vouchers for purchasing FV (i.e. food items of high nutritional quality), we assume that results on food sufficiency could have been similar by using any kind of food vouchers.
Our results are in line with previous works suggesting that FI is not restricted to a money issue [12, 61]. First, the financial help we provided was modest, with a value limited to a maximum of 24€ per month for a 4 mem-bers household, whereas Anliker and colleagues sug-gested that a minimum allotment of 20 US$ per week was necessary [62]. More recently, a minimal allotment of 7.50 US$ per week was proposed by An and colleagues as suitable to entail an evolution of the purchasing behav-iour [22]. Besides, a study performed in France among a
similar population showed that about 20% of the house-holds (called “positive deviants”) developed strategies allowing them to purchase healthier food than others, without increasing their food budget [63].
Not surprisingly, FI was increased when EPICES deprivation score was higher, when the perception of the household was more difficult, and among single-parent families [14]. Other associations between FI and parents’
education level, place of birth or income level were not significant. We did not highlight any significant associ-ation between FI status and dietary behaviours. However, this could be due to an insufficient power, given the low number of participants. Moreover, and given its inclu-sion criteria, our study population might have homoge-neous dietary behaviour, which cannot be discriminated by FI status. The one-year duration of the intervention was one of the major strengths of this study. This allowed to avoid the“novelty effect”, and to help families to incorporate the vouchers into their purchase patterns, and therefore in their daily dietary habits. Besides, the absence of significant impact of workshops on food suf-ficiency status tended to reinforce the association we ob-served between vouchers and FI. Finally, we used an international validated questionnaire to assess FI [39].
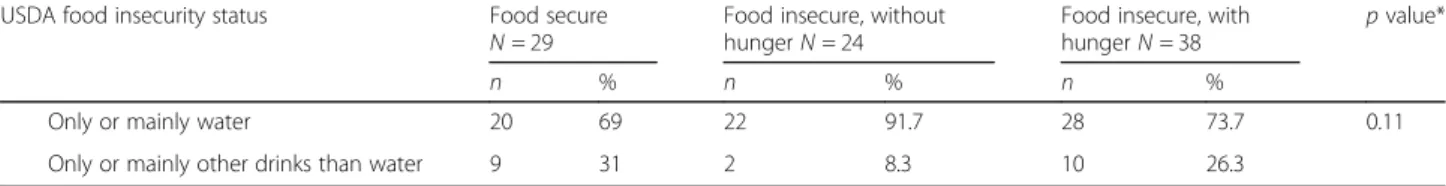
Some limitations should be discussed. First, we faced difficulties in the recruitment process and therefore in-cluded much less families than we expected. This might have led to an insufficient power, and therefore to the under-estimation of several associations in our sample. Moreover, we cannot exclude a desirability bias in the intervention group when follow-up questionnaires were administered. Households who received food vouchers over one year were probably more likely to minimise their FI, due to Hawthorne effect [24, 56]. Most parents were born abroad. Given dietary habits are strongly sociated with ethnic and cultural backgrounds, we as-sume that fruits and vegetables consumption or vouchers use could have been different in this particular population [64–67]. Caution is therefore needed regard-ing the generalization of the results. Although the inter-vention was randomly assigned, food insufficiency at inclusion was somewhat higher in the intervention group compared to the control group (85.3% vs 70.0%). Despite it was not significant (Fisher exact test, p = 0.23, data not tabulated), this difference at inclusion could partly explain the results. Besides, the proportion of Table 2 Food groups consumption according to food insecurity status at inclusion (N = 91) (Continued)
USDA food insecurity status Food secure N = 29
Food insecure, without hunger N = 24
Food insecure, with hunger N = 38
p value*
n % n % n %
Only or mainly water 20 69 22 91.7 28 73.7 0.11 Only or mainly other drinks than water 9 31 2 8.3 10 26.3
* Chi-square or Fisher exact tests were performed
Table 3 Comparison of food insecurity status between baseline and one-year follow-up, using Food Sufficiency Indicator (FSI) (N = 64)
Baseline One year follow-up p value* n % n % All (n = 64)† Food sufficiency 14 21.9 22 34.4 0.10 Food insufficiency 50 78.1 42 65.6 Intervention group (N = 34) Food sufficiency 5 14.7 13 38.2 0.03 Food insufficiency 29 85.3 21 61.8 Control group (N = 30) Food sufficiency 9 30 9 30 1.00 Food insufficiency 21 70 21 70 Participation in workshops (N = 42) Food sufficiency 7 16.7 13 30.9 0.11 Food insufficiency 35 83.3 29 69.1 No participation (N = 22) Food sufficiency 7 31.8 9 40.9 0.44 Food insufficiency 15 68.2 13 52.1
*Proportion of families with food insufficiency between inclusion and follow-up were compared within each grofollow-up using McNemar tests
† Comparison of FSI between intervention and control groups at inclusion (Fisher exact test):p value = 0.23
families with food insufficiency at follow-up was not sta-tistically significant between the two groups (Fisher exact test, p = 0.60, data not tabulated). Finally, we could not explore the impact of vouchers on FI using the complete 18-items FI module, since this latter was not used for follow-up questionnaire. But the 4-items food sufficiency indicator has been shown to fairly estimate FI prevalence when combining the three questions on qualitative and quantitative food insufficiency [43].
Conclusions
According to previous results of similar works performed in other developed countries, and in the scope of the French national Nutritional health program, results of this pilot study suggest that the allotment of fruits and vege-table vouchers over a one-year period might be a useful lever to alleviate the food insecurity of low-income house-holds who have no access to food aid programs. Beyond improving access to fruits and vegetables, the priority of public health policies should always remain access to suffi-cient food.
Abbreviations
FAO:Food and Agriculture Organization; FI: Food Insecurity; FLAM: Fruits and vegetables at home (“Fruits et légumes à la maison”); FSI: Food Sufficiency Indicator; USDA HFSM: Household food Security Module by the US department of Agriculture
Acknowledgements
The authors are grateful to Claudia Chahine and Cynthia Perlin, dieticians, for their precious participation to this study and the elaboration and conduction of workshops during the whole study, and to the FLAM interviewers, Laëtitia Defoi, Anita Houeto, Anouchka Kponou, Lysa Tagherset and Marion Genest. The authors thank for their welcome and their help the community centres of Saint-Denis (Pierre Sémard, Romain Rolland, Floréal), the Municipality health care centres (CMS du Cygne, CMS Henri Barbusse, CMS des Moulins) and their directors (Dr Brahim Bouselmi, Jean-Marc Robinet et Dr. Samia Khi-moun). They also thank all the associations which have been involved in this study: APIJ association, Maison des parents, ludothèque of Allende neigh-bourhood and ASAFI association. Finally, the authors thank Dr. Michel Chau-liac (French General Direction of Health), Marjorie Painsecq (former director of Maison de la Santé) and Samira Guedichi-Beaudouin (Saint-Denis Munici-pality) for their involvement in this project.
Funding
Direction Générale de la Santé (DGS), French Public Health Institute (Santé publique France), APRIFEL Fresh Fruits and vegetables Agency (Agence Fruits et Légumes Frais), Ile-De France County (Région), Ile-de-France Health Agency (Agence Régionale de Santé). The funders had no role in study design, data collection and analysis, decision to publish, or preparation of the manuscript. Study sponsors had no part in study design, collection, analysis, and inter-pretation of data and the writing of the article and the decision to submit it for publication.
Availability of data and materials
The datasets generated and/or analysed during the current study are not publicly available due the agreement of strict confidentiality ensured to the volunteers when the data were collected, but are available from the corresponding author on reasonable request.
Authors’ contributions
CB participated to the recruitment strategy and data collection, coordinated the conduction of the study in the field, performed the analyses and wrote the manuscript. JG elaborated the recruitment strategy, participated to the data collection and critically revised the paper for important intellectual
content. PD helped in the recruitment and data collection, and critically revised the paper for important intellectual content. PL was involved in the elaboration of the protocol and critically revised the paper for important intellectual content. SH participated to the conception of the study and critically revised the paper for important intellectual content. PLM was involved in the conception and methodology throughout the study and critically revised the paper for important intellectual content. CJ conceived the study, supervised the overall study and has primary responsibility for final content. All authors have read and approved the final manuscript.
Ethics approval and consent to participate
Each adult participant (whether the mother or the father included with his/ her child) signed a consent form, after the interviewer made sure it was well understood. The study was approved by the Ethics Review Committee of the National Institute of Health and Medical Research (Institut National de la Santé et de la Recherche Médicale) (Inserm) IRB00003888 under the number 15–247. The declaration to the National Commission of Data Processing and Liberties (Commission Nationale de l’Informatique et des Libertés) (CNIL) of February 262,015 was made under number 1838429v0.
Consent for publication Not applicable.
Competing interests
The authors declare that they have no competing interests.
Publisher’s Note
Springer Nature remains neutral with regard to jurisdictional claims in published maps and institutional affiliations.
Author details
1Equipe de Recherche en Epidémiologie Nutritionnelle (EREN), Université
Paris 13, Inserm U1153, Inra U1125, Cnam, Centre de Recherche en Epidémiologie et Biostatistiques (CRESS) Sorbonne Paris Cité, Bâtiment SMBH -74 rue Marcel Cachin, 93017 Bobigny cedex, France.2Département de Santé Publique, Hôpital Avicenne (AP-HP), 125 rue de Stalingrad, 93000 Bobigny, France.3Maison de la Santé de Saint-Denis, 6 rue des Boucheries, 93200 Saint-Denis, France.4Laboratoire Educations et Pratiques de Santé, Campus
Condorcet, Université Paris, 13, 74 rue Marcel Cachin, Bobigny, France.
Received: 18 September 2018 Accepted: 22 March 2019
References
1. FAO, editor. Addressing food insecurity in protracted crises. Rome: FAO; 2010. 2. Anderson SA. Core indicators of nutritional state for difficult-to-sample
populations. J Nutr USA 1990.http://agris.fao.org/agris-search/search. do?recordID=US9111600. Accessed 5 Mar 2018.
3. Cook JT, Frank DA, Berkowitz C, Black MM, Casey PH, Cutts DB, et al. Food insecurity is associated with adverse health outcomes among human infants and toddlers. J Nutr. 2004;134:1432–8.
4. Cook JT, Frank DA. Food security, poverty, and human development in the United States. Ann N Y Acad Sci. 2008;1136:193–209.
5. Méjean C, Deschamps V, Bellin-Lestienne C, Oleko A, Darmon N, Hercberg S, et al. Associations of socioeconomic factors with inadequate dietary intake in food aid users in France (the ABENA study 2004–2005). 2010. 6. Seligman HK, Laraia BA, Kushel MB. Food insecurity is associated with
chronic disease among low-income NHANES participants. J Nutr. 2010; 140:304–10.
7. Hanson KL, Connor LM. Food insecurity and dietary quality in US adults and children: a systematic review. Am J Clin Nutr. 2014;100:684–92.
8. Martin-Fernandez J, Caillavet F, Lhuissier A, Chauvin P. Food insecurity, a determinant of obesity? - an analysis from a population-based survey in the Paris metropolitan area, 2010. Obes Facts. 2014;7:120–9.
9. Ke J, Ford-Jones EL. Food insecurity and hunger: a review of the effects on children’s health and behaviour. Paediatr Child Health. 2015;20:89–91. 10. Bruening M, Dinour LM, Chavez JBR. Food insecurity and emotional health
in the USA: a systematic narrative review of longitudinal research. Public Health Nutr. 2017;20:3200–8.
11. Shankar P, Chung R, Frank DA. Association of food insecurity with Children’s behavioral, emotional, and academic outcomes: a systematic review. J Dev Behav Pediatr. 2017;38:135–50.
12. ANSES. Etude individuelle nationale des consommations alimentaires 2 (INCA 2) 2006–2007. Maison-Alfort: Afssa; 2009.https://www.anses.fr/fr/ system/files/PASER-Ra-INCA2.pdf. Accessed 2 Mar 2018.
13. Darmon N, Bocquier A, Vieux F, Caillavet F. L’insécurité alimentaire pour raisons financières en France. Lett Onpes. 2010:1–6.
14. Martin-Fernandez J, Grillo F, Parizot I, Caillavet F, Chauvin P. Prevalence and socioeconomic and geographical inequalities of household food insecurity in the Paris region, France, 2010. BMC Public Health. 2013;13:486. 15. Coleman-Jensen A, Gregory C, Singh A. Household food security in the United
States in 2013. SSRN scholarly paper. Rochester, NY: social science research Network; 2014.https://papers.ssrn.com/abstract=2504067. Accessed 8 Jan 2018. 16. Vandentorren S, Le Mener E, Oppenchaim N, Arnaud A, Jangal C, Caum C, et al. Characteristics and health of homeless families: the ENFAMS survey in the Paris region, France 2013. Eur J Pub Health. 2016;26:71–6.
17. ANSES. Etude individuelle des consommations alimentaires 3 (INCA3). Maison-Alfort: ANSES; 2017.https://www.anses.fr/fr/system/files/ NUT2014SA0234Ra.pdf. Accessed 14 Mar 2018.
18. Birlouez É. L’insécurité alimentaire en France. Pour. 2009;:73–8. 19. Cours des comptes. Circuits et mécanismes financiers concourant à l’aide
alimentaire en France. Cours des comptes; 2009.http://www.assemblee-nationale. fr/commissions/cfin-enquete-CC-aide-alimentaire.pdf. Accessed 5 Mar 2018. 20. Grange D, Castetbon K, Guibert G, Vernay M, Escalon H, Delannoy A, et al.
Alimentation et état nutritionnel des bénéficiaires de l’aide alimentaire-Etude ABENA 2011–2012 et évolutions depuis 2004–2005. 2013.http:// inpes.santepubliquefrance.fr/etudes/pdf/2013-abena2-rapport.pdf. Accessed 28 Dec 2015.
21. Blaylock J, Smallwood D, Kassel K, Variyam J, Aldrich L. Economics, food choices, and nutrition. Food Policy. 1999:169–286.
22. An R. Effectiveness of subsidies in promoting healthy food purchases and consumption: a review of field experiments. Public Health Nutr. 2013;16: 1215–28.
23. McFadden A, Green JM, Williams V, McLeish J, McCormick F, Fox-Rushby J, et al. Can food vouchers improve nutrition and reduce health inequalities in low-income mothers and young children: a multi-method evaluation of the experiences of beneficiaries and practitioners of the healthy start programme in England. BMC Public Health. 2014;14:148.
24. Campbell MK, Honess-Morreale L, Farrell D, Carbone E, Brasure M. A tailored multimedia nutrition education pilot program for low-income women receiving food assistance. Health Educ Res. 1999;14:257–67.
25. Bihan H, Méjean C, Castetbon K, Faure H, Ducros V, Sedeaud A, et al. Impact of fruit and vegetable vouchers and dietary advice on fruit and vegetable intake in a low-income population. Eur J Clin Nutr. 2012;66:369–75. 26. Smith C, Parnell WR, Brown RC, Gray AR. Providing additional money to
food-insecure households and its effect on food expenditure: a randomized controlled trial. Public Health Nutr. 2013;16:1507–15.
27. Dailey AB, Hess A, Horton C, Constantian E, Monani S, Wargo B, et al. Healthy options: a community-based program to address food insecurity. J Prev Interv Community. 2015;43:83–94.
28. Olsho LE, Klerman JA, Wilde PE, Bartlett S. Financial incentives increase fruit and vegetable intake among supplemental nutrition assistance program participants: a randomized controlled trial of the USDA healthy incentives pilot. Am J Clin Nutr. 2016;104:423–35.
29. Jensen HH. Food insecurity and the food stamp program. Am J Agric Econ. 2002;84:1215–28.
30. Bitler M, Gundersen C, Marquis GS. Are WIC nonrecipients at less nutritional risk than recipients? An application of the food security measure*. Rev Agric Econ. 2005;27:433–8.
31. Mykerezi E, Mills B. The impact of food stamp program participation on household food insecurity. Am J Agric Econ. 2010;92:1379–91. 32. Frank DA, Chilton M, Casey PH, Black MM, Cook JT, Cutts DB, et al.
Nutritional-assistance programs play a critical role in reducing food insecurity. Pediatrics. 2010;125:e1267 author reply e1267-1268. 33. Ratcliffe C, McKernan S-M, Zhang S. How much does the supplemental
nutrition assistance program reduce food insecurity? Am J Agric Econ. 2011; 93:1082–98.
34. Gundersen C, Kreider B, Pepper JV. Partial identification methods for evaluating food assistance programs: a case study of the causal impact of SNAP on food insecurity. Am J Agric Econ. 2017;99:875–93.
35. Buscail C, Margat A, Petit S, Gendreau J, Daval P, Lombrail P, et al. Fruits and vegetables at home (FLAM): a randomized controlled trial of the impact of fruits and vegetables vouchers in children from low-income families in an urban district of France. BMC Public Health. 2018;18:1065.
36. Auzet L, Février M, Lapinte A. Niveaux de vie et pauvreté en France. Insee Prem. 2007.
37. Revenu disponible correspondant au seuil de pauvreté selon le type de ménage en 2014 | Insee.https://www.insee.fr/fr/statistiques/2499760. Accessed 29 May 2017.
38. Sass C, Guéguen R, Moulin J-J, Abric L, Dauphinot V, Dupré C, et al. Comparaison du score individuel de précarité des Centres d’examens de santé, EPICES, à la définition socio-administrative de la précarité. Santé Publique. 2006;18:513.
39. Briefel RR, Woteki CE. Development of food sufficiency questions for the third national health and nutrition examination survey. J Nutr Educ. 1992;24:24S–8S. 40. Canada H. Canadian Community Health Survey, Cycle 2.2, Nutrition (2004): A
Guide to Accessing and Interpreting the Data [Health Canada, 2006]. aem. 2006.
https://www.canada.ca/en/health-canada/services/food-nutrition/food-nutrition-surveillance/health-nutrition-surveys/canadian-community-health-survey-cchs/ canadian-community-health-survey-cycle-2-2-nutrition-2004-guide-accessing-interpreting-data-health-canada-2006.html. Accessed 5 Mar 2018. 41. Canada, editor. Canadian community health survey: income-related
household food security in Canada. Cycle 2.2: Nutrition (2004). Ottawa: Office of Nutrition Policy and Promotion, Health Canada; 2007. 42. Bickel G, Nord M, Price C, Hamilton W, Cook J. Guide to Measuring
Household Food Security, Revised 2000. U.S. Alexandria: Department of Agriculture, Food and Nutrition Service; 2000.
43. Radimer KL, Radimer KL. Measurement of household food security in the USA and other industrialised countries. Public Health Nutr. 2002;5:859–64. 44. Escalon H, Bossard C, Beck F. Baromètre santé nutrition 2008. Saint-Denis:
Inpes; 2009.
45. Buscail C, Margat A, Miszkowicz T, Gendreau J, Daval P, Lombrail P, et al. Recruitment of precarious families in an interventional study: lessons from the French“fruits and vegetables at home” (FLAM) trial. Contemp Clin Trials Commun. 2018;12:161–8.
46. Card D, Krueger AB. Minimum wages and employment: a case study of the fast food industry in New Jersey and Pennsylvania. Working paper. National Bureau of Economic Research; 1993. doi:https://doi.org/10.3386/w4509. 47. Marmot M. Fait society, healthy lives - the Marmot review. The Marmot
Review; 2010.www.ucl.ac.uk/marmotreview. Accessed 28 Feb 2018. 48. Ministère du Travail, de l’emploi et de la Santé. Programme national nutrition
santé 2011-2015. Ministère du Travail, de l’Emploi et de la Santé; 2011. 49. HCSP. Pour une Politique nutritionnelle de santé publique en France. PNNS
2017–2021. Paris: Haut Conseil de la Santé Publique; 2017.http://www.hcsp. fr/explore.cgi/avisrapportsdomaine?clefr=632. Accessed 10 Nov 2017 50. Maslow AH. Motivation and Personality. Cynthia McReynolds. New York:
Harper & Row; 1970.
51. Comité de la sécurité alimentaire mondiale. S’entendre sur la terminologie: Sécurité alimentaire, Sécurité nutritionnelle, Sécurité alimentaire et nutrition, Sécurité alimentaire et nutritionnelle. Rome (Italie); 2012.http://www.fao. org/docrep/meeting/026/MD776F.pdf. Accessed 27 Sep 2017. 52. De Schutter O.“The transformative potential of the right to food”. UN
general assembly, human rights council, twenty-fifth session, agenda item 3: promotion and protection of all human rights, civil, political, economic, social and cultural rights, including the right to Development. 2014. 53. Rush D, Horvitz D, Seaver W, Alvir J, Garbowski G, Leighton J, et al. The
National Wic Evaluation - evaluation of the special supplemental food program for women, infants, and children - background and introduction. Am J Clin Nutr. 1988;48:389–93.
54. Devaney BL, Ellwood MR, Love JM. Programs that mitigate the effects of poverty on children. Futur Child. 1997;7:88–112.
55. Department of Health. Choosing health: making healthier choices easier. London: The stationery office; 2004.http://webarchive.nationalarchives.gov. uk/+/http://www.dh.gov.uk/en/Publicationsandstatistics/Publications/ PublicationsPolicyAndGuidance/DH_4094550. Accessed 19 Mar 2018 56. Savoie-Roskos M, Durward C, Jeweks M, LeBlanc H. Reducing food insecurity
and improving fruit and vegetable intake among farmers’ market incentive program participants. J Nutr Educ Behav. 2016;48:70–76.e1.
57. Metallinos-Katsaras E, Gorman KS, Wilde P, Kallio J. A longitudinal study of WIC participation on household food insecurity. Matern Child Health J. 2011;15:627–33.
58. Hepple B. Nuffield Council on Bioethics, editors. Public health: ethical issues. London: Nuffield council on. Bioethics. 2007.
59. Griffiths PE, West C. A balanced intervention ladder: promoting autonomy through public health action. Public Health. 2015;129:1092–8.
60. Bellefleur O, Keeling M. Comment pouvons-nous (et pourquoi devrions-nous) analyser l’éthique des politiques paternalistes en santé publique? Montréal, Québec: Centre de collaboration nationale sur les politiques publiques et la santé; 2018.
61. Ashby S, Kleve S, McKechnie R, Palermo C. Measurement of the dimensions of food insecurity in developed countries: a systematic literature review. Public Health Nutr. 2016;19:2887–96.
62. Anliker JA, Winne M, Drake LT. An evaluation of the Connecticut farmers’ market coupon program. J Nutr Educ. 1992;24:185–91.
63. Marty L, Dubois C, Gaubard MS, Maidon A, Lesturgeon A, Gaigi H, et al. Higher nutritional quality at no additional cost among low-income households: insights from food purchases of“positive deviants.”. Am J Clin Nutr. 2015;102:190–8.
64. Satia-Abouta J, Patterson RE, Neuhouser ML, Elder J. Dietary acculturation: applications to nutrition research and dietetics. J Am Diet Assoc. 2002;102:1105–18. 65. Méjean C, Traissac P, Eymard-Duvernay S, El Ati J, Delpeuch F, Maire B.
Influence of socio-economic and lifestyle factors on overweight and nutrition-related diseases among Tunisian migrants versus non-migrant Tunisians and French. BMC Public Health. 2007;7:265.
66. Holmboe-Ottesen G, Wandel M. Changes in dietary habits after migration and consequences for health: a focus on south Asians in Europe. Food Nutr Res. 2012;56.
67. Osei-Kwasi HA, Nicolaou M, Powell K, Terragni L, Maes L, Stronks K, et al. Systematic mapping review of the factors influencing dietary behaviour in ethnic minority groups living in Europe: a DEDIPAC study. Int J Behav Nutr Phys Act. 2016;13:85.