Corporate Decision Analysis: An Engineering Approach
byVictor Tang
B.S. Electrical Engineering, Purdue University M.S. Applied Mathematics, Purdue University M.S. Business Policy, Columbia University Submitted to the Engineering Systems Division in partial fulfillment of the requirements for the degree of
Doctor of Philosophy in Interdisciplinary Studies at the
MASSACHUSETTS INSTITUTE OF TECHNOLOGY June 2006
0 2006 MASSACHUSETTS INSTITUTE OF TECHNOLOGY All rights reserved.
A u th o r... ... May 8, 2006 C ertified b y ... ...
Weber-S-Warren P. Seering igineering and Engineering Systems Thesis Supervisor Certified by... ... Thomas J. Allen a Jvv au vv. jonawn Protes-sor of Management and Engineering Systems C ertified b y ... .... ... .. ... ...
Edward F. Crawley
Professor of., utics and Engineering Systems
Certified by... Accepted by. ... Kevin N. Otto is and Strategy LLC ... Isaac M. Colbert or Graduate Students A ccepted by...
Professor of Civil and atu
... Richard de Neufville Engineering Systems
Corporate Decision Analysis: An Engineering Approach
byVictor Tang
Submitted to the Engineering Systems Division in partial fulfillment of the requirements for the degree of
Doctor of Philosophy in Interdisciplinary Studies Abstract
We explore corporate decisions and their solutions under uncertainty using engineering methods. Corporate decisions tend to be complex; they are interdisciplinary and defy programmable solutions. To address these challenges, we take an engineering approach. Our proposition is that as in an engineering system, corporate problems and their potential solutions deal with the behavior of systems. Since systems can be studied with experiments, we use Design of Experiments (DOE) to understand the behavior of systems within which decisions are made and to estimate the consequences of candidate decisions as scenarios. The experiments are a systematically constructed class of gedanken experiments comparable to "what if' studies, but organized to span the entire
space of controllable and uncontrollable options.
In any experiment, the quality of data is important. Grounded on the work of scholars, we develop a debiasing process for eliciting data. And consistent with our engineering approach, we consider the composite consisting of the organization, their knowledge, data bases, formal and informal procedures as a measurement system. We then use Gage theory from Measurement Systems Analysis (MSA) to analyze the quality of the measuring composite.
To test this engineering approach to decision analysis, we perform four experiments. The first two are a set of simulations using a company surrogate. Using a progression of experiments, we simulate two major corporate decisions. Simulation data show that there is support for the validity of our decision analysis method. We then perform two in situ experiments: with a manufacturing company and with a technology services company. Findings from these company experiments also support the validity and efficacy of our decision analysis method. The company executives were very satisfied with our findings. Finally, we evaluate our method using method-evaluation criteria. The evaluation suggests that our DOE-based decision analysis method is valid. Unexpectedly every experiment resulted in near-decomposable systems at the scale we formulated our problems. Scaling of corporate decision problems at the appropriate level of abstraction and the resultant properties of their dynamic behavior are identified as areas of future work.
This research breaks new ground in corporate decision-analysis as engineering and it furthers DOE and MSA research to a new domain and a new class of problems.
Thesis Supervisor: Professor Warren P. Seering
Acknowledgments
"It's just you and the keyboard". The editor at the Oxford University Press reminded me
about the lonely and solitary nature of writing. Fortunately, that has not been my experience with this dissertation.
From concept to production of this work, my committee has guided, challenged, and encouraged me in innumerable ways. Warren Seering, my advisor and committee chair,
gave me the freedom to explore an interdisciplinary problem using engineering methods untested outside their traditional boundaries. I could not have done this work without
his probing and insightful questions. Tom Allen, Ed Crawley, Kevin Otto, and Warren Seeing have taught me just about everything I know about research methods, modeling, experiments, engineering design, architecture, and complex systems. In addition to my
committee, Nelson Repenning helped with the System Dynamics part of this work, Dan Frey gave lots of good advice on DOE and engineering systems, and Eric Rebentisch
guided me with methods and presentation of this work. I thank Ike Colbert for his help in architecting my program, Richard de Neufville and Dave Wallace for their support and encouragement. I am grateful to Gabriel Bitran who first introduced me to the Sloan
School, the Center for Innovation in Product Development (CIPD), and Warren Seering.
To all these people, I am in their debt. I admire their spirit of excellence and generosity.
My friends have been a source of friendship and learning opportunities. Dan Braha, Vincent H. CHANG, John Dickmann, Jack HE, Katja Holtts-Otto, HSIEH Mohan, Joe HSUEH, TSAI ITsung, LIU Bing, Nick McKenna, TANG Wenjie, Tom Speller, and Lilly
ZHU have all enriched my MIT experience and made it something to be cherished. Day
in and day out, Michael Mack helped me turn out the lights in E60. I have watched the
intensity, concentration, and integrity he puts into his work and craft. It has been an inspiration to me. I am most grateful to my "big brother" from IBM, Hans HUANG. Hans has been a constant source of encouragement and perspective. Roy Bauer and Jack Scheetz gave me the benefit of their considerable executive experience. And special
thanks to Ralph F. Clark, my insightful and stoic friend for his friendship.
My wife has been infinitely patient and supportive. She suffered (perhaps enjoyed) my
protracted absence and all the while taking care of my sick mother. To my kids, this was
simply poetic justice. They were relieved that I was "not skipping classes, going to
parties, and drinking beer." Still, they lectured me about "the mess in my dorm." I am thankful to my parents for teaching me to respect learning and scholarship. My father
wrote a four-volume textbook of 34 chapters while heading a diplomatic post. He set an example for me to follow. Having lost all material things in a revolution, a world war, and then a civil war, my mother taught us that knowledge is more fulfilling than money.
Thanks to IBM and Nick Donofrio for the early support during my stay in Cambridge. The companies, with whom I worked on this research, wish to remain anonymous. They have my deep gratitude for their openness, and professionalism with which they helped me. And I am most grateful for the support and funding from MIT's Center for Innovation in Product Development (CIPD) and from MIT's Lean Aerospace Initiative (LAI). These centers have been very generous with their financial support during my stay at MIT. And CIPD gave me the best view of the Charles River on campus.
Table of Contents
List of Figures... 13
List of Tables ... ... .... ---... 15
List of Tables ... 15
PA R T I. M otivation and literature review ... 19
1.0 Introduction... 19
1.1 M otivation... 19
1.2 Research Questions... 20
1.3 Research Approach... 21
1.4 Contributions and Findings... 22
1.4.1 Contributions to the state-of-the-art... 22
1.4.2 Technical findings ... 23
1.4.3 M anagerial findings ... 23
1.5 Dissertation Outline ... 23
2.0 Decision Theory Literature Survey... 25
2.1 Introduction... 25
2.2 The three schools of decision m aking ... 26
2.2.1 Norm ative Decision Theory ... 27
2.2.2 Descriptive Decisions Theory... 29
2.2.3 Research-Directions... 33
2.2.4 Prescriptive Decision M aking... 35
2.3 The canonical norm al form ... 40
2.4 W hat is a good decision?... ... ... . . 44
Appendix 2.1 The Utility Theory Axiom s... 47
Appendix 2.2 Desiderata of N orm ative Decision Theory ... 48
Appendix 2.3. Keeney's Axiomatic Foundations of Decision Analysis ... 49
Appendix 2.4. Foundations of descriptive theory (Edwards 1992)... 50
3.0. Design of Experiments (DOE) and Measurement Systems Analysis (MSA) Literature Survey... 51
3.1 W hat is DO E?... ... ... . . 51
3.1.1. Literature Survey ... 52
3.1.2. Foundations... 54
3.1.3. Advantages of DOE... 55
3.1.4. DOE presence in m anagerial problem s ... 56
3.1.5. Our usage of DOE ... 57
3.2 M easurem ent System s Analysis (M SA)... 58
Appendix 3.1 Sample of Engineering Applications Using DOE ... 60
PART II. Experiments with a Company Surrogate... 65
4.0 Company Surrogate for Test Experiments ... 65
4.1 Introduction... 65
4.2 C riteria for surrogate... 66
4.2.1 Sufficiently complete and comprehensive... 66
4.2.2 Tests of validity ... 67
4.3 The A D I surrogate ... 67
5.0 Surrogate Validation for Maximizing Value of the Firm (MVF)... 71
5.1. Introduction ... . . 7 1 5.2. Framing the ADI corporate decision ... 71
5.2.1 The decision situation ... 71
5.2.2 Framing the decision in DOE normal form ... 72
5.3 Testing the ADI surrogate ... 75
5.3.1 MVF=f(a controllable variable)... 75
5.3.2 MVF=f(an uncontrollable variable)... 78
5.3.3 MVF=f(ensemble of uncontrollable variables) ... 80
5.3.4 MVF=f(ensemble of controllable variables) ... 81
5 .4 . Sum m ary ... 84
6.0. MVF Decision-Analysis Using the Company Surrogate ... 87
6.1. Introduction... 87
6.2. Protocol for testing ... 87
6.3. L8 1(34,23+ 1) D ata Set ... 88
6.4. L2 7(34 1 ,23+ 1) D ata Set... 92
6.5. L9(34-2,23+ 1) D ata Set ... 98
6 .6 . Sum m ary ... 104
Appendix 6.1. L8 1(34,23+1) MVF data set for t=12. ... 108
Appendix 6.2 ANOVA for L81(34,23+1) MVF, t=12, 18, 24... 110
Appendix 6.3. ANOVA L8 1(34,23+1) MVF uncontrollable variables at t=18, 24... 113
Appendix 6.4 Data set for L27(34 1 ,23+1) MVF t=12... 115
Appendix 6.5. Data structure L27(34-1,23+1) orthogonal array ... 116
Appendix 6.7 Response Tables L27(34 ,23+1) MVF at t=18, 24... 119
Appendix 6.8 Response Tables Plots L2 7(34 ,23+1) MVF at t=18, 24... 120
Appendix 6.9. ANOVA L27(34 1,23+1) MVF with uncontrollables at t=18, 24 ... 122
Appendix 6.10. Data set for L9(34-2,23+1) MVF... 124
Appendix 6.12. Response Tables L9(34-2,23+1) MVF at t=18, 24 ... 127
Appendix 6.13. Plots Responses L9(34-2,23+1) MVF at t=18, 24 ... 128
Appendix 6.13. ANOVA L9(3 4-2 ,2 3+1) uncontrollable variables at t=18, 24... 130
7.0 Surrogate Validation for Maximizing Operating Income (AOI) ... 133
7 .1 Introdu ction ... 133
7.2 Framing the ADI corporate decision ... 133
7.2.1 Framing the decision in DOE normal form ... 133
7.3 Testing the ADI surrogate ... 135
7.3.1 AOI=f(a controllable variable)... 135
7.3.2 AOI=f(an uncontrollable variable)... 137
7.3.3 AOI=f(ensemble of uncontrollable variables)... 139
7.3.4 AOI=f(ensemble of controllable variables)... 140
7.4 Summary and Conclusions ... 143
8.0 AOI Decision-Analysis Using the Company Surrogate... 145
8.1. Introdu ction ... 14 5 8.2 T esting Protocol... 145 8.3. L8 1(34,23+ 1) D ata Set ... 146 8.4. L27(34-1,23+ 1) D ata Set... 148 8.5. L9(34-2,23+ 1) D ata Set ... 151 8.6 Adaptive One-Factor-At-A-Time ... 154 8.7 Sum m ary ... 155 8.8 C on clu sion s... 157
Appendix 8.1. L81(34,23+1) data set for t=12... 159
Appendix 8.2 ANOVA Tables for L8 1(34,23+1) at t=12, 18, 24... 163
Appendix 8.3 ANOVA Ls1(34,23+1) for uncontrollable variables, t=12, 18, t=24 ... 166
Appendix 8.4 Data set for L27(34-,23+1) AOI for t=12... 169
Appendix 8.5 Data structure for L27(34 1 ,23+1) orthogonal array... 170
Appendix 8.6 ANOVA for L2 7(34-1,2 3+1) for t=12, 18, 24 ... 171
Appendix 8.7. L27(34 ,23+1) Response Tables, t=12, 18, 24 ... 174
Appendix 8.8 L2 7(3 4- ,23+1) Plots of Response Tables for t=12, 18, 24 ... 176
Appendix 8.9. AOI ANOVA Tables L27(34 1,23+1) t=12, 18, 24 for uncontrollable v ariab les ... 17 8 Appendix 8.10. Data set for L9(34-2,23+1) for t=12 ... 181
Appendix 8.11. ANOVA L9(34-2,23+1) t=12, 18, 24 for uncontrollable variables... 182
Appendix 8.12. AOI Response Tables L9(34-2,23+1) t=12, 18, 24 ... 185
Appendix 8.13. AOI Plots of Response L9(3 4-,2 3+1) for t=12, 18, 24. ... 187
Appendix 8.13. ANOVA AOI L9(3 4-,2 3+1) for t=12, 18, 24 for uncontrollable variables ... 1 8 9 Appendix 8.14. AOFAT results using L2 7 and L9 data... 192
PART III. In situ Company Experiments... 193
9.0 Protocol for in situ Company Experiments ... 193
9 .1 In trodu ction ... 19 3 9.2 Objectives of the experiments ... 193
9.3 Criteria for experiment selection ... 194
9.4.1 Fram ing the problem ... 195
9.4.2 Establishing the Base-Line ... 200
9.4.3 Forecast the sam ple space... 200
9.4.4 Analyze the data ... 201
9.4.5 Analyze alternatives... 202
9.4.6 Learning about the Decision... 202
9.5 Sum m ary... 203
Appendix 9.1 Feedback Form ... 204
Appendix 9.2 Corporate Problem s and Objectives... 205
Appendix 9.2.1. Keeney's techniques for identifying objectives... 205
Appendix 9.2.2. Smith's approach to conceptualizing objectives... 206
Appendix 9.3 Data Collection for Orthogonal A rrays... 207
Appendix 9.4 D ata Collection for Orthogonal A rrays... 212
Appendix 9.5 Counter-argum entation Form ... 213
10.0 Experiment 3. Electronics Manufacturing Company ... 215
10.1 Introduction... 215
10.2 Fram ing the Problem ... 215
10.2.1 The firm and the decision situation ... 215
10.2.2 Objectives of the experim ent ... 216
10.2.3 The team and inform ation used ... 217
10.2.4 Fram ing decision in D OE norm al form ... 217
10.3 Establish the base-line ... 219
10.3.1 Experim ental data set structure... 219
10.3.2. Establishing the base line: Forecast BA U ... 221
10.4 Forecast of the sam ple space ... 222
10.5 Analysis of the data ... 222
10.5.1 AN OV A sum m ary statistics ... 223
10.5.2 A nalysis of Test Treatm ents ... 225
10.5.3 A nalysis of the Process... 226
10.5. Forecasting confidence ... 230
10.6 A nalysis of alternatives... 231
10.6.1 Response Tables ... 231
10.6.2 A nalysis of A lternatives ... 232
10.7. W hat actually happened?... ... ... ... 235
10.7. Findings from this experim ent... 235
10.7.1 Findings from our client ... 236
10.7.2 Findings about the protocol ... 236
10.7.3 Findings about our m ethod ... 238
10.8. Quality of the Decisions ... 240
10.9. Sum m ary and Conclusions ... 241
10.9.1 Sum m ary of Findings ... 242
10.9.2. Sum m ary of Decision Quality ... 242
Appendix 10.1. BAU round 1 and round 2... 245
Appendix 10.2. Team confidence, BAU round 1, 2, and final... 245
Appendix 10.3. Complete forecast data set. ... 246
Appendix 10.4. Analysis of Operator #4's forecasts... 247
Appendix 10.5. Response tables for worst and best environments ... 249
Appendix 10.6. Examples of constructions of alternatives ... 250
appendix 10.6.1. An approach to construction ... 250
appendix 10.6.2. Modified AOFAT procedure ... 251
Appendix 10.7 ANOVA of BAU in best and worst environments ... 253
11.0 Experiment 2. e-business Services Company ... 257
11.1 Introduction ... 257
11.2 Framing the Problem ... 257
11.2.1 The firm and the decision situation ... 257
11.2.2 Objectives for the experiment... 259
11.2.3 The team and information used ... 260
11.2.4 Framing decision in DOE normal form ... 260
11.3 Establish the base-line ... 263
11.3.1 Experimental data set structure... 263
11.3.2 Establishing the base line: Forecast BAU ... 264
11.4 Forecast of the sample space ... 265
11.5 Analysis of the data ... 265
11.5.1 ANOVA summary statistics ... 266
11.5.2 Analysis of Test Treatments ... 268
11.5.3 Analysis of the Process ... 269
11.5.4. Forecasting confidence ... 272
11.6 Analysis of alternatives... 272
11.6.1 Response Tables ... 273
11.6.2 Analysis of Alternatives ... 274
11.7 Analysis of Alternatives from Adaptive One-Factor-at-A-Time (AOFAT)... 275
11.8 W hat actually happened?... 277
11.9. Findings from this experiment... 278
11.9.1 Findings from our client ... 278
11.9.2. Findings about the protocol ... 279
11.9.3 Findings about our method ... 280
11.10. Quality of the Decision... 283
11.11. Summary and Conclusions ... 284
11.11.1. Summary of Findings ... 284
11.11.2. Summary of Decision Quality ... 285
11.11.2 . C onclusions... 285
Appendix 11.1. Client Satisfaction (CSAT) sample questions... 287
Appendix 11.2. Forecast rationale examples... 288
Appendix 11.3. BAU round 1 and round 2... 289
Appendix 11.4. Team confidence, BAU round 1 and round 2, and final... 289
A ppendix 11.6. A N O V A Tables. ... 291
Appendix 11.7. JPM's ANOVA statistics ... 292
A ppendix 11.9. G age R & R ... 294
Appendix 11.10. Response tables for worst and best environments ... 295
Appendix 11.11. Constructed Alternatives... 296
PART IV. Summary, Conclusion, and Future W ork...297
12.0. Evaluation of Our Method ... 297
12.1. Introduction ... 297
12.2. E valuation C riteria... 297
12.3. E valuation ... 298
Chapter 13. Summary, Conclusions, and Future Work... 303
13.1 Sum m ary ... 303
13.2. Contributions to the State of the Art... 306
13.2.1 Demonstrated an engineering approach to corporate decision analysis .... 306
13.2.2. Demonstrated that company decisions can be studied with DOE... 306
13.2.3. Developed debiasing principles and embodied them in an actionable p roto co l... 3 0 7 13.2.4. Demonstrated that a company's forecasting composite can be studied as a measurement system using gage theory ... 308
13.3. Collective Findings from our Experiments... 308
13.3.1 Corporate executives are willing to spend the time... 308
13.3.2 People can forecast complex scenarios with consistency and reliability .. 309
13.3.3 All the variables are strong predictors of the outcomes, in general... 309
13.3.4. The interactions among the controllable variables exist but are small... 309
13.3.5. People will use both orthogonal arrays and Adaptive-One-Factor-At-A-Time (AOFAT) procedure, but for different reasons. ... 310
13.3.6. We have valid experiments... 310
13.3.7. W e have a valid m ethod. ... 310
13.4 . Future W ork ... 3 10 13.4.1 Refine and improve the protocol. ... 311
13.4.2. Study more difficult company problems. ... 311
13.4.3. Deepen the study of Gage R&R in forecasting. ... 311
13.4.4. Deepen the study of solutions to corporate problems using a system design ap p ro ach ... 3 12 13.4.5. Explore the issue of scale in the representation of corporate problems ... 312
List of Figures
Figure 2.3. A hypothetical weighing function under prospect theory ... 31
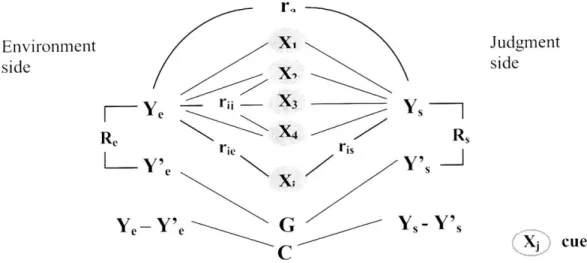
Figure 2.4. The len's model of Social Judgment Theory ... 32
Figure 2.5. Howard's Decision Analysis Cycle... 37
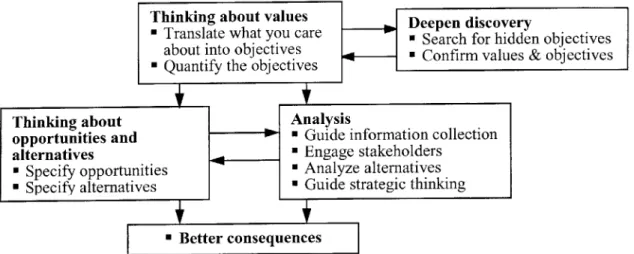
Figure 2.6. Operational architecture of the Value Focused Thinking process. ... 39
Figure 2.7. Active management of real options... 40
Figure 3.1. p-diagram ... 51
Figure 3.2. Sources of variability for measurements... 58
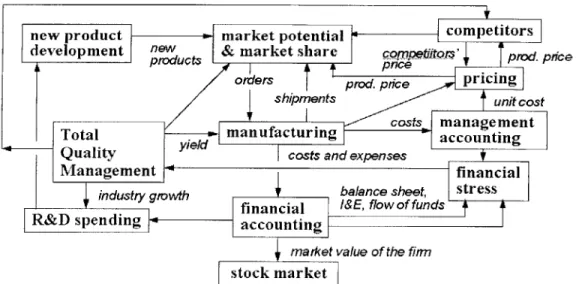
Figure 4.1. Figure 4.2. Figure 4.3. Figure 5.1. Figure 5.2. Figure 5.3. Figure 5.4. Figure 5.5. Figure 5.6. Figure 5.7. Figure 5.8. Figure 5.9. System overview of ADI SD model... 67
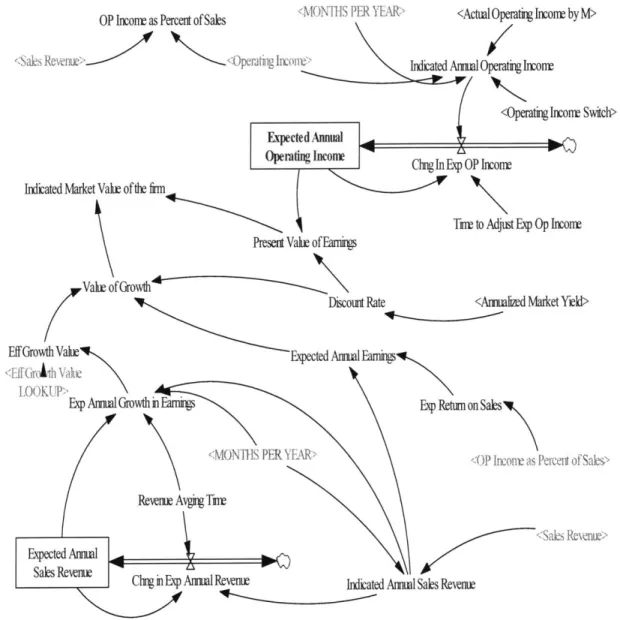
SD stock and flow model for MVF... 69
Snapshot of AOI under different yields. ... 70
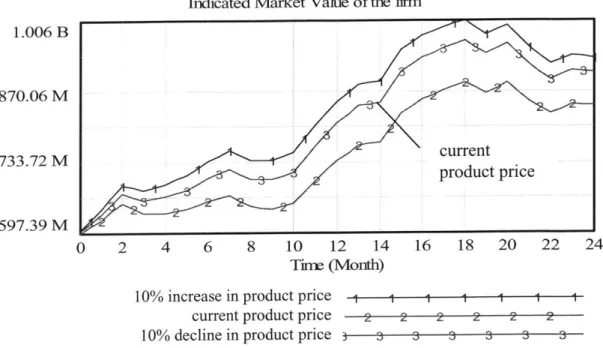
MVF MVF MVF MVF MVF MVF MVF MVF MVF with higher, current, and lower price... 76
with higher, current, and lower yield... 76
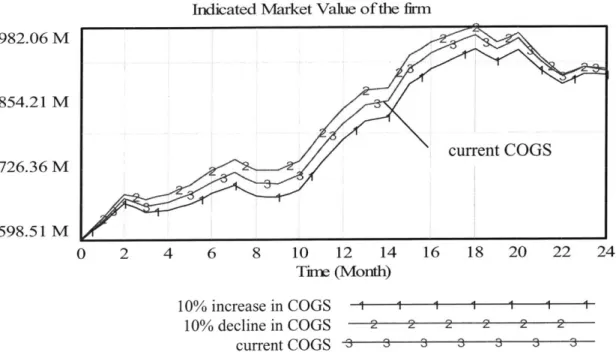
with higher, current, and lower COGS... 77
with higher, current, and lower R&D expense ... 77
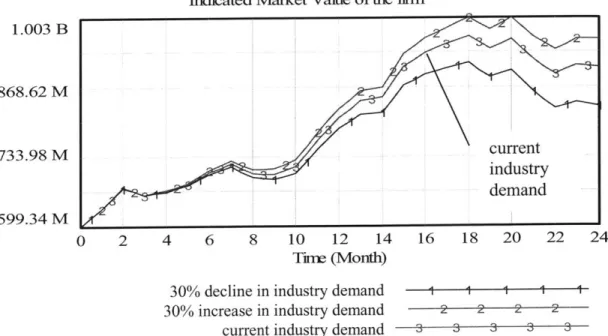
in higher, current, and lower industry demand... 78
with higher, current, and lower competitors' strengths... 79
with higher, current, and lower order rate for ADI. ... 79
under the entire spectrum of uncontrollable conditions ... 81
with surmised best and worst treatments in the best environment. .... 82
Figure 5.10. BAU MVF and a variety of treatments in the best environment. ... 83
Figure 5.11. BAU MVF with a variety of treatments in the worst environment...84
Figure 6.1. L81(34,23+1) residuals of ANOVA of MVF for t=12. ... 89
Figure 6.2. Rotated L81(34,23+1) residuals of MVF for t=12. ... 91
Figure 6.3. L27(3 4- ,2 3+1) residuals of ANOVA of MVF for t=12... 93
Figure 6.4. L27(3 4- ,2 3+1) plots for response and stdev for MVF for t=12... 95
Figure 6.5. Rotated L27(34-1,23+1) residuals ANOVA of MVF for t=12 for uncontrollable variables... 97
Figure 6.6. L'9(34-2,23+1) residuals of ANOVA of MVF for t=12... 99
Figure 6.7. L9(34-2,23+1),) plots for response and stdev for MVF for t=12... 100
Figure 6.8. Rotated L9(3 4-2 ,2 3+1) residuals ANOVA of MVF for t=12. ... 102
Figure 7.1. Figure 7.2. Figure 7.3. Figure 7.4. Figure 7.5. Figure 7.6. Figure 7.7. AOI AOI AOI AOI AOI AOI AOI with higher, current, and lower price. ... 135
with higher, current, and lower yield. ... 136
with higher, current, and lower COGS... 136
with higher, current, and lower R&D expense... 137
in higher, current, and lower industry demand. ... 138
with higher, current, and lower competitors' attractiveness. ... 138
Figure 7.9. AOI with surmised best and worst treatments in best environment... 141
Figure 7.10. AOI and a variety of treatments in the best environment. ... 141
Figure 7.11. AOI with a variety of treatments in the worst environment... 142
Figure 9.1. Sources of variability for forecasts... 202
Figure 10.1. H iTEM net incom e... 216
Figure 10.2. Half Normal plot of residual of forecasts in current environment... 223
Figure 10.3. Sources of variability for forecasts... 226
Figure 10.4 Sources of variability for forecasts... 227
Figure 10.5 Sources of variability for forecasts... 228
Figure 10.6. Sources of variability for forecasts... 229
Figure 10.7. Response plots of Means and Stdev in current environment. ... 232
Figure 10.8 Conceptual construct of our experiment ... 238
Figure 11.1. Half Normal plot of residual of forecasts in current environment ... 266
Figure 11.3. Examples of reproducibility in two environments... 269
Figure 11.4. Examples of repeatability for two operators. ... 270
Figure 11.5. Sources of variability for forecasts... 271 Figure 11.6. Response plots of CSAT and Standard Deviations in current environment.
List of Tables
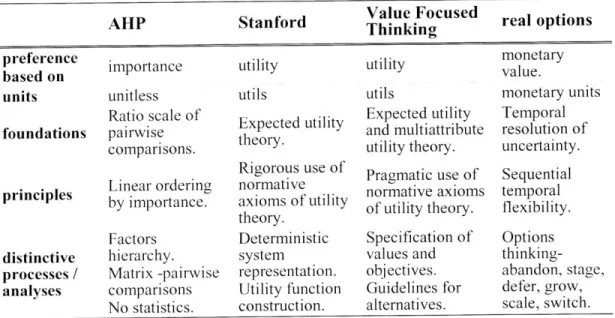
Table 2.2. Summary of four descriptive methods... 36
Table 2.3. Sum m ary com parison... 42
Table 2.4. Objectives of axiom selection for decision analysis... 44
Table 2.5. Objectives of decision analysis quality ... 45
Table 3.1. Analysis of Variance Table for Two-factor Fixed Effects Model... 54
Table 3.2. Adaptation of Gage R&R to DOE-based decision analysis ... 59
Table 4.1. Examples of endogenous and exogenous variables... 68
Table 5.1. ADI's decision situation in DOE normal form... 72
Table 5.2. Controllable factors and levels ... 74
Table 5.3. Uncontrollable factors and levels. ... 74
Table 5.4. BAU and the current environmental condition... 75
Table 6.1. Progression of experiments for DOE testing... 87
Table 6.2. L81(34,23+1) maximum MVF for t=12, 18, and 24... 88
Table 6.3. L81(34,23+1) ANOVA for MVF for t=12... 89
Table 6.4. L81(34,23+1) summary for MVF for t=12, 18, 24. ... 90
Table 6.5. L81(34,23-+1) interactions for MVF for t=12, 18, 24. ... 90
Table 6.6. Rotated L81(34,23+1) for MVF for t=12... 91
Table 6.7. L81(34,23+1) summary for MVF for t=12, 18, 24. ... 92
Table 6.8. L27(3 4-1 ,2 3+1) ANOVA for MVF for t=12. ... 93
Table 6.9. L27(3 4-1 ,2 3+1) summary for MVF for t=12, 18, 24... 94
Table 6.10. L27(3 4- ,23 +1) interactions for MVF for t=12, 18, 24. ... 94
Table 6.11. L27(3 4- ,2 3+1) response table for MVF and stdev for t=12... 94
Table 6.12. M VF for t=12, 18, and 24, L27 vs. L81 ... ... ... ... ... . . 96
Table 6.14. L27(3 4- ,23+1) M VF fort=12, 18, 24... 97
Table 6.15. L'9(34-2,23+1) ANOVA for MVF for t=12... 98
Table 6.16. L'9(3 4-2,23+1) summary for MVF for t=12, 18, 24. ... 99
Table 6.17. L9(3 -,2 3+1) response table for MVF and stdev for t=12. ... 100
Table 6.18. MVF for t=12, 18, and 24, L9 vs. L27 and L81. ... 101
Table 6.19. Rotated L2 7(34 1 ,23+1) for MVF for t=12, 18, 24. ... 101
Table 6.20. L9(34-2,23+1) summary for MVF for t=12, 18,24. ... 102
Table 6.20. AOFAT for M VF for t=12, 18, 24. ... 104
Table 6.21. MVF for t=12, 18, and 24, L9 vs. L2 7 and L81 comaprisons... 104
Table 6.22. Controllable factors explanatory and predictive power t=12, 18, 24 ... 105
Table 6.23. % contribution of interactions to MVF... 106
Table 6.24. p values for uncontrollable variables to MVF for t=12, 18, 24... 106
Table 6.25. MVF for t=12, 18, and 24, OFAT L9 vs. L2 7 and L81 . ... . . . 106
Table 7.1. AOI decision situation in DOE normal form... 133
Table 7.3. Uncontrollable factors and levels. ... 134
Table 7.4. BAU and the current environmental condition... 134
Table 8.1. Progression of experiments for DOE testing... 145
Table 8.2. L8 1(34,23+1) maximum AOI for t=12, 18, and 24. ... 146
Table 8.3. L8 1(34,23+1) summary for AOI for t=12, 18, and 24... 146
Table 8.4. L8 1(34,23+1) interactions for AOI for t=12, 18, and 24. ... 147
Table 8.5. L8 1(34,23+1) summary for AOI for t=12, 18, and 24... 148
Table 8.6. L2 7(34-1,23+1) summary for AOI for t=12, 18, and 24... 149
Table 8.7. L2 7(3 4-1 ,2 3+1) interactions for AOI for t=12, 18, and 24... 149
Table 8.8. AOI for t=12, 18, and 24, L27 vs. L8 1... . . . 150
Table 8.9. L27(34-1,23+1) AOI for t=12, 18, and 24. ... 150
Table 8.10. L'9(3 4-2 +2,2 3+1) summary for AOI for t=12, 18, and 24... 152
Table 8.11. AOI for t=12, 18, and 24, L9 vs. L2 7 and L8 1 . ... . . . 152
Table 8.12. L9(34-,23+1) summary for AOI for t=12, 18, and 24. ... 153
Table 8.13. AOFAT for AOI for t=12, 18, 24. ... 154
Table 8.14. AOI for t=12, 18, and 24, OFAT L9 vs. L2 7 and L81... . . . 155
Table 8.15. p values for controllable factors for AOI for t=12, 18, and 24... 156
Table 8.16. % contribution of interaction to AOI... 156
Table 8.17. p values for uncontrollables for AOI for t=12, 18, 24... 157
Table 8.18. AOI for t=12, 18, and 24, OFAT-L9 vs. L2 7 andL8 1... . .. . .. . . 157
Table 9.1. Experim ental protocol ... 195
Table 9.2. Summary of statistical tests on the data... 201
Table 10.1. Experim ental protocol ... 215
Table 10.2. Framing of HiTEM's decision situation in DOE normal form ... 217
Table 10.3. Controllable factors and levels. ... 218
Table 10.4. Uncontrollable factors and levels. ... 218
Table 10.5 H iTEM 's BA U situation... 219
Table 10.6. Data set structure for the HiTEM experiment. ... 220
Table 10.7. BAU forecasts dispersions decline between round 1 and round 2... 221
Table 10.8. Confidence rises between round 1 and round 2... 222
Table 10.9. ANOVA Table for team forecasts for current environment... 223
Table 10.10. ANOVA for team forecasts for current, worst, and best environments. . 224 T able 10.11. Interactions ... 225
Table 10.12. Comparison of team forecasts versus derived forecasts... 225
Table 10.13. Sources of variability for forecasts... 227
Table 10.14. ANOVA for measurement variances... 228
Table 10.15 Confidence rises between round 1, round 2, and final round...231
Table 10.16. Response Tables for Means and Stdev in Current environment. ... 231
Table 10.17. Derived predictions for BAU. ... 232
Table 10.18. Derived predictions for peers' strategic alternatives ... 233
Table 10.19. Derived predictions for peers' strategic alternatives ... 233
Table 10.20. Response for variations of realistic strategy... 234
Table 10.22. Summary of findings and lessons about our protocol. ... 237
Table 10.23. H iTEM decision quality ... 241
Table 11.1. Experim ental protocol ... 257
Table 11.2. Framing of Yokozuna's decision situation in DOE normal form ... 260
Table 11.3. Controllable factors and levels. ... 261
Table 11.4. Uncontrollable factors and levels ... 262
Table 11.5. eSvcs' BA U situation. ... 262
Table 11.6. Data set structure for the experiment... 263
Table 11.7. BAU forecasts dispersions decline between round 1 and round 2. ... 264
Table 11.8. Confidence rises between round 1 and round 2... 265
Table 11.9. ANOVA Table for team forecasts for current environment... 266
Table 11.10. Team forecasts for current, worst, and best environments... 267
Table 11.11. Interactions of controllable factors ... 267
Table 11.12. Comparison of team forecasts versus derived forecasts... 268
Table 11.13. ANOVA for measurement variances... 270
Table 11.13. Confidence and stdev for round 1, round 2, and final round... 272
Table 11.14. Response Tables for CSAT and Standard Deviations in Current environm ent. ... 2 73 Table 11.15. Derived CSAT for pre-BAU and BAU. ... 274
Table 11.16. Derived CSAT for post-BAU... 275
Table 11.17. Derived CSAT with AOFAT... 276
Table 11.18. Comparison of maximum CSAT, AOFAT versus derived. ... 276
Table 11.19. Derived CSAT for post-BAU cases... 277
Table 11.20. Summary of findings and lessons about our protocol ... 280
Table 11.21. eSvcs Yokozuna decision quality... 283
Table 12.1. Caroll and Johnson's criteria for method evaluation... 298
PART I.
Motivation and literature review
Inductive inference is the only process known to us by which essentially new knowledge comes into the world. ... is the kind of contribution to the intellectual development of mankind which we should expect experimental science would ultimately supply.
R. A. Fisher
1.0 Introduction
Part I, Motivation and Literature Survey, has three chapters. In Chapter 1 we present the motivations for this research, the research questions we will explore, and the contributions of this work. The motivations are rooted in an engineering perspective to a problem of the artificial (Simon 2001) - corporate decisions and their processes. The central idea of this work is that corporate problems and their potential solutions under uncertainty can be studied using engineering methods. Chapter 2 is a survey of the literature of decision theory and decision analysis. The literature reveals three strands of research, the normative, descriptive, and prescriptive strands. We position our work within the prescriptive school. In Chapter 3 we survey the DOE and the Gage R&R method from Measurement System Analysis (MSA). We also position our work as a new domain for DOE and Gage R&R.
1.1 Motivation
This dissertation will explore a new idea: corporate problems and their potential solutions under uncertainty can be studied using engineering methods. Our goal is to investigate the use of two engineering methods; design of experiments (DOE) and measurement system analysis (MSA), to support executive decision-making. These methods are regularly applied in technical domains but are barely visible in the study of organizational decisions or management issues.
Corporate and business-unit level problems are hard*. They tend to be multi-disciplinary, so that discipline specific methods can only offer limited guidance to problem representation and solution optimization. To address this situation, we are taking an engineering approach. Our hypothesis is that as in an engineering system, corporate problems and their potential consequences depend on the behavior of systems and processes under uncertainty. As with engineering systems, the behavior of a company's business systems, although complex, can be studied with experiments (real or simulated). Therefore, DOE presents us with a way to study the behavior of the corporate systems within which decisions are made and to estimate consequences of candidate decisions as scenarios. The experiments to be employed are a carefully constructed set of gedanken or "thought" experiments comparable in structure to
conventional "what if' studies, but organized to span the entire space of controllable and uncontrollable options.
The theories of DOE present us with methods to specify experimental constructs for understanding and analyzing decisions for complex corporate problems. This is significant because:
- these experimental constructs are created using variables that management can control as well as variables beyond management control. DOE presents us with methods to determine a sufficient set of options to explore.
- we can make predictions of outcomes over a complete solution space and under a wide range of uncertainty conditions based on a limited set of experiments.
- we can represent an ensemble of plausible solutions and associated measures of uncertainty rather than a single solution for executive consideration.
- we can predict the phenomenological system-behavior of the corporate business processes resulting from potential decisions, without having detailed a priori knowledge of the system's structure or function.
As in a physical experiment, the quality of the data depends on the instruments and the procedures for using them. We will consider the composite consisting of the organization, their knowledge, data bases, formal and informal procedures as a measurement system. Gage theory from Measurement System Analysis (MSA) presents us with methods to analyze the quality of the experimental results and of the organization and its processes. This is significant because:
- we can identify sources of measurement system weaknesses that contribute to low quality data so that we can formulate and target meaningful improvements.
Decision-making is jealously guarded by senior executives as a "power reserved." Our objective is not to make corporate level decisions. Rather, it is to provide a more complete and systematic analysis than is currently practical and to provide the results of this analysis to corporate leaders in a form that is particularly useful to them.
1.2 Research Questions
This research presents a new approach to the decision-analysis of complex corporate level problems. In this dissertation, we explore the following:
- A new prescriptive method for decision analysis. Can an engineering approach that is based on DOE and MSA be effective to help executives make better decisions? Is there support for the validity of such an approach and such a method?
- A new domain for DOE. How effectively can the phenomenological behavior of a corporation's business systems and processes be represented and analyzed using
Design of Experiments? How is this analysis constrained by properties of the corporate system?
- A new domain for Gage theory. For quantitative forecasting, can we consider the composite - the organization, their knowledge, data bases, formal and informal procedures - as a measurement system? Can we use Gage theory from Measurement System Analysis to evaluate the quality of that system and the data that are produced? To explore these questions, our research approach is sketched in the next section 1.3.
1.3 Research Approach
State our hypothesis and our research questions. In section 1.1, we presented the motivations for this work. They are rooted in an engineering perspective to problems of the artificial - corporate decisions and their processes "...being molded, by goals or purposes, to the environment in which it lives" and "characterized in terms of functions, goals, [and] adaptation (Simon 2001)." And as we discussed, we selected DOE as our engineering method. This led us to the research questions in Section 1.2. The following paragraphs outline our research approach to these questions.
Develop protocol for experiments. Our first step was to develop an experimental protocol to embody our DOE-based decision-analysis approach into actionable procedures. Following scholars in this field, we adapted the "canonical model" (e.g. Bell, Raiffa, and Tversky 1988, Baron 2000, Bazerman 2002) for decision-making as the architectural "pattern" (Gamma, Helm, Johnson, and Vlissides 1995) for our protocol. We then proceeded to concept-test our method using our protocol.
Test our concept with a surrogate. To concept-test, we used an artifact that behaves as a real firm. Such an artifact, in place of a real firm, served as our concept-testing vehicle for our decision-analysis method. The artifact is a system dynamics (Sterman 2000) model (Sterman, Repenning, and Kofman 1997) of Analog Devices Inc. (2006). This SD model was our "surrogate" to simulate a real firm. Following experimental practice (Yin 2003, Hoyle, Harris, Judd 2002), we subjected both our surrogate and its simulation results to tests of validity.
Develop a data-collection protocol. Since Tversky and Kahnemann's (1974) landmark publication on bias, there has been a torrential discovery of new biases (e.g. Baron 2000). Unexpectedly, there is "little evidence that debiasing techniques are frequently employed in actual practice (Yates, Veinott, Patalano 2003)." To break that precedent, we distilled from the literature a set of debiasing principles and developed a
Perform in situ experiments with companies. We performed two experiments with companies in the field, one in the US with a manufacturing company and another with a Japanese e-business services company. In both experiments, we used our protocols for the experiment and for data collection.
Validate our company experiments. As in our surrogate concept testing, we subjected these two company experiments to tests of validity.
Validate our method. In this work, we established a practice of performing tests of validation for all key procedures and experimental results. Having completed two experiments with our ADI surrogate, one company experiment in the US, and another in Japan, we conclude our work with an evaluation of our method. We apply Carroll and Johnson's (1990) six criteria to this task.
Using the above research approach, we performed a series of experiments to test the validity of our DOE-based method for decision analysis. A summary of our findings and contributions are sketched in section 1.4 below.
1.4 Contributions and Findings
We begin with contributions to the state-of-the-art, follow with technical findings, and close with managerial findings.
1.4.1 Contributions to the state-of-the-art.
We have developed a new prescriptive method that can help senior corporate executes make better decisions. This method is distinctive because it is based on engineering methods. We have uncovered new domains in which DOE and Gage Theory appear effective. We have:
- Demonstrated that company decisions can be studied with DOE. Therefore we can explore the entire solution space
explore outcomes over the entire space of uncertainty systematically construct alternatives for decisions.
" Developed a set of debiasing principles to address overconfidence and embodied them in an actionable protocol. The protocol was effective in our company experiments.
- Demonstrated that a company's forecasting composite can be studied as a measurement system using gage theory. This area is also identified as a new research opportunity.
- Integrated all these procedures into a new prescriptive approach that can help corporate executives make better decisions. A new prescriptive method that is based
on engineering methods. We have subjected our surrogate experiments, our in situ experiments, and key procedures to validity tests specified by scholars. From our findings we infer that our method and experiments are valid.
1.4.2 Technical findings
From our surrogate and company experiments, we find that:
- There is statistical support for our controllable variables as predictors of the outcomes of our corporate decisions.
- Interactions among the controllable variables, though present, are small. This suggests that the system behavior of the phenomena studied with our experiments exhibits the property of near-decomposability (Simon 2001) at the scale in which we have formulated our decision situation.
- Framing the decision situation at the appropriate scale can simplify the representation of complex corporate systems or processes to near-decomposability. Scale refers to the "level at which the descriptors of the system present an internally consistent picture of its behavior (Bar-Yam 1997)." At a large scale, to the observer, the collective behavior of many elementary parts can behave more simply than on a smaller scale. "The central point is: When the independence of the components is reduced, scale of behavior is increased (Bar-Yam 1997, 2003, 2004)." Thus "the dynamic behavior of a nearly-decomposable system can be analysed without examining simultaneously all the interactions of the elementary parts (Simon 1997)." Uncovering and exploring principles of scaling non self-similar systems, such as corporate business processes, are identified as potential research opportunities.
1.4.3 Managerial findings
From our company experiments in the field, we find that:
" Corporate executives will commit their time and organizational resources. Moreover, corporate executives found our analysis insightful and useful.
- People can forecast complex scenarios with consistency and reliability. Our debiasing principles and our data-collection protocol appear effective.
" There is high acceptance for both the orthogonal arrays and adaptive-one-factor-at-a-time procedures, but for different reasons.
These findings suggest that our method is useful to company executives.
1.5 Dissertation Outline
This dissertation is organized into four parts.
Part I, Motivation and Literature Survey, has three chapters. In Chapter 1 we present the motivations for this research, the research questions we will explore, and the contributions of this work. The motivations are rooted in an engineering perspective to a problem of the artificial (Simon 2001) - corporate decisions and their processes.
Chapter 2 is a survey of the literature of decision theory and decision analysis. The literature reveals three strands of research, the normative, descriptive, and prescriptive strands. We position our work within the prescriptive school. In Chapter 3 we survey the DOE literature and we position our work as a new domain for DOE.
Part II, Experiments with a Company Surrogate, is comprised of five chapters. The objectives are to concept-test our decision analysis method and to determine whether there is support for the validity of the method. Chapter 4 presents the reasons why we need a company surrogate, the criteria for its selection, and why we selected the Analog Devices Inc. (ADI) system dynamics (SD) model as our surrogate. Chapter 5 presents the analysis that validates the ADI SD model as a surrogate for the objective of maximizing the value of the firm. Chapter 6 puts the surrogate to use. The objective is to determine whether there is support for our method for the corporate problem of firm value maximization. Chapters 7 and 8 repeat the procedures of Chapters 5 and 6 for a different corporate objective, viz. maximizing annual operating income.
Part III, in situ Company Experiments, has three chapters. The objective is to take our decision-analysis method to the field and report on two company experiments. Chapter 9 presents the objectives of the company experiments and the criteria for company selection. It is followed by a detailed discussion of the protocols we defined and used for our company experiments. This discussion includes a survey of the literature that guided us in its development. The protocol is distinctive because it embodies informational and procedural debiasing methods. Chapter 10 discusses the decision analysis experiment with an American electronics manufacturing company. Chapter 11 discusses the experiment with an e-business services company in Japan. Both experiments are subjected to tests of validity and reliability. We also evaluate the quality of the decisions studied using Howard's six criteria of decision quality (Howard 2001). The findings and conclusions of these tests and evaluations are reported in the respective chapters.
Part IV has only two chapters. Chapter 12 presents an overall evaluation of our method. The evaluation uses Carroll and Johnson's (1990) criteria for evaluating decision research methods. Chapter 13 titled Summary, Conclusions, and Future Work begins with an executive summary of this dissertation. This is followed by a summary of our contributions and key findings from this research. Then we close with a discussion on future research that will deepen our understanding of the use of DOE and MSA for corporate decisions, improve its utility in the domain of corporate decisions, and explore the topic of multiscale properties of non self-similar complex systems, such as corporate systems and processes.
2.0 Decision Theory Literature Survey
2.1 Introduction
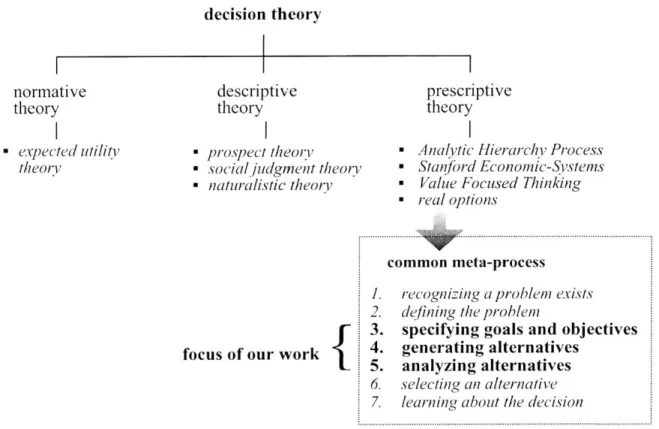
This chapter presents a survey of the decision making literature. This survey is necessarily selective because the body of work is so vast*. We structure this chapter as shown in Figure 2.1. Using this framework, we will locate our work in the prescriptive branch of the tree. We will then highlight the rationale for this positioning, as well as, the salient points of our contributions. But we defer any detailed discussions of our work to the rest of this document.
decision theory normative theory descriptive theory prescriptive theory - exp)ected utility theory prospect theorv
social judgment theory naturalistic theory
Analytic Hierarchy Process Stan/brd Economic-Systems
Value Focused Thinking real options
focus of our work
{
common meta-process
1. recognizing a problem exists
2. defining the problem
3. specifying goals and objectives 4. generating alternatives
5. analyzing alternatives
6. selecting an alternative
7. learning about the decision
Figure 2.1. Chapter structure in graphical form
Scholars identify three research streams: the normative, descriptive, and prescriptive schools of decision-making. For our survey, we will select key representative work from each of the three streams as shown in each leg of the tree. Following a brief survey of the normative and descriptive school, we sketch some apparent new directions in research. In the prescriptive stream, we select four strands of research as exemplars of prescriptive methods. These are shown as the right-hand branch of our tree. We will * Edwards and von Winterfeldt (1986) write that "articles related to judgment and decision-making appeared in more than 500 different journals." Under "decision theory," Google scholar
-show that although each prescriptive method is unique, there is a meta-process that can represent each prescriptive method. This meta-process is known as the "canonical model" of decision making. Our work belongs in the prescriptive school. And within this school, our work is specifically located in the construction phase, i.e. the generation of alternatives, as well as, the analysis phase of the meta- model. This is the design phase of the decision process. Design, the subject of identifying and creating alternatives is virtually absent in the decision-making literature. It is generally assumed that alternatives exist, are easily found, or readily constructed. Simon (1997a) observes: "The classical view of rationality provides no explanation where alternate courses of action originate; it simply presents them as a free gift to the decision markers."
Other scholars note that "Unfortunately, this question has received relatively little attention in the judgment and decision-making literature ... (Johnson and Raab 2003). This void is surprising because synthesis must necessarily precede analysis; analysis that determines the decision maker's preferences among the alternatives and which culminates in the selection of the one choice to act upon. Analysis has crowded out synthesis. Consistent with our engineering orientation, we will use an engineering approach to specify, design, and analyze alternatives. We have excluded the selection of an alternative, i.e. what is generally considered decision-making, from our work. Our work in this dissertation concentrates on the construction and analysis of alternatives.
2.2 The three schools of decision making
A decision is making a choice of what to do and not to do, to produce a satisfactory
outcome (e.g. Baron 1998, Yates et al. 2003). A decision is a commitment to action, an irreversible allocation of resources, and an ontological act (Mintzberg 1976, Howard 1983, Chia 1994, March 1997). Decision theory is an interdisciplinary field of study to understand decision-making. It is a "palimpsest of intellectual disciplines (Buchanan 2006)". It draws from mathematics, statistics, economics, psychology, management, and other fields in order to understand, improve, and predict the outcomes of decisions under particular conditions.
The origins of modem decision theory are found in Bernoulli's (1738) observation that the subjective value, i.e. utility, of money diminishes as the total amount of money increases. And to represent this phenomenon of diminishing utility, he proposed a logarithmic function (e.g. Fishburn 1968, Kahneman and Tversky 2000). However, utility remained a qualitative concept until the seminal work of von Neumann and Morgenstern (1947). They generalized Bernoulli's qualitative concept of utility (which was limited to the outcome of wealth), developed lotteries to measure it, formulated normative axioms, and formalized the combination into an econo-mathematical
structure -utility theory. Savage (1972) made a seminal contribution with his postulates and rigorous development of subjective probability. Since then, the volume of research in decision making has exploded. Bell, Raiffa, and Tversky (1988); Smith and von Winterfeldt (2004) have segmented the contributions in this field into three schools of thought "that identify different issues ... and deem different methods as appropriate (Goldstein and Hogarth 1997)." They are the normative, descriptive, and prescriptive schools of decision making. We follow Keeney (1992) and summarize the salient features of these three schools in Table 2.1.
Table 2.1. Summary of normative, descriptive, and prescriptive theories
normative descriptive prescriptive
how people should how and why people help people make better
focus decide with logical decisions
consistency dprepare people to decide
criterion theoretical adequacy empirical validity efficacy and usefulness classes of decisions specific decisions for
scope all decisions tested specific problems
theoretical cognitive sciences normative and
foundations utility theory axioms psychology about descriptive theories beliefs and preferences decision analysis axioms operational analysis of alternatives prevention of processes and
opeatona dterinngsystematic human procedures
focus determinng errors in inference and end-end decision
life-preferences decision-making cycle
judges
"theoretical sages" experimental researchers applied analysts2.2.1 Normative Decision Theory
"Rationality is a notoriously difficult concept to understand." O'Neill
Unlike planetary motion, or charged particles attracting each other, decisions do not occur naturally; they are acts of will (Howard 1992). Therefore, we need norms, rules, and standards for decision-making. This is the role of normative theory. Normative theory is concerned with the nature of rationality, the logic of decision making, and the optimality of outcomes determined by their utility. Utility is a unitless measure of the desirability or degree of satisfaction of the consequences from courses of action selected by the decision maker (e.g. Baron 2000). Utility assumes the gambling metaphor where only two variables are relevant: the strength on one's belief's (probabilities), and the desirability of the outcomes (Goldstein and Hogarth 1997). The expected utility function for a series of outcomes with assigned probabilities takes on the form of a
polynomial of the product of the probabilities and outcome utilities (e.g. Keeney and Raiffa 1993, de Neufville 1990). For the outcome X={x1,x2, ... , xn}, their associated
utilities u(xi) and probabilities pi for i=1,2, ... ,n, the expected utility for this risky situation is
u(X)=Ipiu(xi) where Epi= 1.
In order to construct a utility function over lotteries, there are assumptions that need to be made about preferences. A preference order must exist over the outcome set {xi}. And the VNM axioms of: completeness, transitivity, continuity, monotinicity, and independence must apply (e.g. de Neufville 1990, Bell, Raiffa, Tversky 1995 edition, Resnik 1987, and Appendix 2.1). The outcomes and their utilities can be single attribute or multiattribute. For a multiattribute objective X ={X, X2,...XN} and N ;, under the
assumptions of utility independence, the utility function U takes the form: KU(X)+ 1 =]f(KkiU(Xi)+ 1)
Where the attributes are independent, the utility function takes the form of a polynomial. A person's choices are rational, when the von Neumann and Morgenstern axioms are satisfied by their choice behavior. The axioms establish ideal standards for rational thinking and decision making.
In spite of its mathematical elegance, utility theory is not without crises or critics. Among the early crises were the famous paradoxes of Allais and Ellsberg (Allais 1953, Ellsberg 1961, e.g. Resnick 1987). People prefer certainty to a risky gamble with higher utility. People also have a preference for certainty to an ambiguous gamble with higher utility. Worse yet, preferences are reversed when choices are presented differently (e.g. Baron 2000). Howard (1992) retorts that the issue is one of education. Enlighten those that make these errors and they too will become utility maximizers. Others claim that incentives will lower the cost of analysis and improve rationality, but research shows that violations of stochastic dominance are not influenced by incentives (Slovic and Lichtenstein 1983). These paradoxes were the beginning of an accumulation of empirical evidence that people are not consistent utility maximizers or rational in the VNM axiomatic sense. People are at times arational.
A significant critique of classical normative theory was Simon's thesis of bounded rationality (Simon 1997b). Simon's critique strikes normative decision theory at its most fundamental level. Perfect rationality far exceeds people's cognitive capabilities to calculate, to have knowledge about consequences of choice, or to adjudicate among competing goals. Therefore, people satisfice, they do not maximize. Bounded rationality is rational choice that takes into consideration people's cognitive limitations. Similarly, March (1988, 1997), a bounded rationalist, observes that all decisions are about making two guesses - a guess about the future consequences of current action and a guess about future sentiments with respect to those consequences (March 1997). These guesses assume stable and consistent preferences. Kahneman's (2003) experiments cast doubt
on these assumptions; they show that decision utility and predicted utility are not the same. Keeney (1992) a strong defender of classical normative theory, identifiesfairness as an important missing factor in classical utility theory. In general, people are not egotistically single-minded about maximizing utility. For example, many employers do not cut wages during periods of unemployment when it is in their interest to do so (Solow 1980). The absence of equity also poses the question about the "impossibility of interpersonal utility comparisons (Hausman 1995)." Sense of fairness is not uniform. Nor does utility theory address the issues of regret (Eppel et al 1992), which has become an important research agenda for legal scholars (Parisi and Smith 2005).
Experimental evidence is another contributing factor to the paradigmatic crises of normative theory. Psychologists have shown that people consistently depart from the rational normative model of decision making, and not just in experimental situations with colored balls in urns. The research avalanche in this direction can be traced to Tversky and Kahneman's (1974) article in Science and subsequent book (Kahneman, Slovic, Tversky 1982) where they report that people have systematic biases. Baron (2000) reports on 53 distinct biases. In light of these research results, Fischoff (1999), Edwards and von Winterfeldt (1986) report on a variety of ways to debias judgments. The analytic power of pure rational choice is not completely supported by experiments and human behavior because it does not address many human cognitive errors as presented by descriptive scholars. The contributions from psychologists to economic theory and decision-making have a high level of legitimacy and acceptance. Simon and Kahneman have both become Nobel laureates. Research in behavioral economics is thriving (e.g. Camerer, Lowenstein, Rabin 2004).
We note that many of the arguments and experiments that critique the normative theory are grounded in descriptions of how decision making actually takes place. Therefore, we now turn our attention to descriptive theory and then consider new research directions in decision making.
2.2.2 Descriptive Decisions Theory
"[let them] satisfy their preferences and let the axioms satisfy themselves."
Samuelson
Descriptive theory concentrates on the question of how and why people make the decisions they do. Simon (e.g. 1997) argues that rational choice imposes impossible standards on people. He argues for satisficing in lieu of maximizing. The Allais and Ellsberg paradoxes illustrate how people violate the norm of expected utility theory (Allais 1952, Ellsberg 1961, and e.g. Baron 2000, Resnick 1987). Experiments by Kahneman and Tversky's (1974) publication of "judgments under uncertainty: