Lasers Med Sci 1998, 13:55-65 © 1998 Springer-Verlag London Limited
Determination of Tissue Optical Properties by
Steady-State Spatial Frequency-Domain
Reflectometry
N. D6gnitz and G.
Wagni~res
Institute of Environmental Engineering, Swiss Federal Institute of Technology (EPFL), Lausanne, Switzerland
Abstract. A new non-invasive method to measure the optical properties of biological tissue is described. This method consists of illuminating the investigated sample with light which is spatially periodically modulated in intensity. The spatial modulation of the backscattered light and the diffuse reflectivity of the sample, both detected with an imaging technique, are used to deduce the absorption and reduced scattering coefficient from a table generated by Monte Carlo simulations. This principle has three major advantages: Firstly, it permits the immediate acquisition of the average values of the optical coefficients over a relatively large area (typ. 20 mm in diameter), thus avoiding the perturbations generated by small tissue heterogeneities; It also provides good flexibility for measuring the optical coefficients at various wavelengths and it does not require the use of a detector with a large dynamic range. The method was first validated on phantoms with known optical properties. Finally, we measured the optical properties of human skin at 400 nm, 500 nm, 633 nm and 700 nm in vivo.
Keywords: Absorption coefficient; Optical properties; Reduced scattering coefficient; Skin; Spatial frequency-domain reflectometry; Tissue optics
INTRODUCTION
A knowledge of light distribution in living tissue is useful in predicting, analysing and u n d e r s t a n d i n g the photobiological, photo- physical, and p h o t o c h e m i c a l processes which occur in such a medium. Numerous models of light distribution in homogeneous turbid media have been described in r e c e n t years. Most of them are based on the t r a n s p o r t equation and the diffusion a p p r o x i m a t i o n [1-3]. The d i s t r i b u t i o n of red and n e a r infrared light in tissue can be obtained with a n a l y t i c a l solutions of the diffusion equation for simple geometrical conditions or with n u m e r i c a l tech- niques such as M o n t e Carlo simulations [4,5]. These solutions are used, for example, to optimise the p h o t o d y n a m i c t h e r a p y of cancer [6] or to model and optimise the charac- t e r i s a t i o n of tissues using light-induced fluorescence spectroscopy [7,8].
A turbid medium can be c h a r a c t e r i s e d by four optical parameters: the absorption ~i a
Correspondence to: Georges Wagni~res, EPFL-DGR-LPAS,
CH-H5, CH-1015 Lausanne, Switzerland.
(mm -1) and the s c a t t e r i n g gs (mm-1) co- efficients defining the probability p for a p h o t o n to be absorbed ( p = l - e x p ( - g~z)) and scattered ( p = l - e x p ( - g s z ) ) respectively in the p a t h l e n g t h z, the phase f u n c t i o n describ- ing the probability density for a p h o t o n to be scattered in a c e r t a i n direction, and the refrac- tive index ntissue. In the case of an anisotropic phase function, as found in biological tissue, the H e n y e y - G r e e n s t e i n [9] and R a y l e i g h - G a n s [10,11] functions are often used. The s c a t t e r i n g is described by the average cosine g of the s c a t t e r i n g angle. Typical values of g r a n g e between 0.8 and 0.95 [12] for soft mammalian tissues. The r e d u c e d s c a t t e r i n g coefficient ~ ' = g s ( 1 - g ) can be used to describe the scattering, if two kinds of s c a t t e r i n g media give the same light distribution, which have identical ~a but different a n i s o t r o p y p a r a m e t e r g and s c a t t e r i n g coefficient ~ . This is gener- ally a c c u r a t e if the medium is very diffusing, i.e. ~ t s ' > > ~ i a and if the light distribution is studied where it is n o t close to b o u n d a r i e s and the i l l u m i n a t i o n point [13,14]. Often it is appro- priate to describe the p r o p a g a t i o n of light by the diffusion model p a r a m e t e r }xef r (ram- 1), the
56 N. D6gnitz and G. Wagnibres
effective a t t e n u a t i o n coefficient. It is defined by the relation: ~ e ~ = [3~ia(~ta+~is')] 1/2. Its inverse is the effective p e n e t r a t i o n depth of light.
Several groups have proposed in vivo and ex vivo methods to determine the optical par- ameters of tissues. Ex vivo measurements are obviously more simple to perform t h a n the in vivo ones, however the change of blood con- tents, tissue architecture, oxygenation, etc. between the in vivo and ex vivo conditions as well as the handling of the tissue sample sig- nificantly change the optical coefficients after excision [15]. Several methods were, therefore, investigated in order to obtain the tissue opti- cal coefficients in a non-invasive way. Among these were the following: pulsed photothermal radiometry [16], time-resolved refiectometry [17], frequency-domain reflectometry [18], and relative [19,20] and absolute [21] steady-state spatially resolved diffuse reflectometry. One reported main drawback of these 'local' tech- niques is related to the large fluctuations generated by tissue inhomogeneities located at the illumination and/or detection positions [22].
The method presented below means t h a t such artefacts can be avoided by probing a relatively large area in vivo (typ. 10-20 mm in diameter) while preserving the non-invasive aspects and the possible endoscopic use. The measurement method, a l t h o u g h based on Monte Carlo simulations, gives the necessary information for a medical application in a time frame compatible to the clinical schedule. F u r t h e r advantages include good flexibility to measure the optical coefficients at various wavelengths and the fact t h a t the method does not require the use of a detector (CCD) with as large a dynamic range as the standard spatially resolved refiectometry.
The validation of the steady-state spatial frequency-domain reflectometry (SFDR) method, performed on optical phantoms with known optical properties, is presented below. Finally, as illustration of the capabilities of this method, we report on measurements of the optical properties of the h u m a n skin in vivo at 400 rim, 500 nm, 633 nm and 700 rim.
M A T E R I A L S A N D M E T H O D S
M e t h o d
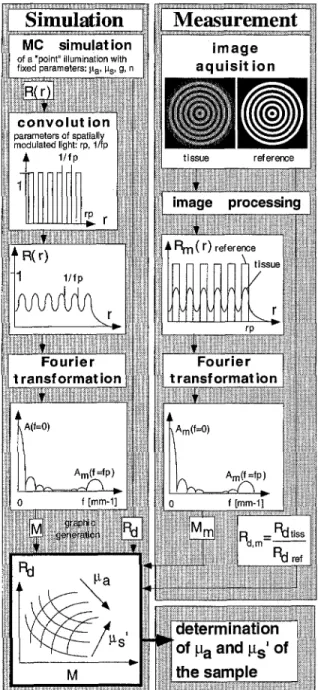
The principle of the SFDR method consisting
of
an i n s t r u m e n t a l and a simulation part isM C s i m u l a t i o n i m a g e
of a "point" Ulumination with
fixed parameters: P-a, P-s, g, n a q u i s it i o n
i ii~ii i i i iii iiiii i i :~iil
i~i~i~parameters
c o n v o l u tof spatiallyiOn
!!ii
~ii~ i:~!!::i}i /
~
modulated,0.t:r0.,,f0 iil iilii
t r a n s f o r m a t i o n
~iiiiiii!iii`~iiii~i~iJiiiiii~iiiiiiiiiii@iii~iiii~ii~:iii~i~iiiii~iiiiiiiiii~i
t A(f=O) 0 f [mm-ll R ( r ),.0
i i!i!
iiiii~i;~.~
F o u r i e r ii[!zii
lii~
L!P f
Fig. 1. Principle of the SFDR method.
presented in Fig. 1. In the simulation part, a table is generated on the basis of a Monte Carlo simulation by Wang and Jacques [23] from which the absorption coefficient ~a and the reduced scattering coefficient Ps' can be determined graphically. The table relates the optical coefficients to the diffuse reflectivity of the sample and to the modulation of the back- scattered light which can both be measured. In the Monte Carlo simulation, a semi-infinite, isotropic and homogeneous tissue is character- ised by its absorption coefficient ~a, the scattering coefficient ~s, the anisotropy factor g, the refractive index n and the layer
Steady-State Spatial Frequency-Domain Reflectometry 57
thickness. The diffuse reflectivity R d of the simulated tissue and the spatial resolved reflectance
R(r)
are calculated for an infinitely narrow light beam incident perpendicularly to the air-tissue interface (radial symmetric geometry). All photons leaving the simulated tissue with different angles are taken into account to calculate the diffuse reflectivity and spatial resolved reflectance.Then, a convolution is performed to yield the spatially resolved reflectance for incident light which is spatially modulated in intensity. The intensity profile of the incident light along the radius is a square wave profile. In other words, the illumination pattern consists of dark and bright concentric rings of equal width, begin- ning with a dark area in the centre. The pat- tern is characterised by its spatial frequency fp (mm-1), the number of bright ring's N and the pattern radius
rp=(N-0.25)/fp.
After the convolution, the spatially resolved reflectanceR(r)
is Fourier transformed and the amplitudes A ( f = 0 ) andA(f=fp)
are obtained. The modulation of the b a c k s c a t t e r e d light is calcu- lated asM=2A(fp)/A(O).
It is noteworthy that for a sample without lateral light propagation in the material, i.e. gs'= ~ and ~ > 0 , the modu- lation isM=4/~.
The Monte Carlo simulation and convolution to calculate the diffuse reflec- tivity and the modulation of the b a c k s c a t t e r e d light are repeated for various values of the absorption and reduced scattering coefficients, but for the same illumination pattern in order to generate the conversion table.To determine the optical properties of a tissue sample, the sample investigated and a 100% reflecting reference material are illumi- nated with light modulated in intensity corre- sponding to the illumination pattern used for the convolution. The b a c k s c a t t e r e d light from the tissue sample and from the reference material is detected with an imaging CCD camera and then analysed to determine the spatial modulation M m of the backscattered light and the diffuse reflectivity Rd, m of the sample (the index m indicates measured values). The pixel intensities of the tissue and the reference images are integrated to obtain the diffuse reflectivity
Rd, m
of the tissue sample by their ratio:Rd,m=Rd,tiss/Rd,ref.
After deter- mining the pattern centre point, the spatially resolved reflectanceRm(r )
is calculated by averaging the pixel intensity values of the tissue image over all angles between 0 and 2~. The resulting light intensity profile is Fourier transformed and the amplitudes Am(f=0) andAm(f=fp )
are obtained. The modulation is given by Mm= [2Am(fp)/Am(O)]/MTF(fp),
whereMTF(fp)
is the modulation transfer function of the imaging system at the spatial frequency fp. It was determined by taking an image of a backi]luminated 5 gm pin hole placed in the same plane as the sample. The 5 gm light spot was assumed to be an infinitesimal point. The image of the point is the spatial impulse response of the imaging system and theMTF
is given by the normalised Fourier transform of the spatial impulse response [24]. The measure- ment of theMTF
was repeated when a measurement parameter, for example the dis- tance between tissue surface and CCD camera or the wavelength was changed.With the measured diffuse reflectivity of the tissue sample and the modulation of the back- scattered light the absorption coefficient ~ and the reduced scattering coefficient Ps' can be deduced from the table generated by Monte Carlo simulations and convolutions.
Sensitivity of the Method
Different illumination patterns with a various n u m b e r of bright rings, pattern radii a n d spatial pattern frequencies can be used to m e a s u r e the optical properties in a range corresponding to that of soft biological tissues.
First, the influence of the pattern radius o n the m o d u l a t i o n w a s investigated numerically. M o n t e Carlo simulations w e r e calculated for ~a b e t w e e n 0.025 a n d 0 . 2 5 r a m -I a n d gs' b e t w e e n 0.5 a n d 2 . 5 m m - i (g=0.95, ntissue=l.37). Convolutions w e r e p e r f o r m e d for the following conditions: pattern radius b e t w e e n 1.5 a n d 15.5 m m ; N b e t w e e n 1 a n d 8;
fp=0.5 m m - 1
For a given pattern frequency and for values of %>>l/ge~, the modulation does not depend on the pattern radius. Effectively, both amplitudes
A(f=O)
andA(f=fp)
of the Fourier transformation increase linearly with the pattern radius, resulting in a constant modu- lation. If the condition %>>l/~e~ is not satis- fied, the modulation decreases with increasing pattern radius. This effect was seen up to %=11.5mm (N=6) for the conditions as described above. Therefore, the influence of the pattern spatial frequency on the sensitivity of the SFDR method was always investigated for large pattern radii between 31.5 and 37.5 mm with %>>1/g~.58 N. D6gnitz and G. W a g n i 6 r e s O3 0 . 8 0 . 6 0 . 4 0 . 2 ' ' ' I . . . . I . . . . ! . . . . I ' ' ' : f P = O . 5 0 ~ m ~ : - - i ~ ' [ m m -~1 - 0 . 1 6 m m - ' : - - I t - i } 0 . 5 ... ~ ... ~ ... i...~ ... ;.. 0 . 1 0 r a m - : " ' " ~ i i I i . - I " .J-.- " .""I ! --"- ~ --a "-"" ... ~ ... J . . . i ... ..L...,...I.5.._ / - _ ._.. ~ ~ ---- ... .: .. ... ...
:::::::::::::::::::::::::::::::::::::::::::
, , , I , , , ~ I , , , , , , , , I , , , 0.1 0 . 2 0 . 3 0 . 4 ~ a [ m m - ~ ] ( a ) 1 . 2 1 0 . 8 "~ 0 . 6 (o 0 . 4 0 . 2 0 - 0 . 2 : f p - 0 . 5 0 m m -~ ' - - - i i # a [ ~ m " ] : - i O : l ~ r . ~ ' ~ i . . . i ... i ... ~ O ; 0 S - i ~ ~ . 0 1 0 7 5 : 0 . 1 0 m m ~ i . . . !i , I ~ i ~ . . . ... .../: ... ! ... ! ... i ... i ... ~ , , , i , , , i , , , i , , , i , 0 . 4 o . a 1 . 2 1 . 6 2 ( b ) ~ts' [ m m ~] - 0 . 4 - 0 . 6 =L -0.8 CO -1 - 1 . 2 ' ' ' I ' ' ' ' I . . . . I ' ' ' ' I ' ' ' o.t 0.2 0.3 0.4 ,a [rnm-,1 ~,cj 1 . 2 "~. 0 . 8 0 3 0 . 6 0 . 4 I I ' ' * I ' ' . . . . . . ' I 't . . .;ii:u../
- ooi ; 0.4 0.8 1.2 1.6 2 ( d ) ~ s ' [ m m 1] Fig. 2 . ( a ) S e n s i t i v i t y SM,,a; (b) s e n s i t i v i t ySMP.s,
( C ) s e n s i t i v i t y SR~,,,; (d) s e n s i t i v i t y SR~,,, fn=0.5, 0 . 1 6 a n d 0 . 1 m m - ~ . F o r s i m u l a t i o n p a r a m e t e r s s e e t e x t .To find the optical p a t t e r n frequency, the influence on the sensitivity of the SFDR m e t h o d was i n v e s t i g a t e d numerically. M o n t e Carlo simulations were c a l c u l a t e d for several c o m b i n a t i o n s of the optical properties b e t w e e n ~ = 0.05~).5 mm - ~ and p~'= 0.5-2 mm - 1 (g=0.95, nti~,~=1.37). Convolutions for t h r e e different p a t t e r n frequencies fp=0.5, 0.16 and 0.1 r a m - ~ were c a l c u l a t e d for all M o n t e Carlo simulations in o r d e r to g e n e r a t e t h r e e conver- sion tables to deduce the optical properties. The typical c o m p u t a t i o n time to g e n e r a t e such a table from M o n t e Carlo simulations and c o n v o l u t i o n s is a p p r o x i m a t e l y one week with a Sun Sparc s t a t i o n 10/41.
The following a n a l y t i c a l development was used to find the optical p a t t e r n frequency. The r e l a t i v e v a r i a t i o n s
E M
and ERa of the modula- tion and diffuse reflectivity depend on the r e l a t i v e v a r i a t i o n s E ~ and Eg, of the optical parameters:EM=SM,,5~ + SM,~'E~,
(la)ER =SRa,~ E,o+ SRa,,/E~o,
(lb)Thereby, the sensitivities of the m o d u l a t i o n
SM
and of diffuse reflectivity SR~ to relative v a r i a t i o n s of ~a and Ps' are defined as:SM,.a=(AM/M)(A~ia/~a )-
1 pps,=const" (2a)SM,~/=(AM/M)(Ap ,/~s, )- I
[~a=const. (2b)SRa,,=(ARd/Rd)(A~q/~ )
1 ip,=const" (2c) SRa,~s, =(ARd/Rd)(A~,/~s,)
- 1 ]p~ = const. (2d) T h e y can be determined from the c o n v e r s i o n tables c a l c u l a t e d by the M o n t e Carlo simula- tions and convolutions. The sensitivities shown in Fig. 2(a-d) have been d e t e r m i n e d for ~a=0.05-0.5mm - 1 and ~ ' = 0 . 5 - 2 m m - 1 (g=0.95, nti . . . . =1.37) and for t h r e e different p a t t e r n frequencies fp=0.5 m m - 1 (N= 16), 0,16 mm -1 (N=6), 0.1 mm -1 (N=4). As can be seen in Fig. 2a,SM,~
increases for increasing spatial frequencies which is also the case forSM,~j
(Fig. 2b), if p~' is larger t h a n 1.1 m m - 1 . The change of sensitivity can be explained as follows. The m o d u l a t i o n of the b a c k s c a t t e r e d light reaches its maximum, resulting in lowSteady-State Spatial Frequency-Domain Reflectometry 59 Table 1. Maximal relative errors E~ and E , ' for
g~=0.0625 ram- 1 ~'=1.875 mm- ~, EM= ~: 0.05, Era= + 0.02 and three different pattern spatial fre- quencies Relative errors E~ and E~' f,=0.5 mm- 1 fp=0.166 mm- fp =0.1 mm- 1 E, =0.08, E, '=0.05 E, =0.10, E~j=0.07 E, =0.14, E, '=0.11
sensitivity if the effective penetration depth is much smaller t h a n the inverse of the pattern frequency, i.e. if only a minor proportion of the light penetrates into the non-illuminated pat- tern areas. On the other hand, the modulation reaches its minimum, also resulting in a low sensitivity, if the effective penetration depth is much larger t h a n the inverse of the p a t t e r n frequency, i.e. if the light penetrates a long way t h r o u g h the non-illuminated pattern areas.
The sensitivities SR,,a and SR,~s', which are shown in Fig. 2c and d depend only on the optical properties and not on the spatial p a t t e r n frequency.
The relative error of the optical parameters due to the relative measurement error of Rd, m and M m can be obtained by resolving equations (la) and (lb) for E ~ and E~s:
-- SRa,.'/SRa,g.) I ( E M / S M , p . - - ERa/SRa,p.) ( a a ) E,a=(SM.ga/SM.~t. '
_ _ SRd,P,a/SRd,P,s, ) - - 1 (EM/SM.g~ -- E R J S R d . , ~ ) , , (ab)
E,~ and E , , have been calculated for g~ between 0.0625 and 0.425mm-~, for g~' between 0.825 and 1.875 mm -1, and for fp=0.5, 0.166 and 0.1 mm - 1 from equations (aa, b) with the sensitivities shown in Fig. 2(a-d) and with the relative measurement errors
ERa= i
0.02,EM= ±
0.05 which were assumed as typicalmeasurement errors of Rd, m and M m. E ~ and Eg, are always smaller t h a n 0.1 for this range of the optical properties and the spatial fre- quency fp=0.5 mm - ~, in contrast to fp=0.16 m m - 1 and fp=0.1 m m - 1. An example of the relative errors of E,~ and E~,. for g~=0.0625 m m - ~ and ~'=1.875 m m - ~ which correspond to the range of optical properties of h u m a n skin at 633nm [25] and to the optical phantoms presented below is given in Table 1. The illumination pattern with
fp=0.5
mm 1 results in smaller errors of thecomputer with
frame grabber and imageprocessing
/
CCD
camerak..___.5 ,~//J~with objective
I I @l --Xearclamp
with bandpass
tuide
plate ~attern:tion
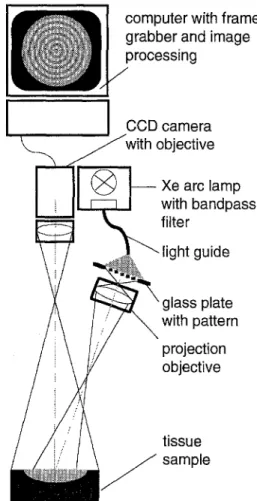
tive ,leFig. 3. Experimental set-up to measure ga and P.s' of a tissue sample with the SFDR method.
optical properties. It was used for all following measurements.
Instrumentation
The experimental set-up to measure Ra, m and M m is presented in Fig. 3. Light from a xenon arc lamp (Lambda DG4, Sutter I n s t r u m e n t Company, Novato, CA, USA) filtered with interference bandpass filters ()~=400, 500, 700 rim, diameter=25 mm, FWHM=40 nm, Andover, Salem, NH, USA; )~=632nm, diameter=25 mm, FWHM =20 nm, Edmund Scientific, Barrington, NJ, USA) was coupled into a liquid light guide (Fluid-Lichtkabel, Karl Storz GmbH, Tuttlingen, Germany) to illuminate homogeneously a glass plate with the p a t t e r n (chrom mask, pattern: diameter=l.55 mm, N=8, Photonics MZD, Dresden, Germany). The image of the p a t t e r n is magnified and focused on the surface of the sample with a projection objective (AF Nikkor, f = 5 0 m m , 1:1.8, Nikon). The spatial
60
frequency fp=0.5 m m - 1 on the sample surface corresponded to the frequency used for the generation of the graphic by Monte Carlo simulations. The sample was illuminated at an angle of a = 7 ° to avoid the detection of specu- lar reflections. The power of light generating the p a t t e r n on the sample is about I mW. The backscattered light was detected by a b/w 16 bit slow scan cooled CCD camera (ST-6, Santa Barbara I n s t r u m e n t Group, Santa Barbara, USA), and a focused image of the sample surface was t a k e n with a telephoto-lens (AF Nikkor, f = 75-210 mn% 1:4-5.6, Nikon). The image was digitised by the 16 bit A/D converter associated with the camera. The image acquisition time was less t h a n 0.5s. The acceptance angle of detection was 1.25 °. Two pictures were t a k e n under the same conditions (camera i n t e g r a t i n g time, etc.), one of the tissue sample and the second of a 100% diffuse reflecting reference sample (white reflectance coating, E a s t m a n Kodak Company, Rochester, NY, USA). Image processing was performed using commercially available software (MATLAB, M a t h w o r k s Inc., Natick, MA, USA) with a Sun Sparc station 10/41. The back- ground was subtracted from the two images.
The graphic to determine the optical co- efficients from a measured set of Rd, m and M m was generated using the following parameters: N=8, rp=15.5 ram, fp=0.5 mm -1, nti .. . . =1.37, 10 ~ photons, g = 0.95, ga = 0.01--1 m m - ~
!
gs =0.25-5 r a m - 1, homogeneous semi-infinite sample. The optical coefficients located between the calculated grid points of the graphic were interpolated linearly.
Optical Phantoms and Tissue Samples
The SFDR method was first validated on optical phantoms with known optical proper- ties. The liquid phantoms were made of de- ionised water loaded with a controlled a m o u n t of Lipoven6s 20% (Fresenius AG, Stans, Switzerland) for scattering and China ink (Rotring, Hamburg, Germany) for absorption. The absorption coefficient of China ink dis- solved in deionised water was deduced from the absorbance A b measured with a spectro- photometer (UVkon, K o n t r o n Instruments, USA) with the expression
ga=Ab/(dlog(e)),
where d is the thickness of the cuvette. A large q u a n t i t y of this solution was prepared in order to use the same solution for all phantoms. The reduced scattering coefficient of LipovenSs in
N. D6gnitz and G. Wagni~res
water was calculated on the basis of measure- ments published by van Staveren et al. [26]. A solution of 15 g Lipoven6s and 405 g H20 gives a phantom with g s ' = 0 . 9 3 m m - 1 (633nm), which is large enough to be assumed as semi- infinite (diameter= 100 ram, 50 mm thick).
Five of the phantoms had identical values of ~ / = 0 . 9 3 m m -~ with different values of ~a between 0.012 r a m - 1 and 0.054 r a m - 1. Eight of the phantoms had identical values of pa=0.054mm -1 with different values of ~s' between 0.93ram -1 and 1.8mm -1. It was assumed t h a t increasing the absorption coef- ficient by adding a small additional a m o u n t of ink solution to the phantom would not decrease the reduced scattering coefficient by dilution. The same was assumed for the influ- ence of an additional a m o u n t of LipovenSs on the absorption coefficient. Calculations showed t h a t increasing the reduced scatter- ing coefficient of the described phantoms from ~ ' = 0 . 9 3 m m - 1 to 1.8 r a m - 1 by adding Lipoven6s results only in a decrease of the absorption coefficient by 3%.
A second indirect method, described by Wagni~res et al. [27] and later referred to as the standard method, was used to measure the phantoms. Its principle consists of measuring the diffuse reflectivity R d and the effective a t t e n u a t i o n coefficient ge~. ga and g~' are obtained graphically from a table generated by Monte Carlo simulations relating the measured quantities to the optical coefficients. The effective a t t e n u a t i o n coefficient was obtained by fitting the exponential decay of the fluence rate versus the sample depth. The fluence rate was measured with an iso- tropic detector designed by Bays et al. [28]. The diffuse reflectivity was determined by integration sphere measurements.
After the measurements on the phantoms, the in vivo optical coefficients of the skin of six Caucasian h u m a n subjects (three males, three females) were determined at 400, 500, 633 and 700 nm. The skin was measured on the inner side of the left forearm. One measurement at each wavelength was performed per subject.
RESULTS
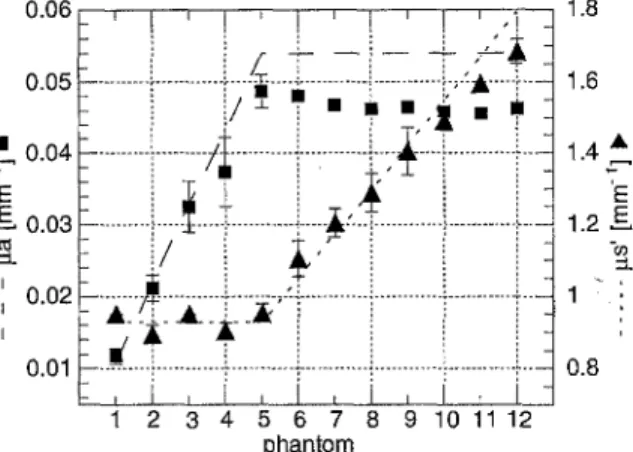
Optical Phantoms
Figure 4 presents the predicted values (dashed and dotted lines) and the optical coefficients of the liquid phantoms measured with the SFDR
Steady-State Spatial F r e q u e n c y - D o m a i n Reflectometry 61
0.06 , , ! ) l ~ , ! , ,1 1.8
i/_
- -i,z
0.05 ... : ... ~ ... -~; ... ~ ... !->-;A---. ~--- 1.6
_00,, i ... i!il ... iii ii i i iii ' i iiiiiii iiiii iiiiii i i?"-
X , .._i ... ~ ... 1 ... i ... [.
00, , i - : ;
: - i ;
;
;
0,
1 2 3 4 5 6 7 8 9 10 11 12 phantom
Fig. 4. Results obtained with the S F D R method on 12 different optical phantoms (symbols) in comparison with the predicted values (lines).
method (symbols) at a wavelength of 633 nm. Four measurements were performed on each phantom and the error bars correspond to the standard deviation on ~a and p~'. The concen- tration of ink in the phantoms was increased linearly from phantom 1 to 5, resulting in a linear increase of the measured values of ga, while the measured p~' remained constant. From phantom 5 to 12, the concentration of LipovenSs in the phantoms was increased lin- early, resulting in a linear increase of the measured values of g~', while ~t a decreased about 8%. Phantoms 2 and 4 were also measured with the standard method. Absorp- tion coefficients of ~=0.016 mm - 1, 0,032 mm - 1 and reduced scattering coefficients of gs' =0.91 mm - 1 and 0.86 m m - 1 were obtained.
T i s s u e S a m p l e s
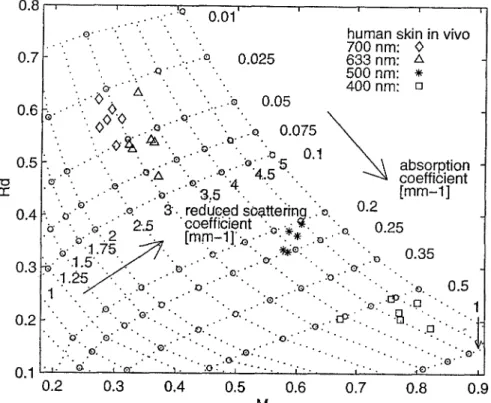
The in vivo optical coefficients of skin of six Caucasian h u m a n subjects (three males, three females) were determined with the SFDR method at 400, 500, 633 and 700 nm. The values are presented in Fig. 5 and Table 2. The errors given in the table correspond to the standard deviation as obtained on the six subjects. As expected, the absorption and reduced scatter- ing coefficients of h u m a n skin decrease with increasing wavelength.
D I S C U S S I O N
S F D R M e a s u r e m e n t s o n O p t i c a l P h a n t o m s T h e o p t i c a l c o e f f i c i e n t s w e r e d e t e r m i n e d w i t h t h e n o n - i n v a s i v e S F D R m e t h o d b a s e d o n t h e
illumination of the investigated sample with spatially periodically modulated light. The absorption coefficients of the phantoms measured with the SFDR correspond well to the predicted ones. The maximum deviation between the predicted and measured values of g~ is 19%. The values determined with the SFDR method are generally lower t h a n the predicted ones. This can be due to an over- estimation of the absorption coefficient from the absorption measurement with the spectro- photometer. The ink solution was assumed to absorb only, therefore any scattering of the ink particles was disregarded. However, depend- ing on the ink particle size, the absorption coefficient could be 30% lower t h a n the one deduced from the absorption measurement with a spectrophotometer, as investigated for India ink by Madsen et al. [29]. The decrease of the absorption coefficient of 8% from phantom 5 to 12 while increasing the scattering coef- ficient by adding LipovenSs is probably due to an interaction between,the absorbing ink par- ticles and the LipovenSs. Phantoms 2 and 4 were also measured with the standard method. - - 1 The absorption coefficients pa=0.016mm and 0.032 m m - 1 were obtained for phantoms 2 and 4, respectively. These values are lower t h a n those predicted by 25% and 27%, respect- ively. Comparing ~i a obtained with the SFDR and the standard method and the predicted values, resulting in less t h a n 27% deviation between them, it can be concluded t h a t the SFDR method is a reliable m e t h o d to deter- mine the absorption coefficient in the range of values corresponding to the typical absorption of red light by soft tissues' with an error of 20%.
The deviation between the reduced scatter- ing coefficient predicted and measured with the SFDR method is always lower t h a n 9%, i.e. essentially within the error bars. The scatter- ing coefficients gs'=0.91 mm -1 and 0.86 mm -~ were obtained f o r phantoms 2 and 4 with the standard method. These values are lower t h a n those predicted by 2% and 7%, respectively, whereas the values obtained with the SFDR are lower by 2% and 5%, respectively. After comparing the results obtained with the SFDR, standard method and the predicted values of gs', resulting in less t h a n 9% devi- ation between them, it can be concluded t h a t the SFDR method is a reliable method to deter- mine the reduced scattering coefficient in the range of values corresponding to the typical scattering of soft tissue.
62 N. D 6 g n i t z a n d G , W a g n i O r e s F i g . 5 . "o n - 0.8 0.7 0.6 0.5 .•e." ' . . ;O . • . - - : " . . "Q ". o - " ' A "" . .:.." "~ ~
o<> 0
o...'Q"
&...
" • - " . ; 0 " • ~ . ...o'Z
~ m Q" : Q . " 0.01' • .e. 0.025 . .e 0.05 .o. 0.075 . o ' " 0"" - - . . . o 0 . 1 • -G" "5 .. :o.'" "4.5 ..o." "4 -.human skin in vivo 700 nm: 0 633 nm: zx 500 nm: * 400 nm: []
X•
absorp.tion coefficient • . . . . ~ ' " 3 . 5 ". [ m m - 1 ]0.4 ' o 'e~ :e.' :J. redLfced sOatterinq ~o 0.2 b" • o - " 2.5 coeffic-ient 'o.~; ~ . ' e 0 25
• % . • 2 " L ~ [ m m - 1 ] ' ~ . . -.~. e . . . . • "
'o.' ' . 1 . 7 5 ~ " / - 'c, . . . . " -~o" "' ". "'" 0 35 0.3 ~'" ".1.5".. " ' / " ' " ' e . . ' " "-.o....'~.i " " . " ' . e . ~ . "
".1.25 / x ' - - . . . " . . . -. - . . - ' ° : " ' . . - .
4 '- .J. "....'o~ . o . '.. ..'o: "- '. :e. 0.5 " "'" ' o ' " ' " "'o'" "'. .:o:: "... : . . . m . . U ' . . . 1
. . . . "o-." " . . ° . " ""
.'m"
"'.5
" ' . " " 0.2 " ".. .": .'o'. .. "o."" ":o: " . . . n " . . , . i l ~" . "o" o : - . - " " . ' o . ' ' " " " . . " ' . . .
":.: "e:" " - . . . "e'.'. " '. "".e.'.' '" . " " . ' - .0." ~ ' ' . " ' ' ' ' ' ' ' ' - " ' ' ' ' " . : 0 "
" " .'0" 0 . 1 """ d , ,.<-. ~. " o . , . . . . . " , . . . , " . . . ' ; e . '
0 . 2 0 . 3 0 . 4 0 . 5 0 . 6 0 . 7 0 . 8 0 . 9 M
Results of in vivo skin measurements, obtained with the SFDR method from the Monte Carlo-generated table.
Table 2. Optical coefficients of skin measured with the SFDR method ~ (mm - 1) ~s' (ram - 1 ) 4 0 0 n m ~ 0.6 ± 0.I 4.15 ~: 0 . 4 4 5 0 0 n m 0.23 ± 0.02 4.09 ~: 0 . 2 8 6 3 3 n m 0 . 0 6 2 ± 0 . 0 1 3 3.20 ~: 0.20 7 0 0 n m 0 . 0 3 8 i 0 . 0 0 8 2 . 8 7 & 0.15 a I n c r e a s e d e r r o r d u e t o b a n d w i d t h o f :L 2 0 n m .
The r e l a t i v e errors on the optical coefficients can be c a l c u l a t e d with equations (3a) and (3b), with t h e sensitivities of the m e t h o d as pre- sented in Fig. 2(a-d) and with the estimated r e l a t i v e m e a s u r e m e n t errors of M m and Rd, m as is shown in Table 1. Essentially, t h r e e sources of e r r o r o c c u r with the SFDR method.
1. S p e c u l a r reflections can be detected in c e r t a i n situations by the CCD camera. This has been observed with p h a n t o m s which r e m a i n e d at a m b i e n t t e m p e r a t u r e for several hours. The oil in the Lipoven6s formed little drops speculary reflecting light to the CCD camera.
2. An i n c o r r e c t d e t e r m i n a t i o n of the centre p o i n t of the b a c k s c a t t e r e d p a t t e r n also gen- orates artefacts as it leads to an underesti- m a t i o n of the modulation.
. For all the measurements performed on both the investigated sample and the 100% reflecting reference, a l a m b e r t i a n light dis- t r i b u t i o n is assumed and moreover, it is assumed t h a t the diffuse reflectivity of the sample (tissue or reference) detected by the CCD camera u n d e r a small solid angle is p r o p o r t i o n a l to the diffuse reflectivity co- incident in a solid angle of 2~. To assess this, two simulations were carried out with typical values of the optical coefficients (~a=0.05mm -1, ~ ' = 3 m m -1, fp=0.5mm). The first was used to calculate the modula- tion consisting all photons b a c k s c a t t e r e d by the tissue, whereas the second only con- sisted of detecting the p h o t o n s leaving the tissue u n d e r a small angle of 1.25 °. Compar- ing b o t h modulations r e s u l t e d in negligible differences smaller t h a n 0.4%. If the distri- b u t i o n of the light b a c k s c a t t e r e d from the samples is not ] a m b e r t i a n this could lead to an e r r o r in the d e t e r m i n a t i o n of the optical properties• An a d a p t a t i o n of the M o n t e Carlo simulation to the detection geometry could avoid this source of error•
T i s s u e
The r e l a t i v e errors corresponding to the stan- dard deviations of the optical coefficients of
Steady-State Spatial Frequency-Domain Reflectometry
skin measured on different subjects range between 8% and 21% for ~a and 5% and 11% for g~', depending on the wavelength. Due to the large illumination area, the fluctuations generated by tissue inhomogeneities are small (Table 2). The in vivo optical coefficients of h u m a n skin have been measured by Kienle et al. [25] and Graaff et al. [15] at 633 nm and 660 nm, respectively. Kienle et al. based their measurements on a three-layer model and Graaff et al. on a semi-infinite model. They determined the coefficients using spatially resolved reflectance methods (SRR). The values obtained by Kienle et al. were: ~ = 0.067 mm - 1, ~s,= 1.62 mm - 1; ~a=0.0026 mm - 1, ~ ' = 1 . 2 m m - 1 and ~ta=0.096 mm 1, g , = 0.53 mm 1 for the superficial (1 mm thick), the second (1 mm thick) and the third layers (semi- infinite), respectively. Graaff et al. obtained g a ~ 0 . 0 1 m m -1 and g~'~l.1 mm 1. The value of ga, determined with the SFDR method is between the values reported by Graaff and Kienle, whereas the reduced scattering coef- ficient is twice as large (see Table 2). This difference can be due to the different n a t u r e of the measuring techniques. Indeed, the SRR method is based on illumination at a single point and detection of the diffuse reflectance at a distance of several millimetres from the illu- mination spot. Photons detected far (several mm) from the illumination point have propa- gated deeply in the medium and are therefore probing deep-seated tissue. Such photons play a less important role in the SFDR method as most of the detected signal is due to the back- scattered photons near the illumination. This means t h a t different tissue volumes are inves- tigated with these methods or in other words, the SFDR method gives values which corre- spond to more superficial tissues t h a n the values given by the SRR method.
Another effect may also explain the discrep- ancy between the values of g~' measured with the SFDR method and the values reported in the literature. Due to the roughness of the tissue-air interface, the light is not reflected speculary in only one direction, and therefore detected in part by the camera despite of the angle between the illumination and detection axis being 7 ° . This results in an overestimation of both Ra. m and Mm, and overestimated values of gs' (Fig. 5). As a precise description of the roughness of skin is extremely difficult to perform, an improvement of the SFDR method consists of avoiding the detection of specular reflections. This can be done by investigating
63 Table 3. Influence of the anisotropy factor g on the diffuse reflectivity and the modulation
g=O g=0.8 g=0.95 g~=0.05 mm-1 Ra=0.277 Ra=0.262 Rd=0.257 g~'=0.5 mm- 1 M=0.226 M=0.114 M=0.102 ga=0.05 mm- 1 Ra= 0.616 Ra=0.616 Rd= 0.617 ps'=5 ram- ~ M = 0 . 5 6 3 M=0.502 M=0.495
the s a m p l e in refractive index m a t c h i n g con- ditions or b y the use of polarised illumination light and detecting the backscattered light t h r o u g h a polariser orientated at 90 °. The Monte Carlo simulation to generate a conver- sion table as presented in Fig. 5 has to be adapted to take into account the modifications proposed here. It should be noted t h a t the roughness of the air-tissue interface also plays a role in most other techniques presented in the literature, but its effect on the measured values has never to our k n o w l e d g e been corrected.
Detecting of the backscattered light near the illumination point is more sensitive to vari- ations of the anisotropy factor due to the small number of scattering interactions. Monte Carlo simulations were performed for three values of the anisotropy factor g=0, g=0.8 and g=0.95 and for two sets of ~a and ~s' to evaluate the influence of g. The simulation parameters were: ntls~ue=l.37, semi-infinite geometry, 10 v photons, fp=0.5mm -1. The values of ~a and g~' of these simulations corre- spond to the range of the skin optical proper- ties at 633 nm and to the optical properties of the liquid phantoms presented in this study. As is shown in Table 3, decreasing g increases the modulation, whereas R d is essentially con- stant. Decreasing g from 0.95 to 0.8 results, for ~s'=0.5mm -1, in relative errors of 23% and 19% for ~a and gs', respectively and, for ~s'=5 ram-1, in relative errors of ~a and ~ ' of 4% and 2%, respectively. The influence of g on the optical properties was determined graphically from the conversion table pre- sented in Fig. 5. As it is known t h a t the anisotropy factor of soft mammalian tissues ranges typically between 0.8 and 0.95 [12], the influence of a variation of g within these limits can be disregarded for the measurements per- formed with the SFDR method. To determine the optical properties of tissues with a low scattering coefficient (~ts'<0.5mm 1), it is
64
necessary to investigate the influence of g on the sensitivity and on the measurement error in dependence of the p a t t e r n frequency.
Finally, an improvement on the SFDR method is to adapt it to a tissue model with a multilayered s t r u c t u r e by Considering the amplitudes of the Fourier transformed at multiples of the spatial frequency fp in order to extract the optical coefficients of the different layers.
CONCLUSIONS
It has been shown t h a t the SFDR method enables a non-invasive and in vivo determi- n a t i o n of the absorption and reduced scattering coefficients of tissue. It is not even necessary to touch the tissue. The new method was validated with phantoms with known optical properties, moreover, the absorption and reduced scattering coefficients of skin were determined at 400, 500, 633 and 700 nm. The coefficients obtained at 633 and 700 nm correspond well to values represented in the literature. A major a d v a n t a g e of the SFDR method is t h a t it uses a relatively large tissue area to determine a mean value of ga and gs'. Therefore, local tissue inhomogeneities have a low influence on the measurement, resulting in low s t a n d a r d deviations. Finally, it should be noted t h a t the SFDR technique is well-suited to performing endoscopic measurements in most of the hollow organs using the imaging capabilities of endoscopes.
ACKNOWLEDGEMENTS
The authors thank Dr A. Kienle and Dr R. Bays for useful discussions and Prof H. van den Bergh for his enthusiastic support of this work. They are grateful to the Swiss Fonds National, the Swiss National Priority Program in Optics, and the fund CHUV-EPFL-UNIL for financial support.
REFERENCES
1. Ishimaru A. Wave propagation and scattering in random media. New York: Academic Press, 1978 2. Patterson MS, Wilson BC, Wyman DR. The propa-
gation of optical radiation in tissue: 1. Models of radiation transport and their application. Lasers Med Sci 1991; 6:155-68
3. Wilson BC, Patterson MS. The physics of photo- dynamic therapy. Phys Med Biol 1986; 31:327-60 4. Wilson BC, Adam G. A Monte Carlo model for the
absorption and flux distributions of light in tissue. Phys Med Biol 1983; 10:824-30
N. D6gnitz and G. Wagni~res
5. Arridge SR, Cope M, Deipy DT. The theoretical basis for the determination of optical pathlengths in tissue: temporal and frequency analysis. Phys Med Biol 1992; 37:1531-60
6. Star W M . Light dosimetry in vivo. Phys M e d Biol 1997; 42:763-87
7. Richards-Kortum R, Sevick-Muraca E. Quantitative optical spectroscopy for tissue diagnosis. A n n u R e v Phys C h e m 1996; 47:555-606
8. Andersson-Engels S, af Klinteberg C, Svanberg K, Svanberg S. In vivo fluorescence imaging for tissue diagnostics. Phys M e d Biol 1997; 47:815-24
9. H e n y e y LG, Greenstein JL. Diffuse radiation in the galaxy. Astrophys J 1941; 93:70-83
I0. v.d.Hulst H C . Light Scattering by Small Particles, N e w York: Dover, 1981
II. Graaff R, A a r n o u d s e JG, de M u l FF, Jentink H W . Light propagation parameters for anisotropically scattering media based on a rigorous solution of the transport equation. Appl Opt 1989; 28:2273-9
12. C h e o n g W , Prahl SA, W e l c h AJ. A review of the optical properties of biological tissues. I E E E J Q u a n t u m Electron 1990; 26:2166-85
13. Graaff R, A a r n o u d s e JG, de M u l FF, Jentink H W . Similarity relations for anisotropic scattering in absorbing media. Opt E n g 1993; 32:244-52
14. Y o o n G, Prahl SA, W e l c h AJ. Accuracies of the dif- fusion approximation and its similarity relations for laser irradiated biological media. Appl Opt 1989; 28:2250-5
15. Graaff R, Dassel A C M , Koelink M H et al. Optical properties of h u m a n dermis in vitro and in vivo. Appl Opt 1993; 32:435-47
16. Prahl SA, Vitkin IA. Determination of optical properties of turbid media using pulsed photothermal radiometry. Phys Med Biol 1992; 37:1203-17
17. Patterson MS, Chance B, Wilson BC. Time resolved reflectance and transmittance for noninvasive measurement of tissue optical properties. Appl Opt 1989; 28:2331-6
18. Patterson MS, Moulton JD, Wilson BC et al. Frequency-domain reflectance for the determination of scattering and absorption properties of tissue. Appl Opt 1991; 30:4474-6
19. Groenhuis RAJ, Ferwerdea HA, Ten Bosch JJ. Scatter- ing and absorption of turbid materials determined from reflection measurements. 1: Theory. Appl Opt 1983; 22:2456-62
20. Groenhuis RAJ, Ten Bosch JJ, Ferwerdea HA. Scatter- ing and absorption of turbid materials determined from reflection measurements. 2: Measuring method and calibration. Appl Opt 1983; 22:2463-7
21. Kienle A, Lilge L, Patterson MS et al. Spatially resolved absolute diffuse reflectance measurements for noninvasive determination of the optical scattering and absorption coefficients of biological tissue. Appl Opt 1996; 35:2304-14
22. Bays B, Wagni~res G, Robert D et al. Clinical determi- nation of tissue optical properties by endoscopic spatially resolved reflectometry. Appl Opt 1996; 35:1756-66
23. Wang L, Jacques SL. Monte Carlo Modeling of Light Transport in Multi-Layered Tissues in Standard C, University of Texas MD, Anderson Cancer Center, Houston, Texas, 1992
24. Wagnigres, G. Photochimiotherapie et photodetection du cancer a l'aide de photosensibilisateurs ou de
Steady-State Spatial Frequency-Domain Reflectometry 65
colorants fluorescents, These No. 1024, EPFL, Lausanne, Switzerland, 1992
25. KienIe A, Lilge L, P a t t e r s o n MS. I n v e s t i g a t i o n of' multi-layered tissue with in vivo reflectance measure- ments. Proc SPIE 2326, Lille, 1994:212-21
26. v a n S t a v e r e n HJ, Moes CJM, v a n Mar]e J et al. Light s c a t t e r i n g in i n t r a l i p i d 10% in the wavelength, r a n g e of 40~1000 nm. Appl Opt 1991; 30:4507-14
27. Wagni6res G, Cheng S, Zellwegger M e t al. An optical p h a n t o m with tissue-like properties in the visible for use in PDT and fluorescence spectroscopy. Phys Med Biol 1997; 42:1-12
28. Bays B, Wagni~res G, Robert D et al. A three- dimensional optical p h a n t o m a n d its applications in
photodynamic therapy. Lasers Snrg Med 1997; 21:227-34
29. M a d s e n SJ, P a t t e r s o n MS, Wilson BC. The use of India ink as a n optical absorber in tissue-simulating phantoms. Phys Med Biol 1992; 37:985-93
30. v a n S t a v e r e n HJ, Beek JF, Ramaekers JWH et al. I n t e g r a t i n g sphere effect in whole bladder wall photo- dynamic therapy: I. 532 nm versus 630 nm optical irradiation. Phys Med Biol 1994; 39:94~59
31. Kienle A, P a t t e r s o n MS. Improved solutions of the steady-state a n d time-resolved diffusion equations for reflectance from a semi-infinite t u r b i d medium. J Opt Soc A 1997; 14:246-54
Paper received 28 July 1997; accepted after revision 3 February 1998.