HAL Id: hal-03044779
https://hal.inria.fr/hal-03044779v2
Preprint submitted on 8 Dec 2020
HAL is a multi-disciplinary open access
archive for the deposit and dissemination of
sci-entific research documents, whether they are
pub-lished or not. The documents may come from
teaching and research institutions in France or
abroad, or from public or private research centers.
L’archive ouverte pluridisciplinaire HAL, est
destinée au dépôt et à la diffusion de documents
scientifiques de niveau recherche, publiés ou non,
émanant des établissements d’enseignement et de
recherche français ou étrangers, des laboratoires
publics ou privés.
inter-subject decoding
Thomas Bazeille, Elizabeth Dupre, Jean-Baptiste Poline, Bertrand Thirion
To cite this version:
Thomas Bazeille, Elizabeth Dupre, Jean-Baptiste Poline, Bertrand Thirion. An empirical evaluation
of functional alignment using inter-subject decoding. 2020. �hal-03044779v2�
Thomas Bazeille1,†,⇤ Elizabeth DuPre2,†, Jean-Baptiste Poline2, Bertrand Thirion1 1Universit´e Paris-Saclay, Inria, CEA, Palaiseau, 91120, France
2Montr´eal Neurological Institute, McGill University, Montr´eal, Canada
†These authors contributed equally to this work.
Inter-individual variability in the functional organization of the brain presents a major obsta-cle to identifying generalizable neural coding principles. Functional alignment—a class of methods that matches subjects’ neural signals based on their functional similarity—is a promising strategy for addressing this variability. At present, however, a range of functional alignment methods have been proposed and their relative performance is still unclear. In this work, we benchmark five func-tional alignment methods for inter-subject decoding on four publicly available datasets. Specifically, we consider piecewise Procrustes, searchlight Procrustes, piecewise Optimal Transport, Shared Re-sponse Modelling (SRM), and intra-subject alignment; as well as associated methodological choices such as ROI definition. We find that functional alignment generally improves inter-subject decod-ing accuracy though the best performdecod-ing method depends on the research context. Specifically, SRM performs best within a region-of-interest while piecewise Optimal Transport performs best at a whole-brain scale. We also benchmark the computational efficiency of each of the surveyed meth-ods, providing insight into their usability and scalability. Taking inter-subject decoding accuracy as a quantification of inter-subject similarity, our results support the use of functional alignment to improve inter-subject comparisons in the face of variable structure-function organization. We provide open implementations of the methods used.
Keywords: fMRI; functional alignment; predictive modeling; inter-subject variability
1. Introduction
A core challenge for cognitive neuroscience is to find similarity across neural diversity (Churchland 1998); that is, to find shared or similar neural processes supporting the diversity of individual cognitive expe-rience. Anatomical variability and limited structure-function correspondence across cortex (Paquola et al. 2019,Rodriguez-Vazquez et al. 2019) make this goal chal-lenging (Rademacher et al. 1993, Thirion et al. 2006). Even after state-of-the-art anatomical normalization to a standard space, we still observe di↵erences in individual-level functional activation patterns that hinder cross-subject comparisons (Langs et al. 2010, Sabuncu et al. 2010). With standard processing pipelines, it is there-fore difficult to disentangle whether individuals are en-gaging in idiosyncratic cognitive experience or if they are engaging in shared functional states that are di↵erently encoded in the supporting cortical anatomy.
To address this challenge, functional alignment is an increasingly popular family of methods for functional magnetic resonance imaging (fMRI) analysis: from the initial introduction of hyperalignment in Haxby et al. 2011, the range of associated methods has grown to in-clude shared response modelling (SRM;Chen et al. 2015) and Optimal Transport (Bazeille et al. 2019) with many variations thereof (see e.g. Xu et al. 2018,Yousefnezhad and Zhang 2017, among others). The conceptual shift from anatomically-based to functionally-driven align-ment has opened new avenues for exploring neural
sim-⇤Correspondence should be addressed to:[email protected]
ilarity and diversity. In particular, by aligning activa-tion patterns in a high-dimensional funcactiva-tional space (i.e., where each dimension corresponds to a voxel), we can discover shared representations that show similar trajec-tories in functional space but rely on unique combina-tions of voxels across subjects. For a review of current applications in the literature, seeHaxby et al. 2020.
Nonetheless, it remains unclear how researchers should choose among the available functional alignment methods for a given research application. We therefore aimed to benchmark performance of existing functional alignment methods on several publicly accessible fMRI datasets, with the goal of systematically evaluating their usage for a range of research questions. We consider perfor-mance to include both (1) improving inter-subject simi-larity while retaining individual signal structure as well as (2) computational efficiency, as the latter is an im-portant consideration for scientists who may not have access to specialized hardware. Technically up-to-date and efficient implementations to reproduce these results are provided at https://github.com/neurodatascience/ fmralign-benchmark.
1.1. Defining levels of analysis: region-of-interest or whole-brain
Functionally aligning whole-brain response patterns at a voxelwise level is computationally prohibitive and may yield biologically implausible transformations (e.g., align-ing contralateral regions). Therefore, currently available functional alignment methods generally define transfor-mations within a sub-region. This constraint acts as a form of regularization, considering local inter-subject variability rather than global changes such as large-scale
functional reorganization. It also divides the computa-tionally intractable problem of matching the whole-brain into smaller, more tractable sub-problems.
An important consideration, then, is how to define a lo-cal neighborhood. Broadly, two main strategies exist: (1) within a given region of interest (ROI) that reflects prior expectations on the predictive pattern or (2) grouping or parcellating voxels into a collection of subregions across the whole-brain. Existing functional alignment methods have been proposed at each of these scales. For example, the initial introduction of hyperalignment inHaxby et al. 2011was evaluated within a ventral temporal cortex ROI and was later extended to aggregate many local align-ments into larger transforms using a Searchlight scheme (Guntupalli et al. 2016). Other methods such as Optimal Transport have been evaluated on whole-brain parcella-tions (Bazeille et al. 2019), where transforms are derived for each parcel in parallel and then aggregated into a single whole-brain transform. Throughout this work, we therefore consider functional alignment methods at both the ROI and parcellated whole-brain level of analysis.
1.2. Quantifying the accuracy of functional alignment
1.2.1. Image-based statistics
A key question is how to objectively measure the per-formance of functional alignment. One approach is to consider alignment as a reconstruction problem, where we aim to reconstruct images from training data us-ing functional alignment. These functionally aligned maps can then be compared with held-out ground-truth maps. We can quantify this comparison using image-based statistics such as the correlation of voxel activity profiles across tasks (Guntupalli et al. 2016,Jiahui et al. 2020), spatial correlation or Dice coefficient between es-timated and held-out brain maps (Langs et al. 2014) or other metrics such as reconstruction ratio (Bazeille et al. 2019). However, these image-based statistics are sensi-tive to low-level image characteristics (e.g., smoothness, scaling), and their values can therefore reflect trivial im-age processing e↵ects (such as the smoothness introduced by resampling routines) rather than meaningful activity patterns.
1.2.2. Adopting a predictive framework to quantify alignment accuracy
Rather than using image-based statistics, an alterna-tive approach is to test functional alignment accuracy in a predictive framework. Prior work adopting this framework has used tests such as time-segment matching from held-out naturalistic data (e.g., Chen et al. 2015, Guntupalli et al. 2016). However, because time-segment matching relies on the same stimulus class to train and test the alignment, it is unclear whether the learnt func-tional transformations extend to other, unrelated tasks— particularly tasks with lower inter-subject correlation
(Nastase et al. 2019). We are therefore specifically inter-ested in predictive frameworks that probe model validity by measuring accuracy on held-out data from a di↵erent stimulus class, with or without functional realignment.
Inter-subject decoding is a well-known problem in the literature aimed at uncovering generalizable neural cod-ing principles. Specifically, in inter-subject decodcod-ing we learn a predictive model on a set of subjects and then test that model on held-out subjects, measuring the extent to which learned representations generalize across individ-uals. In an information-mapping framework ( Kriegesko-rte and Diedrichsen 2019), decoding allows us to assess the mutual information between task conditions. Func-tional alignment, therefore, should facilitate information-mapping by increasing the similarity of condition-specific representations across subjects, thus improving their de-coding.
Although the link between mutual information and de-coding accuracy is non-trivial (Olivetti et al. 2011), we consider that measuring alignment with decoding accu-racy on unseen subjects better fulfils neuroscientists’ ex-pectations of inter-subject alignment in two main ways. First, decoding accuracy provides a more interpretable assessment of performance than other measures such as mutual information estimates. Second, decoding accu-racy on a held-out sample provides insight into the ex-ternal validity and therefore generalizability of derived neural coding principles. Compared to image-based mea-sures, decoding accuracy is thus a more rigorous measure of whether functional alignment improves the similarity of brain signals across subjects while also preserving their structure and usability for broader research use cases. In this work, we therefore quantify functional alignment accuracy by assessing improvements in inter-subject de-coding when using functional alignment over and above anatomical alignment.
1.3. The present study
Using this inter-subject decoding framework, we: (1) establish that functional alignment improves decoding accuracy above anatomical-only alignment, (2) investi-gate the impact of common methodological choices such as whether alignment is learned in subregions across the whole brain or in pre-defined region-of-interest (ROI), and (3) compare the impact of specific alignment meth-ods in whole-brain and ROI-based settings. We then provide a qualitative comparison of the transformations learnt by each method to “open the black box” and provide insights into how potential accuracy gains are achieved. Finally, we discuss the availability, usability and scalability of current implementations for each of the methods considered.
2. Materials and Methods
In this section, we first consider frameworks for aggre-gating local functional alignment transformations into a
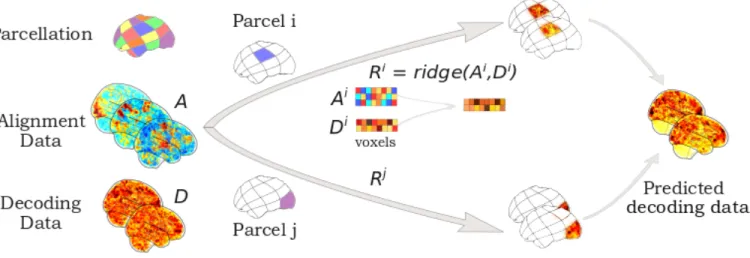
FIG. 1. Principle of functional alignment The goal of functional alignment is to learn correspondence between data drawn from two subjects: from a source subject to a target subject using their synchronized alignment data A. In this paper, each subject comes with additional decoding task data D. Red arrows describe functional alignment methods where correspondence is learnt from Asource to Atarget, while blue arrow describes intra-subject alignment method, where we learn
correlation structure from Asource to Dsource. Solid arrows indicate a transformation learnt during training. Dashed arrows
indicate when the previously learnt transformation is applied in prediction to estimate ˆDtarget.
single, larger transform (Section 2.1.1) that can be ap-plied at a region-of-interest (ROI) or whole-brain scale. We proceed by introducing mathematical notations for functional alignment, then use these notations to dis-cuss the five functional alignment methods included in our benchmark (Section2.2). We next describe our pro-cedure to quantify alignment performance using inter-subject decoding (Section2.3) and a series of experiments aimed at investigating the impact of functional alignment on decoding accuracy (Section2.4). Finally, we describe the datasets used to run each experiment (Section 2.5) and the implementations used (Section2.6).
2.1. Aggregating local alignments 2.1.1. Comparing searchlight and piecewise schemes
As discussed in Section 1.1, alignment methods are closely linked with the definition of local correspondence models. To align the entire cortex across subjects, two main frameworks have been proposed: searchlight and piecewise analysis. Each of these frameworks use func-tional alignment methods to learn local transformations and aggregate them into a single large-scale alignment; however, searchlight and piecewise di↵er in how they aggregate transforms, as illustrated in Figure 2. The searchlight scheme (Kriegeskorte et al. 2006), popular in brain imaging (Guntupalli et al. 2018, 2016), has been used as a way to divide the cortex into small overlapping spheres of a fixed radius. A local transform can then be learnt in each sphere and the full alignment is ob-tained by averaging across overlapping transforms. Im-portantly, the aggregated transformation produced is no longer guaranteed to bear the type of regularity (e.g or-thogonality, isometry, or di↵eomorphicity) enforced dur-ing the local neighborhood fit.
FIG. 2. Comparing piecewise and searchlight align-ment. In this illustration, transformations are derived for the blue, green, and red areas separately. Note that the piece-wise alignment does not include a green area, as this corre-sponds to a searchlight overlapping both the red and blue areas. For non-overlapping parcels, these transformations are stacked into a larger orthogonal matrix. For the overlapping searchlight, these transformations are aggregated, with over-lapping values averaged. Note that the final transformation for the searchlight alignment is no longer orthogonal in this example.
An alternative scheme, piecewise alignment (Bazeille et al. 2019), uses non-overlapping neighborhoods either learnt from the data using a parcellation method—such as k-means—or derived from an a priori functional atlas. Local transforms are derived in each neighborhood and concatenated to yield a single large-scale transformation. Unlike searchlight, this returns a transformation matrix with the desired regularities. This framework might in-duce staircase e↵ects or other functionally-irrelevant dis-continuities in the final transformation due to the under-lying boundaries.
2.1.2. Aggregation schemes used in this benchmark
In the literature to date, searchlight and piecewise ag-gregation schemes have both been used in conjunction with Generalized Procrustes Analysis (detailed in section 2.2) under the names hyperalignment (Guntupalli et al. 2016) and scaled orthogonal alignment (Bazeille et al. 2019), respectively. We therefore include both search-light Procrustes and piecewise Procrustes in our bench-mark. With the exception of SRM—which includes an internal regularization and can therefore be applied di-rectly to the ROI or whole-brain data—every other local method is regularized through piecewise alignment.
As piecewise alignment is learnt within a parcellation, an important question is: which brain atlas should be used for piecewise alignment? In Section S4 we com-pare results from theSchaefer et al. 2018atlases to those from parcellations derived directly on the alignment data. By default, the results presented below are derived with the 300 ROI parcellation of the Schaefer atlas unless noted otherwise. In the case of searchlight Procrustes, we selected searchlight parameters to match those used in Guntupalli et al. 2016 as implemented in PyMVPA (Hanke et al. 2009).
2.2. Description of the benchmarked methods
As we use inter-subject decoding to compare func-tional alignment methods, we can only consider methods that meet the following two criteria. First, the align-ment transformations should be learnt on temporally synchronized (i.e., co-occuring) task data, or on con-trasts matched across individuals. Second, the learnt transformations must be applicable as such on unseen data with a di↵erent task structure. These two crite-ria exclude several methods currently used in the lit-erature such as regularized canonical correlation anal-ysis (rCCA;Bilenko and Gallant 2016), gradient hyper-alignment (Xu et al. 2018), connectivity hyperalignment (Guntupalli et al. 2018), and methods based on Laplacian embeddings (Langs et al. 2014).
Here, we consider five di↵erent alignment methods: searchlight Procrustes (Guntupalli et al. 2016, Haxby et al. 2011), piecewise Procrustes, Optimal Transport (Bazeille et al. 2019), shared response modelling (SRM; Chen et al. 2015), and intra-subject correlations across tasks (Tavor et al. 2016), here referred to as “intra-subject alignment.” We provide a brief summary of these methods below.
2.2.1. General notations
Assume that for every subject we have alignment data A 2 Rp⇥n and decoding task data D 2 Rp⇥d, where
n is the number of alignment time points or frames, d the number of decoding task image and p is the number of voxels. The alignment and decoding task data are collected for both source and target subjects, which we
denote with superscripts.
In general, functional alignment methods learn a trans-formation matrix R 2 Rp⇥p that best maps functional
signals from a source subject to those of a target subject. To do so, R can be seen as a linear mixing of source vox-els signals such that RAsourcebest matches Atarget. R is
then applied on separate, held-out data from the source subject, Dsource to estimate Dtarget. Because we only
learn an estimate of that held-out decoding task data, we denote this as ˆDtarget. Thus, ˆDtarget= RDsource.
We consider one method, intra-subject alignment, which uses the same alignment and decoding task data to learn a di↵erent transformation than the one described above. Specifically, in intra-subject alignment we are in-terested in learning Rintra
2 Rn⇥s , the “intra-subject”
correlations between Asource and Dsource. We can then
use Rintra to output ˆDtarget = RintraAtarget. Thus,
the main distinction here is that intra-subject alignment does not learn a source-target mapping; instead, it learns a A to D mapping within-subjects. These notations are illustrated in Figure1.
2.2.2. Procrustes
Generalized Procrustes analysis, known in the cogni-tive neuroscience literature as as hyperalignment (Haxby et al. 2011), searches for an orthogonal local transfor-mation R to align subject-level activation patterns such that: min R=sM||RA source Atarget ||2 F, s2 R+, M2 Rp⇥p (1)
where p is the number of voxels in a given region, such that
M|M = Ip (2)
This transform can be seen as a rotation matrix mix-ing signals of voxels in Asource to reconstruct the signal
of voxels in Atarget as much as possible. As described
in the Section 2.1.2, we compare two whole-brain im-plementations of this method: piecewise Procrustes and searchlight Procrustes, that di↵er in the way local trans-formations are aggregated.
2.2.3. Optimal Transport
Optimal transport—first introduced as a functional alignment method in Bazeille et al. 2019—estimates a local transformation R that aligns subject-level ac-tivation patterns at a minimal overall cost. Specifi-cally, we can compute the cost of aligning two subject-level activation patterns as Tr(R· C), where C is the functional dissimilarity—or di↵erence in activation patterns—between source and target, as measured by a pairwise functional distance matrix. Thus, for voxel i in Asource and voxel j in Atarget:
Ci,j(Asource, Atarget) =||Asourcei A target
j || (3)
Importantly, the resulting matching is constrained to exhaustively map all source voxels to all target voxels, with every voxel having an equal weight. This implicitly yields an invertible and strongly constrained transform, preserving signal structure as much as possible. To allow for a more efficient estimation, we slightly relaxed this constraint with an additional entropic smoothing term. As introduced in Cuturi 2013, we can then find R, the regularized Optimal Transport plan by finding a mini-mum for Equation4 through the Sinkhorn algorithm.
min
R2R+p⇥p;
R1=1/p, 1R>=1/p
Tr(R· C) ✏H(R) (4)
where ✏ > 0, and the discrete entropy of the transfor-mation H(R) is defined as:
H(R)def.= X
i,j
Ri,j(log(Ri,j) 1) (5)
This method di↵ers from Procrustes analysis in that it yields a sparser mapping between source and target vox-els with high functional similarity, making it less sensitive to noisy voxels on both ends. The level of sparsity is con-trolled by ✏, a user-supplied hyper-parameter, which we set to 0.1 throughout our experiments. For our imple-mentation, we rely on the fmralign package. Optimal transport transformations are calculated in a piecewise fashion, followingBazeille et al. 2019.
2.2.4. Shared Response Model
The Shared Response Model (SRM), introduced in Chen et al. 2015, di↵ers from Procrustes analysis and Optimal Transport in that it provides a decomposition of all subjects’s activity at once, rather than being per-formed pairwise. Specifically, SRM estimates a common shared response S and a per-subject orthogonal basis Wi from subject-level alignment data Ai such that:
min W1,...,Wn,S X i ||Ai WiS||2F 8 i, S 2 Rk⇥n, Wi2 Rp⇥k (6) where n is the number of time points, p is the num-ber of voxels, and k is a hyper-parameter indexing the dimensionality, such that:
Wi|Wi= Ik (7)
In practice, SRM decomposes the signal of many sub-jects in a common basis, with the same orthogonality
constraint as Procrustes. This ability to jointly fit inter-subject data through orthogonal transforms makes it reminiscent of Procrustes, with a caveat: SRM is e↵ective if the number of components k is large enough to capture all distinct components in the signal. In this work, we set k to 50 components as in the original SRM benchmarks provided inChen et al. (2015).
We specifically use the FastSRM implementation pro-posed by Richard et al. 2019 and available in the BrainIAK library (RRID: SCR 01 4824), that approx-imates this calculation with an emphasis on improved computational performance. For full details on the com-putational advantages of FastSRM, we direct the reader to their work.
2.2.5. Intra-subject alignment
Another alternative to pairwise functional alignment has been proposed inTavor et al. 2016. In their paper, Tavor and colleagues show that while individual activ-ity patterns in each task may appear idiosyncratic, cor-respondences learnt across di↵erent tasks using a gen-eral linear model (e.g., to predict object recognition task from movie-watching data derived features) display less across-subject variability than individual activity maps. This provides an interesting twist on the typical func-tional alignment workflow: while most methods learn alignments within a single task and across subjects, we can instead learn within-subject correlations across tasks. The structure of learnt task-specific correlations should then hold in new, unseen subjects. We include here a method for learning these intra-subject correlations in a piecewise fashion, which we call intra-subject alignment. Figure 3 illustrates how we can learn the local-level correlation structure between two independent tasks Asource 2 Rp⇥n, Dsource 2 Rp⇥d within a single source
subject. We denote the mapping between these tasks as Rintra to distinguish it from mappings which are learnt
between pairs of subjects.
First, we divide alignment and decoding data into 1000 parcels using the highest-resolution Schaefer atlas (Schaefer et al. 2018). On a local parcel i, each voxel is considered a sample and we train Rintra
i 2 Rpi⇥dthrough
ridge regression: Rintrai = arg min
Ri
||Asource
i Ri Dsourcei ||2F+↵||Ri||2F (8)
The hyperparameter ↵ is chosen with nested cross-validation among five values scaled between 0.1 and 1000 logarithmically.
After repeating this procedure for all source subjects, we then use Rintra to estimate decoding data for target
subject as ˆDtarget= RintraAtarget. We observed that—
unlike other piecewise techniques (Section S4)—the de-coding accuracy strictly improved with the number of parcels in the atlas used so we used the highest resolu-tion atlas available. As with other funcresolu-tional alignment methods, we can evaluate the quality of our estimation using an inter-subject decoding framework.
FIG. 3. Intra-subject alignment. Using intra-subject alignment to learn piecewise correlations between a single subject’s alignment and decoding task data. As with other piecewise methods, this mapping is learnt separately for all parcels i . . . j of the chosen parcellation. For each parcel, we use cross-validated ridge regression to learn the mapping between the two task conditions—alignment data A and independent decoding task data D—for this source subject. For the ith parcel, we denote this mapping as the matrix Ri. We then aggregate these piecewise predictions into a single, whole-brain prediction ˆD. In training, this prediction can be directly compared to the ground-truth decoding data, D. When testing, we would have access to the target subject’s alignment data A but not their decoding task data, D.
2.3. Experimental procedure
For each dataset considered (as described in Sec-tion 2.5), we calculated the inter-subject decoding ac-curacy for standard, anatomical-only alignment and for each of the five considered functional alignment methods. To calculate inter-subject decoding accuracy, we took the trial- or condition-specific beta maps generated for each dataset (see Section 2.5 for full details on beta-map generation) and fit a linear Support Vector Machine (SVM). In order to ensure fair comparisons of decoding accuracy across experiments, we chose a classifier with no feature selection and default model regularization. Clas-sifiers were implemented in scikit-learn (Pedregosa et al. 2011), and decoding accuracy was assessed using a leave-one-subject-out cross-validation scheme. That is, the lin-ear SVM was trained to classify condition labels on all-but-one subject and the resulting trained classifier was used without retraining on the held-out subject, provid-ing an accuracy score for that cross-validation fold.
For each dataset, we first calculated the inter-subject decoding accuracy using standard anatomical alignment. This served as a baseline accuracy against which we could compare each functional alignment method. Using align-ment data, functional alignalign-ment transformations were then learnt for each pairwise method, where the left-out subject for that cross-validation fold was the target subject for functional alignment. Inter-subject decoding accuracy was then re-calculated after applying functional alignment transformations to the decoding beta maps. In the special case of SRM—which calculates an alignment from all provided subjects in a single decomposition—we withheld the left-out subject from the shared response estimation step to avoid data leakage and finally learned
its projection to the resulting shared response space, in which decoding was performed.
For each cross-validation fold, we report the inter-subject decoding accuracy of a given functional align-ment method after subtracting the baseline, anatomical-only accuracy for that same fold. An overview of the experimental procedures is provided in Figure4.
2.4. Main experiments
Experiment 1 uses the experimental procedure de-scribed previously to assess accuracy gains provided by alignment methods with respect to anatomical alignment when applied on whole-brain images. We benchmarked the five methods described in Section2.2: piecewise Pro-crustes, searchlight ProPro-crustes, piecewise Optimal Trans-port, SRM, and intra-subject alignment, with relevant hyperparameters selected as described previously. Re-sults of this benchmark (on five tasks from four datasets as described in Section2.5) are presented in Section3.1. For each method, we also assessed its computation time relative to piecewise Procrustes alignment. Piecewise Procrustes provides a reasonable computational baseline as it is the only considered alignment method that does not include a hyperparameter and therefore shows a sta-ble computation time across experiments.
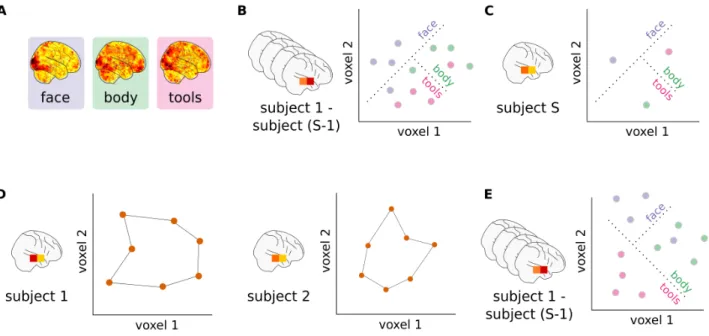
We estimate the noise ceiling for this task as within-subject decoding accuracy. Within-within-subject decoding was calculated separately for each subject as the average leave-one-session-out decoding accuracy. We can then directly compare this accuracy value to the inter-subject decoding accuracy when that subject is the target—that is, the left-out—subject. The di↵erence between within-and anatomical inter-subject decoding accuracies, then,
FIG. 4. Analysis pipeline. (A) First-level general linear models are fit for each subject to derive trial- or condition-specific beta-maps for each session. (B) These beta maps and their matching condition labels are used to train a linear SVM on the training set of subjects. (C) The trained classifier is applied on a held-out test subject, and accuracy is assessed by comparing the predicted and actual condition labels. (D) On a separate task, we compare subject-level activation patterns as trajectories in the high-dimensional voxel space. This allows us to learn functional alignment transformations that maximize the similarity of these high-dimensional spaces. (E) These voxel-wise transformations are applied on the decoding beta maps, and a new linear SVC is trained to predict condition labels. This trained classifier can then be applied to the held-out test subject and decoding accuracy assessed as in (C).
is a good approximation of the decoding accuracy lost to inter-subject variability; therefore, it provides a range of possible accuracy gains that can be expected from func-tional realignment.
We then conducted Experiment 2 to understand how whole-brain results compare to ROI-based analyses. Specifically, we replicated Experiment 1 within selected ROIs, where ROIs were chosen based on a priori expec-tations of each decoding task (see Section2.5for details for each dataset). Results from Experiment 2 are shown in Section3.2.
Experiment 3 tackles the notoriously hard problem of understanding how each of the considered methods align subjects by examining qualitatively their impact on ac-tivity patterns across individuals. To “open the black-box,” we reused IBC dataset full-brain alignments learnt in Experiment 1. Specifically, we consider the transfor-mation to 04’s activity pattern from all other sub-jects’s functional data. With these transformations, we align two contrasts from the IBC dataset: Rapid Serial Visual Presentation of words (RSVP language task) and sound listening. Finally, we run a group conjunction analysis (Heller et al. 2007) on these aligned contrasts and display its results. This statistical analysis, more sensitive than its random e↵ect equivalent on small sam-ples, allows one to infer that every subject activated in the region with a proportion showing the e↵ect
consid-ered. Here we use = 0.25 to recover all regions selec-tively activated by at least a few subjects, and we show in Section 3.3 how this group functional topography is modified by alignment.
2.4.1. Control analyses
In addition to our three main experiments, we ran three additional control analyses on the IBC dataset. First, we aimed to assess the impact of the brain parcella-tion and its resoluparcella-tion on piecewise alignment by compar-ing whole-brain decodcompar-ing accuracy for two IBC dataset tasks using piecewise Procrustes across both data-driven and pre-defined parcellations (Section S4). Second, we calculated inter-subject decoding performance after ap-plying Gaussian smoothing kernels of several widths on both IBC dataset decoding tasks (Section S5). Gaus-sian smoothing is of particular interest as a comparison to functional alignment, as it is commonly used to facil-itate inter-subject comparisons by smoothing over resid-ual variance in functional mappings. Finally, in a third control experiment, we assessed the impact of whether data is represented on the surface or the volume and res-olution on decoding accuracy in the IBC RSVP language task (SectionS6).
Dataset S Alignment data Decoding task data Categories d
Individual Brain Charting (IBC)
10 53 contrasts from HCP and ARCHI task batteries
RSVP Language
Words, Non-Words, Consonants, Simple / Complex sentences,
Jabberwocky 360 Sounds dataset
Voice, Nature, Animal, Music, Speech, Tools 72 BOLD5000 4 ImageNet content
Plant, Animal, Food,
Artifact Coco, Imagenet and Scenes images 350 Forrest 10
Forrest Gump audio-movie
listening Music genre
Country, Metal, Ambient, Symphonic, Rock 200 Courtois
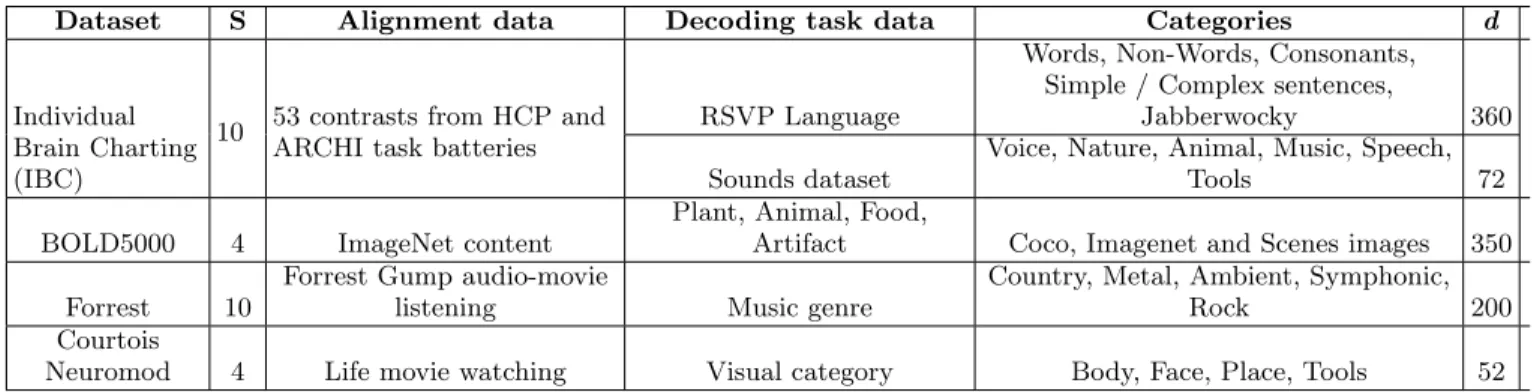
Neuromod 4 Life movie watching Visual category Body, Face, Place, Tools 52 TABLE I. Datasets used to benchmark alignment methods. The four datasets used in this benchmark, where each dataset consists of S subjects. We note the alignment data used for each dataset, showing the range of possible task structures which work for alignment—from static images for BOLD5000, to statistical contrast maps for IBC, to complex audio or audio-visual movies for Forrest and Courtois Neuromod. We also note the decoding task(s) used for each dataset. Of note, IBC dataset has two independent decoding tasks, bringing the total number of decoding tasks to five. Each subject’s decoding task data comprises d images evenly divided across the listed stimulus categories (except for BOLD5000 categories which are unbalanced).
2.5. Datasets and preprocessing
In order to assess the performance of each functional alignment method in a range of applications, we searched for publicly accessible datasets that included both a task suitable to learn the alignment (e.g. naturalistic or local-izer protocols) as well as an independent decoding task on which we could evaluate functional alignment perfor-mance. After discarding datasets where we could not obtain above-chance accuracy levels for within-subject decoding, we retained four datasets: BOLD5000 (Chang et al. 2019), Courtois-NeuroMod (Boyle et al. 2020), In-dividual Brain Charting (IBC; Pinho et al. 2018), and Study Forrest (Hanke et al. 2016). For the IBC dataset, we included both a language (RSVP language) and audi-tory (Sounds dataset) decoding task, yielding a total of five decoding tasks that probe visual, auditory and lan-guage systems. For a complete description of the align-ment and decoding data included in each experialign-ment, please see TableI.
BOLD5000, StudyForrest and Courtois-NeuroMod were preprocessed with fMRIPrep (Esteban et al. 2019), while IBC data were preprocessed using an SPM-based pipeline as described in Pinho et al. 2018. A com-plete description of the fMRIPrep preprocessing proce-dures is available in the appendix (SectionS1). Prepro-cessed data were then masked using a grey matter mask, detrended, and standardized using Nilearn (Abraham et al. 2014). To reduce the computational cost of func-tional alignment, we downsampled all included datasets to 3mm resolution. Decoding task data were addition-ally smoothed with a 5mm Gaussian kernel. A general linear model (GLM) was fit to each decoding task run to derive trial-specific beta maps (or condition-specific beta maps for the Courtois Neuromod and IBC Sounds tasks), which were carried forward for inter-subject decoding.
As described in Section 2.3, Experiment 2 uses pre-defined regions of interest (ROIs). We selected large,
task-relevant ROIs to ensure that sufficient signal was available when decoding. A large visual region, extracted from the Yeo7 (Buckner et al. 2011) atlas was used for the visual tasks in BOLD5000 and Courtois-NeuroMod. For Forrest and IBC Sounds—which are auditory tasks— we took the Neuroquery (Dock`es et al. 2020) predicted response to the term “auditory”. We then compared this predicted response with the BASC atlas (at scale 36; Bellec et al. 2010) and took the parcel most over-lapping with the predicted response; namely, parcel 25. For IBC RSVP, which is a reading task, we extracted the BASC (at scale 20) atlas components most overlap-ping with MSDL (Varoquaux et al. 2011) atlas parcels labeled as left superior temporal sulcus, Broca and left temporo-parietal junction: namely, the 8 and 18 BASC components. We then kept only the largest connected component. All included ROIs are displayed in Figure7.
2.6. Implementation
With the exception of Courtois Neuromod, all other included datasets are available on OpenNeuro (Poldrack et al. 2013) under the following identifiers: ds000113 (Study Forrest), ds001499 (BOLD5000), and ds002685 (IBC). Courtois Neuromod 2020-alpha2 release will be available under a data usage agreement as outlined on https://docs.cneuromod.ca.
Our pipeline entirely relies on open-source Python soft-ware, particularly the SciPy stack (Virtanen et al. 2020). All included methods are implemented in fmralign or accessed through their original, open source implementa-tions as described in Section2.2. To ease replication and extension of the presented results, we have created the fmralign-benchmark repository under https://github. com/neurodatascience/fmralign-benchmark. This repos-itory provides an implementation of the procedures adopted in these experiments, building on fmralign and previously cited tools.
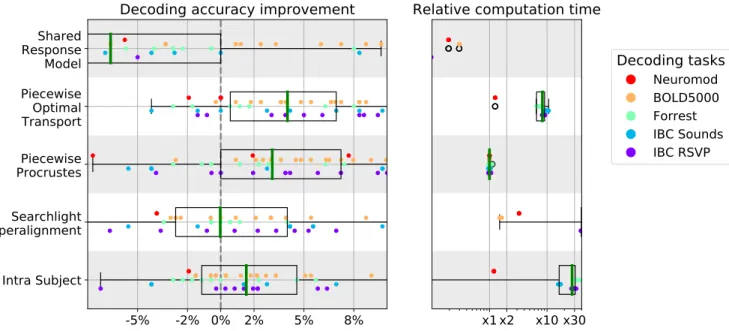
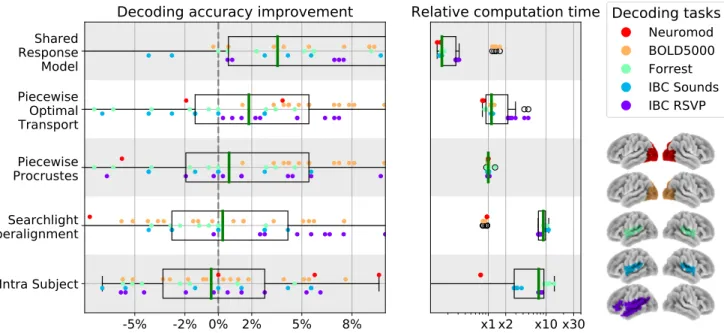
FIG. 5. Decoding accuracy improvement and computation time after whole-brain functional alignment. In the left panel, we show decoding accuracy improvement for each of the considered functional alignment methods at the whole-brain level of analysis. Each dot represents a single subject, and subjects are colored according to their decoding task. To aggregate results across datasets, we show accuracy scores after subtracting inter-subject decoding accuracy for the same leave-one-subject-out cross-validation fold with anatomical-only alignment. In the right panel, we show the computational time for each of the considered methods. All computation times are depicted as relative to piecewise Procrustes. For both panels, each box plot describes the distribution of values across datasets, where the green line indicates the median. We see that piecewise Procrustes, Optimal Transport, and intra-subject alignment consistently improve decoding accuracy across datasets. We also see that piecewise Optimal Transport is 10 times slower and searchlight Procrustes is more than 30 times slower than piecewise Procrustes.
3. Results
3.1. Functional alignment improves inter-subject decoding
The left panel of Figure5 displays absolute decoding accuracy change brought by each functional alignment method relative to anatomical alignment on whole-brain images. As every method is trained and tested on same cross-validation folds, we report the fold-by-fold perfor-mance change. The right panel displays each method’s relative computation time compared to piecewise Pro-crustes alignment. For each panel, each point displayed is the result for one leave-one-subject-out cross validation fold and each color corresponds to one of the five decod-ing tasks. Note that these timdecod-ings are based on avail-able implementations — fmralign for piecewise align-ment methods, pymvpa2 for searchlight, and BrainIAK for SRM— and are therefore subject to change as imple-mentations improve. Nonetheless, these estimates pro-vide insight into the current state-of-the-art.
3.1.1. Alignment substantially improves inter-subject decoding accuracy
Overall, we can conclude that most functional align-ment methods consistently improve decoding accuracy
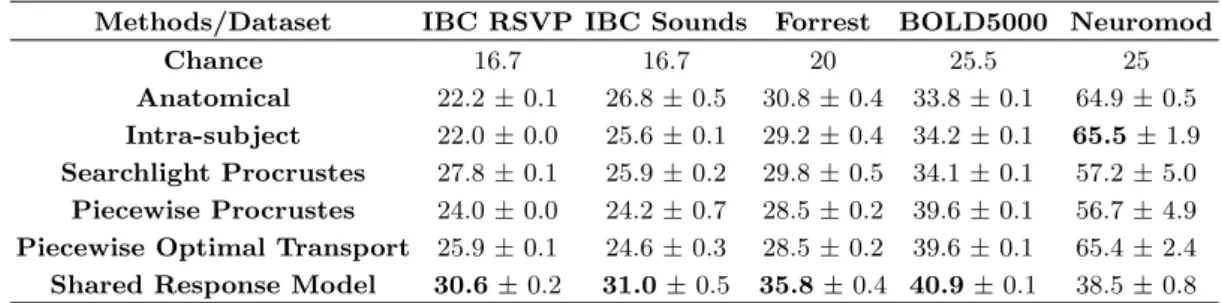
with gains from 2-5% over baseline. This trend is rel-atively consistent across datasets and target subjects. Thus, alignment methods manage to reliably reduce indi-vidual signal variability while preserving task-relevant in-formation in a variety of conditions. Although between-dataset variance yields large boxplot, these methods have significant e↵ect. Indeed, as reported in TableS1, base-line accuracy is around 20% above chance across datasets. In this setting, a 5% average improvement across datasets is a substantial increase.
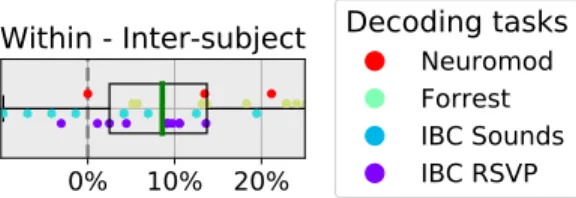
In order to further contextualize these results, we also estimated the noise ceiling for inter-subject decoding. Figure 6 reports that across datasets, the leave-one-session-out (i.e., within-subject) decoding accuracy for the target subject is on average 8.5% higher than the corresponding leave-one-subject-out (i.e., inter-subject) decoding accuracy after standard anatomical alignment for the same target subject. Thus, we expect that func-tional alignment methods will achieve at most an 8.5% increase in inter-subject decoding accuracy over stan-dard, anatomically-driven alignment. In this light, we can see that the best functional alignment method recov-ers roughly half of the decoding accuracy lost to inter-subject variability.
Additional control analyses suggest that this e↵ect can-not be explained by smoothing (SectionS5). We further find that the presented results are largely insensitive both
FIG. 6. Within-subject minus inter-subject decod-ing accuracy. We show the di↵erence between the average leave-one-session-out within-subject decoding accuracy and anatomically-aligned leave-one-subject-out inter-subject de-coding accuracy, when that target subject is left-out. Thus, each dot corresponds to a single subject, and the dot’s color indicates the decoding task. Of note, BOLD5000 was dropped since it didn’t contain inter-subject decoding cross-validation didn’t have independent folds therefore could not be used for within-subject cross-validation. The box plot describes the distribution of di↵erences, where the green line represents the median value. We that argue this di↵erence approximates the e↵ects of inter-individual variability, and so the best av-erage accuracy improvement we can hope for using functional alignment is around 9%.
to whether the data is represented on the cortical surface or in volumetric space as well as to the parcellation res-olution used (see sectionS6).
3.1.2. Piecewise methods show computational and accuracy advantages
Procrustes alignment results in better inter-subject de-coding accuracies when performed in a piecewise as com-pared to a searchlight approach. Specifically, searchlight shows very low decoding accuracies on average, suggest-ing that its internal averagsuggest-ing destroys part of the signal structure recovered by Procrustes. With respect to com-putational cost, we can see that searchlight Procrustes is 30 times slower on average than piecewise Procrustes. These results suggest that piecewise alignment is a better choice when calculating functional alignment transforma-tions on full-brain data. Moreover, SectionS4shows that gains to expect from piecewise alignment are quite insen-sitive to the resolution and type of parcellation used; i.e., taken from an atlas or learnt from subject data.
Another piecewise method, Optimal Transport, yields the highest decoding accuracy on average. Compared to other methods—especially Procrustes—we observe that Optimal Transport gives non-trivial gains in most con-figurations and only rarely decreases decoding accuracy, likely because of the stronger constraints that it imposes. However, this extra-performance comes at a computa-tional cost: it is on average 10 times slower than Pro-crustes.
3.1.3. Task-specific mappings can be learnt within subjects
The intra-subject alignment approach di↵ers from other considered functional alignment methods in that it
learns mappings between the alignment data and decod-ing task data, with the assumption that these mappdecod-ings can be generalized across subjects. Our results support this assumption, although this method yields gains half as large as the best performing alignment method and comes with a significant computational cost. Part of this cost can be accounted for by the increase in the num-ber of parcels which must be learnt to preserve signal specificity. Nonetheless, using task-specific mappings as a functional alignment method suggests that future work on refining related methods may be a promising direction of research.
3.2. Whole-brain alignment outperforms ROI-based alignment
The left panel of Figure 7displays the performance of each functional alignment method relative to anatomi-cal alignment within task-relevant ROIs. The right panel displays each method’s relative computation time com-pared to piecewise Procrustes alignment.
When visually compared to Figure 5, ROI-based de-coding accuracies appear to be slightly lower than whole-brain decoding accuracies for most of the considered methods. We directly compare ROI-based and whole-brain alignment in a supplementary analysis, depicted in FigureS1, confirming that ROI-based decoding accu-racies are in fact lower. Our results support previous work from the inter-subject decoding literature (Chang et al. 2015, Schrou↵ et al. 2018) and suggest that full-brain piecewise alignment yields the best overall decod-ing pipeline.
Computationally, we see that piecewise Optimal Trans-port shows faster performance when restricting the align-ment to an ROI, running nearly as quickly as piece-wise Procrustes. The slowest methods here are around 10 times slower than piecewise Procrustes and 50 times slower than SRM.
We also note that—on average—intra-subject align-ment does not show increased inter-subject decoding ac-curacy within task-relevant ROIs. We suspect that this is likely because the very low number of components pre-dicted do not enable it to find stable multivariate pat-terns in this context.
3.2.1. SRM shows higher performance in ROI-based decoding
Uniquely, the Shared Response Model (SRM) shows decreased whole-brain decoding accuracy compared to ROI-based decoding accuracy. Specifically, as visible in Figure7, SRM yields the best accuracy improvement at the ROI level of analysis at a low computational cost (five times quicker than piecewise Procrustes). In ROI-based setting, the baseline is around 10 % above chance in all datasets (except Neuromod). Hence SRM 3% accuracy increase is a strong e↵ect(see TableS2).
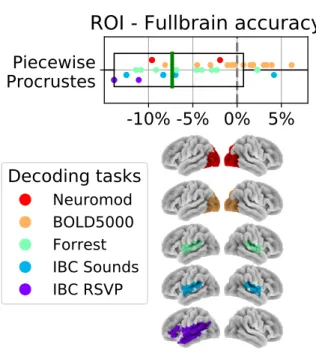
FIG. 7. Decoding accuracy improvement and computation time after ROI-based functional alignment. In the left panel, we show decoding accuracy for each of the considered functional alignment methods at the ROI level of analysis. The ROIs used for each dataset are displayed on the far right. Each dot represents a single subject, and subjects are colored according to their decoding task. Rather than raw values, we show accuracy scores after subtracting inter-subject decoding accuracy for the same leave-one-subject-out cross-validation fold with anatomical-only alignment. In the right panel, we show the computational time for each of the considered methods. All computation times are depicted as relative to piecewise Procrustes. For both panels, each box plot describes the distribution of values where the green line indicates the median.
it estimates the shared response using a limited number of components. Projection into a common space results in sharp data rank reduction and thus a loss of information compared to using original data. In an ROI, by contrast, we have a smaller number of voxels p compared to the number of training samples n. This increases the ratio of n/p which ensures both (1) more stable estimations thanks to increased number of samples (2) that we do not lose relevant information when projecting voxel signal to a lower number of components; i.e., the shared response (n/p must be above 1 to ensure full-rank decomposition).
3.3. Qualitative display of transformations learnt by various methods
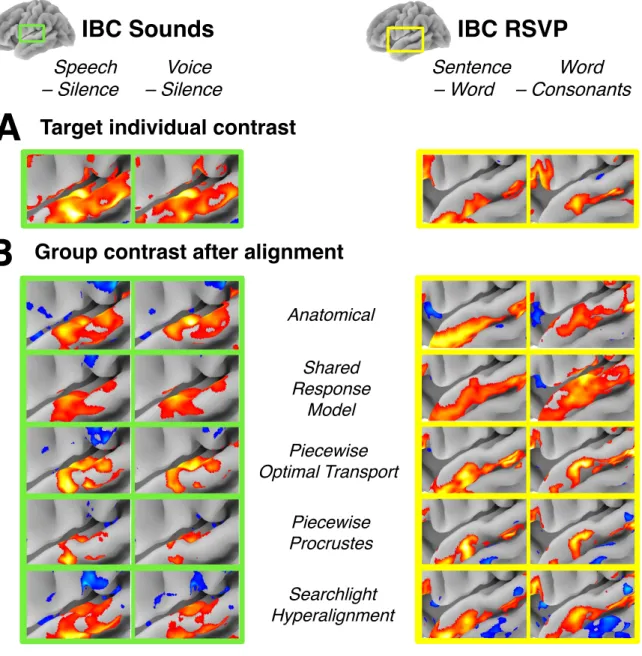
Understanding the e↵ects of high-dimensional transformations—such as those used in functional alignment—is non-trivial. To aid in this process, we “open the black box” by functionally aligning a group of subjects to an individual target subject’s functional space and depict the resulting maps in Figure 8. Here, we reuse whole-brain alignments learnt in Experiment 1. We also display the ground-truth individual activation maps in panel A, in order to better highlight how each method a↵ects the signal distribution. As a reminder, the contrast data displayed here was not used to learn alignments, so it means that alignment learnt on various task data, not specifically related to language nor audi-tion carried enough informaaudi-tion for fine-grain registraaudi-tion
of these networks.
We can see that overall, functional alignment methods enhance group-level contrasts compared to anatomical-only alignment; i.e., activation maps are more similar across functionally-aligned subjects. This result is not at the expense of signal specificity, since the aligned group topographies are still sharp. From the comparison be-tween panels A and B, we can also conclude that align-ment methods bring group topography much closer to the targeted subject topography across many contrasts. Nonetheless, we can still observe that there seems to be a trade-o↵ between sharpness of activation (low smooth-ness of image, due to low variance across aligned sub-jects) with Optimal Transport, and accuracy of their lo-cation compared to the target ones (low bias introduced by the matching) with searchlight Procrustes.
One exception to this is the Shared Response Model (SRM), that yields smoother group topography than the other alignment methods considered. This discrepancy can be explained by the fact all of the depicted alignments are learnt on full-brain data. For SRM, this truncates the whole-brain signal to its main components, and the visual smoothness impression is thus a correlate of its poor performance in full-brain decoding.
4. Discussion
In this work, we have proposed a new procedure to measure the information recovered through functional
IBC Sounds
Anatomical
Piecewise
Optimal Transport
Piecewise
Procrustes
Searchlight
Hyperalignment
Shared
Response
Model
A
Group contrast after alignment
Target individual contrast
IBC RSVP
Word
– Consonants
Sentence
– Word
Voice
– Silence
Speech
– Silence
B
FIG. 8. Comparison of alignment methods geometrical e↵ects. (A) Activation patterns for the Target subject (IBC sub-04) for two contrasts from the IBC Sounds task (Speech > Silence, Voice > Silence) and IBC RSVP task (Sentence > Word, Word > Consonants). Here, we only show contrast maps from a sub-region of the temporal-parietal region containing contrast-relevant information. Note that this sub-region di↵ers slightly between the Sounds and RSVP task. (B) Visualization of a group conjunction analysis of all IBC subjects after alignment to the target subject for each of the considered methods. We used a value of 0.25 in the group conjunction analysis, which corresponds to at least 25% of the IBC sample showing activation in this temporal-parietal region after alignment. For ease of comparison, the colorbar for each contrast and method was scaled to show the full range of values (i.e., the colorbar spans di↵erent interval across methods and contrasts) and so is not included here. All displayed maps were thresholded at 1/3 of their maximum value. We see that functional alignment yields stronger contrasts overall when compared to anatomical alignment. Piecewise Procrustes and piecewise Optimal Transport yield less smooth representations, better preserving signal specificity.
alignment using inter-subject decoding, and we have used this framework to benchmark five functional alignment methods on five distinct decoding tasks across four pub-licly available datasets.
In general, we find that functional alignment improves inter-subject decoding accuracy in both whole-brain and ROI settings. These results, combined with our
quali-tative visualization of the e↵ects of functional alignment on signal structure, suggest that functional alignment im-proves inter-subject correspondence while matching sig-nal to realistic functiosig-nal topographies. This extend con-clusions from earlier work (G¨u¸cl¨u and van Gerven 2015, Guntupalli et al. 2016). Specifically, the baseline inter-subject decoding accuracy is roughly 20% above chance
across datasets (TableS1). The best performing method in our benchmark, piecewise Optimal Transport bring a substantial 4% improvement over this baseline on aver-age, recovering roughly half of the accuracy lost to inter-subject variability.
Although we see improved decoding accuracy on aver-age, we also note that the functional alignment methods considered show di↵erent performance at the ROI and whole-brain scale. While piecewise Optimal Transport performs best when aggregating transformations across the whole-brain, SRM performs best to enhance decod-ing within regions of interest, brdecod-ingdecod-ing a 3% important improvement over a baseline only 10-15% above chance (Table S2). We therefore caution that the most appro-priate method may depend on the research question of interest. Nonetheless, we observe that increases in de-coding accuracy were reliably greater than the e↵ect of Gaussian smoothing (see section S5). From a minimal-istic replication, this e↵ect seem to hold for both vol-umetric and surface data, and at di↵erent parcellation resolutions (see sectionS6; cf. Oosterhof et al. 2011).
Our benchmark also brings new evidence that the la-tent correspondences that can be learnt between di↵er-ent tasks display less inter-individual variability than the task-specific activation maps (Tavor et al. 2016). Exper-iment 1 indeed showed that such correspondences could even be used to transfer signals subjects to solve an inter-subject decoding problem, which is—to the best of our knowledge—an original experimental result. By releasing efficient and accessible implementations of these methods in the fmralign package, we hope to facilitate future cog-nitive neuroscience research using functional alignment methods.
4.1. Combining local alignment models
Across datasets, we find that the spatial framework of alignment and decoding significantly a↵ects subsequent performance. Notably, piecewise Procrustes outperforms searchlight Procrustes, both in terms of accuracy and computational performance. The methodological di↵er-ence between these methods is whether alignment trans-formations are learnt within overlapping neighborhoods (as in searchlight Procrustes) or not (as in piecewise Pro-crustes). Searchlight alignment su↵ers in that the overlap between searchlights requires multiple computations for a given neighborhood, and the aggregated transforma-tion is no longer guaranteed to reflect properties of the original transforms, e.g. orthogonality. Although piece-wise alignment may introduce discontinuities at parcel boundaries, in our results this overall benefited decoding performance. Importantly, we found that the improved performance of piecewise Procrustes was largely insensi-tive to parcel size and definition (see FigureS2).
SRM performance was found to depend strongly on the spatial context, though at a larger scale than lo-cal neighborhood definition. Specifilo-cally, SRM performs best when restricted to an ROI. This can be explained
by the built-in dimensionality reduction that may discard relevant information when applied at a whole-brain level of analysis. We therefore suggest that an extension of SRM to piecewise alignment may be an important direc-tion for future research.
4.2. Evaluating alignment performance with decoding
We use inter-subject decoding to quantify the amount of mutual information recovered by functional align-ment methods. In general, identifying publicly available datasets with tasks appropriate for both inter-subject de-coding as well as functional alignment remains a chal-lenge. Beyond the four datasets included in these re-sults, we investigated several other publicly available datasets such as the Neuroimaging Analysis Replication and Prediction Study (NARPS; Botvinik-Nezer et al. 2020),the Healthy Brain Network Serial Scanning Ini-tiative (HBN-SSI; O’Connor et al. 2017), the interTVA dataset (Aglieri et al. 2019, available as Openneuro ds001771 ) and the The Dual Mechanisms of Cognitive Control Project (DMCC,Braver et al. 2020).
We had difficulties in achieving sufficient baseline ac-curacy levels in these and other datasets, and we there-fore chose not to include them in the present study. This suggests that the amount of signal discriminating complex experimental conditions is not strong enough to find inter-subject patterns robust to variability in many publicly available datasets, likely due to lim-ited sample sizes and inappropriate experimental de-signs. We hope that broader recognition of the ben-efits of using inter-subject decoding to uncover neural coding principles across subjects—using functional align-ment if necessary—will encourage investigators to collect and share more datasets supporting this type of anal-ysis. Greater data availability will encourage robust, principled comparisons of alignment methods and foster progress in the field.
4.3. Study limitations and future directions
Although our study provides a broad evaluation of the performance of several functional alignment methods, there are several dimensions which we hope future work will better address. Notably, we did not thoroughly in-vestigate how alignment performance is impacted by im-age resolution and whether data are represented on the surface or the volume. Using volumetric images down-sampled to a standard resolution of 3mm isotropic en-abled us to make fairer comparisons across datasets at a reasonable computational cost. We also show in Sec-tionS6that results from piecewise Procrustes alignment on the IBC dataset hold in a higher resolution, surface-based setting. Nonetheless, other functional alignment methods might show di↵erent patterns of performance in this setting or at di↵erent resolution levels. More-over, applying these methods on high-resolution images
is an exciting perspective to better understand how pre-cise brain function varies across subjects. To progress in this direction, a stronger focus on developing com-putationally efficient methods will be needed. The use of high-resolution parcellations—combined with more ef-ficient implementations of piecewise Optimal Transport or a piecewise Shared Response Model—seem to be par-ticularly promising directions.
We have also not examined the impact of alignment data on the learnt transformations and whether this im-pact varies across cortex. That is, we could further ask whether certain kinds of stimuli may produce more ac-curate functional alignments for specialized functional regions. In general, the surveyed functional alignment methods view each subject alignment image as a sam-ple, and the resulting transformation is trained to match corresponding samples across subjects. If some training images lack stable signal in a given ROI, functional align-ment methods are unlikely to learn meaningful transfor-mations in this region. In future work, we intend to address the above questions to learn more about when functional alignment methods are most appropriate.
5. Conclusion
In the present work, we have provided an extensive benchmark of five popular functional alignment methods across five unique experimental tasks from four publicly available datasets. Assessing each method in an inter-subject decoding framework, we show that Shared Re-sponse Modelling (SRM) performs best at a region-of-interest level of analysis, while Optimal Transport out-performs other methods at the whole-brain scale. Our results support previous work proposing functional align-ment to improve across-subject comparisons, while pro-viding nuance that some alignment methods may be most appropriate for a given research question. We further
suggest that identified improvements in inter-subject de-coding demonstrate the potential of functional alignment to identify generalizable neural coding principles across subjects.
Acknowledgments
This project has received funding from the European Union’s Horizon 2020 Framework Programme for Re-search and Innovation under the Specific Grant Agree-ment No. 945539 (Human Brain Project SGA3) and the Digiteo French program. This work was also par-tially funded by the National Institutes of Health (NIH) NIH-NIBIB P41 EB019936 (ReproNim) NIH-NIMH R01 MH083320 (CANDIShare) and NIH RF1 MH120021 (NIDM), the National Institute Of Mental Health un-der Award Number R01MH096906 (Neurosynth), as well as the Canada First Research Excellence Fund, awarded to McGill University for the Healthy Brains for Healthy Lives initiative and the Brain Canada Foundation with support from Health Canada.
We wish to thank all researchers that made this study possible by making their datasets publicly available, es-pecially J. Etzel, S. Takerkart, and P. Bellec for kindly taking the time to provide us preprocessed version of their datasets and thorough explanations of their ex-perimental designs. Data from the Courtois project on neural modelling was made possible by a generous do-nation from the Courtois foundation, administered by the Fondation Institut G´eriatrie Montr´eal at CIUSSS du Centre-Sud-de-l’ˆıle-de-Montr´eal and University of Mon-treal. The Courtois NeuroMod team is based at Centre de Recherce de l’Institut Universitaire de G´eriatrie de Montr´eal, with several other institutions involved. See the cneuromod documentation for an up-to-date list of contributors (https://docs.cneuromod.ca).
Abraham, A., Pedregosa, F., Eickenberg, M., Gervais, P., Mueller, A., Kossaifi, J., Gramfort, A., Thirion, B., and Varo-quaux, G. (2014). Machine learning for neuroimaging with scikit-learn. Front. Neuroinform., 8:14.
Aglieri, V., Cagna, B., Belin, P., and Takerkart, S. (2019). Intertva. a multimodal mri dataset for the study of inter-individual di↵erences in voice perception and identification.
https://openneuro.org/datasets/ds001771/versions/1.0.2. Bazeille, T., Richard, H., Janati, H., and Thirion, B. (2019). Local optimal transport for functional brain template estima-tion. In Information Processing in Medical Imaging, pages 237–248. Springer International Publishing.
Bellec, P., Rosa-Neto, P., Lyttelton, O. C., Benali, H., and Evans, A. C. (2010). Multi-level bootstrap analysis of stable clusters in resting-state fmri. NeuroImage, 51(3):1126 – 1139. Bilenko, N. Y. and Gallant, J. L. (2016). Pyrcca: Regular-ized kernel canonical correlation analysis in python and its
applications to neuroimaging. Front. Neuroinform., 10:49. Botvinik-Nezer, R., Holzmeister, F., Camerer, C. F., Dreber, A., Huber, J., Johannesson, M., Kirchler, M., Iwanir, R., Mumford, J. A., Adcock, R. A., et al. (2020). Variability in the analysis of a single neuroimaging dataset by many teams. Nature, pages 1–7.
Boyle, J. A., Pinsard, B., Boukhdhir, A., Belleville, S., Bram-batti, S., Chen, J., Cohen-Adad, J., Cyr, A., Fuente, A., Rainville, P., and Bellec, P. (2020). The Courtois project on neuronal modelling: 2020 data release. https://docs. cneuromod.ca. Presented at the 26th annual meeting of the Organization for Human Brain Mapping.
Braver, T. S., Kizhner, A., Tang, R., Freund, M. C., and Etzel, J. A. (2020). The dual mechanisms of cognitive control (dmcc) project. bioRxiv.
Buckner, R. L., Krienen, F. M., Castellanos, A., Diaz, J. C., and Yeo, B. T. T. (2011). The organization of the human
cere-bellum estimated by intrinsic functional connectivity. Journal of Neurophysiology, 106(5):2322–2345. PMID: 21795627. Chang, L. J., Gianaros, P. J., Manuck, S. B., Krishnan, A., and Wager, T. D. (2015). A sensitive and specific neural signature for Picture-Induced negative a↵ect. PLoS Biol., 13(6):e1002180.
Chang, N., Pyles, J. A., Marcus, A., Gupta, A., Tarr, M. J., and Amino↵, E. M. (2019). BOLD5000, a public fMRI dataset while viewing 5000 visual images. Sci Data, 6(1):49.
Chen, P.-H., Chen, J., Yeshurun, Y., Hasson, U., Haxby, J., and Ramadge, P. J. (2015). A Reduced-Dimension fMRI shared response model. In Cortes, C., Lawrence, N. D., Lee, D. D., Sugiyama, M., and Garnett, R., editors, Advances in Neural Information Processing Systems 28, pages 460–468. Curran Associates, Inc.
Churchland, P. M. (1998). Conceptual similarity across sen-sory and neural diversity: the Fodor/Lepore challenge an-swered. J. Philos., 95(1):5–32.
Cuturi, M. (2013). Sinkhorn distances: Lightspeed compu-tation of optimal transport. In Burges, C. J. C., Bottou, L., Welling, M., Ghahramani, Z., and Weinberger, K. Q., editors, Advances in Neural Information Processing Systems 26, pages 2292–2300. Curran Associates, Inc.
Dock`es, J., Poldrack, R. A., Primet, R., G¨oz¨ukan, H., Yarkoni, T., Suchanek, F., Thirion, B., and Varoquaux, G. (2020). Neuroquery, comprehensive meta-analysis of human brain mapping. eLife, 9:e53385.
Esteban, O., Markiewicz, C. J., Blair, R. W., Moodie, C. A., Isik, A. I., Erramuzpe, A., Kent, J. D., Goncalves, M., DuPre, E., Snyder, M., Oya, H., Ghosh, S. S., Wright, J., Durnez, J., Poldrack, R. A., and Gorgolewski, K. J. (2019). fMRIPrep: a robust preprocessing pipeline for functional MRI. Nat. Meth-ods, 16(1):111–116.
G¨u¸cl¨u, U. and van Gerven, M. A. (2015). Deep neural net-works reveal a gradient in the complexity of neural represen-tations across the ventral stream. Journal of Neuroscience, 35(27):10005–10014.
Guntupalli, J. S., Feilong, M., and Haxby, J. V. (2018). A computational model of shared fine-scale structure in the hu-man connectome. PLoS Comput. Biol., 14(4):e1006120. Guntupalli, J. S., Hanke, M., Halchenko, Y. O., Connolly, A. C., Ramadge, P. J., and Haxby, J. V. (2016). A model of representational spaces in human cortex. Cereb. Cortex, 26(6):2919–2934.
Hanke, M., Adelh¨ofer, N., Kottke, D., Iacovella, V., Sengupta, A., Kaule, F. R., Nigbur, R., Waite, A. Q., Baumgartner, F., and Stadler, J. (2016). A studyforrest extension, simultane-ous fMRI and eye gaze recordings during prolonged natural stimulation. Sci Data, 3:160092.
Hanke, M., Halchenko, Y. O., Sederberg, P. B., Hanson, S. J., Haxby, J. V., and Pollmann, S. (2009). PyMVPA: A python toolbox for multivariate pattern analysis of fMRI data. Neu-roinformatics, 7(1):37–53.
Haxby, J. V., Guntupalli, J. S., Connolly, A. C., Halchenko, Y. O., Conroy, B. R., Gobbini, M. I., Hanke, M., and Ra-madge, P. J. (2011). A common, high-dimensional model of
the representational space in human ventral temporal cortex. Neuron, 72(2):404–416.
Haxby, J. V., Guntupalli, J. S., Nastase, S. A., and Feilong, M. (2020). Hyperalignment: Modeling shared information en-coded in idiosyncratic cortical topographies. Elife, 9:e56601. Heller, R., Golland, Y., Malach, R., and Benjamini, Y. (2007). Conjunction group analysis: An alternative to mixed/random e↵ect analysis. NeuroImage, 37:1178–85.
Jiahui, G., Feilong, M., Visconti di Oleggio Castello, M., Gun-tupalli, J. S., Chauhan, V., Haxby, J. V., and Gobbini, M. I. (2020). Predicting individual face-selective topography using naturalistic stimuli. Neuroimage, 216:116458.
Kriegeskorte, N. and Diedrichsen, J. (2019). Peeling the onion of brain representations. Annu. Rev. Neurosci., 42(1):407– 432.
Kriegeskorte, N., Goebel, R., and Bandettini, P. (2006). Information-based functional brain mapping. Proc. Natl. Acad. Sci. U. S. A., 103(10):3863–3868.
Langs, G., Golland, P., Tie, Y., Rigolo, L., and Golby, A. J. (2010). Functional geometry alignment and localization of brain areas. Adv. Neural Inf. Process. Syst., 1:1225–1233. Langs, G., Sweet, A., Lashkari, D., Tie, Y., Rigolo, L., Golby, A. J., and Golland, P. (2014). Decoupling function and anatomy in atlases of functional connectivity patterns: lan-guage mapping in tumor patients. Neuroimage, 103:462–475. Nastase, S. A., Gazzola, V., Hasson, U., and Keysers, C. (2019). Measuring shared responses across subjects using in-tersubject correlation.
Olivetti, E., Veeramachaneni, S., and Avesani, P. (2011). Testing for information with brain decoding. In 2011 Inter-national Workshop on Pattern Recognition in NeuroImaging, pages 33–36.
Oosterhof, N. N., Wiestler, T., Downing, P. E., and Diedrich-sen, J. (2011). A comparison of volume-based and surface-based multi-voxel pattern analysis. Neuroimage, 56(2):593– 600.
O’Connor, D., Potler, N. V., Kovacs, M., Xu, T., Ai, L., Pell-man, J., Vanderwal, T., Parra, L. C., Cohen, S., Ghosh, S., et al. (2017). The healthy brain network serial scanning ini-tiative: a resource for evaluating inter-individual di↵erences and their reliabilities across scan conditions and sessions. Gi-gascience, 6(2):giw011.
Paquola, C., De Wael, R. V., Wagstyl, K., Bethlehem, R. A., Hong, S.-J., Seidlitz, J., Bullmore, E. T., Evans, A. C., Misic, B., Margulies, D. S., et al. (2019). Microstructural and func-tional gradients are increasingly dissociated in transmodal cortices. PLOS Biology, 17(5):e3000284.
Pedregosa, F., Varoquaux, G., Gramfort, A., Michel, V., Thirion, B., Grisel, O., Blondel, M., Prettenhofer, P., Weiss, R., Dubourg, V., Vanderplas, J., Passos, A., Cournapeau, D., Brucher, M., Perrot, M., and Duchesnay, E. (2011). Scikit-learn: Machine learning in Python. Journal of Machine Learning Research, 12:2825–2830.
Pinho, A. L., Amadon, A., Ruest, T., Fabre, M., Dohmatob, E., Denghien, I., Ginisty, C., Becuwe-Desmidt, S., Roger, S., Laurier, L., Joly-Testault, V., M´ediouni-Cloarec, G., Doubl´e,
C., Martins, B., Pinel, P., Eger, E., Varoquaux, G., Pallier, C., Dehaene, S., Hertz-Pannier, L., and Thirion, B. (2018). Individual brain charting, a high-resolution fMRI dataset for cognitive mapping. Sci Data, 5:180105.
Poldrack, R. A., Barch, D. M., Mitchell, J., Wager, T., Wag-ner, A. D., Devlin, J. T., Cumba, C., Koyejo, O., and Milham, M. (2013). Toward open sharing of task-based fmri data: the openfmri project. Frontiers in neuroinformatics, 7:12. Rademacher, J., Caviness, Jr, V. S., Steinmetz, H., and Gal-aburda, A. M. (1993). Topographical variation of the human primary cortices: implications for neuroimaging, brain map-ping, and neurobiology. Cereb. Cortex, 3(4):313–329. Richard, H., Martin, L., Pinho, A. L., Pillow, J., and Thirion, B. (2019). Fast shared response model for fmri data. arXiv preprint arXiv:1909.12537.
Rodriguez-Vazquez, B., Suarez, L. E., Shafiei, G., Markello, R., Paquola, C., Hagmann, P., Van Den Heuvel, M., Bern-hardt, B., Spreng, R. N., and Misic, B. (2019). Gradients of structure-function tethering across neocortex. BioRxiv, page 561985.
Sabuncu, M., Bryan, E., Ramadge, P. J., and Haxby, J. V. (2010). Function-based intersubject alignment of human cor-tical anatomy. Cerebral Cortex, 20:130–140.
Schaefer, A., Kong, R., Gordon, E. M., Laumann, T. O., Zuo, X.-N., Holmes, A. J., Eickho↵, S. B., and Yeo, B. T. T. (2018). Local-Global parcellation of the human cerebral cor-tex from intrinsic functional connectivity MRI. Cereb. Corcor-tex, 28(9):3095–3114.
Schrou↵, J., Monteiro, J. M., Portugal, L., Rosa, M. J., Phillips, C., and Mourao-Miranda, J. (2018). Embedding Anatomical or Functional Knowledge in Whole-Brain Mul-tiple Kernel Learning Models. Neuroinformatics, 16(1):117– 143.
Tavor, I., Parker Jones, O., Mars, R. B., Smith, S. M., Behrens, T. E., and Jbabdi, S. (2016). Task-free MRI pre-dicts individual di↵erences in brain activity during task per-formance. Science, 352(6282):216–220.
Thirion, B., Flandin, G., Pinel, P., Roche, A., Ciuciu, P., and Poline, J.-B. (2006). Dealing with the shortcomings of spatial normalization: multi-subject parcellation of fMRI datasets. Hum. Brain Mapp., 27(8):678–693.
Varoquaux, G., Gramfort, A., Pedregosa, F., Michel, V., and Thirion, B. (2011). Multi-subject dictionary learning to seg-ment an atlas of brain spontaneous activity. In Information Processing in Medical Imaging, volume 6801 of Lecture Notes in Computer Science, pages 562–573, Kaufbeuren, Germany. G´abor Sz´ekely, Horst Hahn, Springer.
Virtanen, P., Gommers, R., Oliphant, T. E., Haberland, M., Reddy, T., Cournapeau, D., Burovski, E., Peterson, P., Weckesser, W., Bright, J., et al. (2020). Scipy 1.0: funda-mental algorithms for scientific computing in python. Nature methods, 17(3):261–272.
Xu, T., Yousefnezhad, M., and Zhang, D. (2018). Gradient hyperalignment for multi-subject fmri data alignment. In Pa-cific Rim International Conference on Artificial Intelligence, pages 1058–1068. Springer.
Yousefnezhad, M. and Zhang, D. (2017). Deep hyperalign-ment. In Guyon, I., Luxburg, U. V., Bengio, S., Wallach, H., Fergus, R., Vishwanathan, S., and Garnett, R., editors, Ad-vances in Neural Information Processing Systems 30, pages 1604–1612. Curran Associates, Inc.