PFC/RR-84-11 DOE/ET/51013-127 UC-20 a,f
Design and Performance of Compact Submillimeter Beam Dumps
K. Kato and I. H. Hutchinson
Plasma Fusion Center
Massachusetts Institute of Technology Cambridge, MA 02139
July 1984
This work was supported by the U.S. Department of Energy Contract No. DE-AC02-78ET51013. Reproduction, translation, publication, use and disposal, in whole or in part by or for the United States govern-ment is permitted.
Design and Performance of Compact
Submillimeter Beam Dumps
K. Kato and I. H. Hutchinson
Plasma Fusion Center and Department of Nuclear Engineering. Massachusetts Institute of Technology
Cambridge. MA 02139, U.S.A.
Abstract
Several different beam dumps using parallel groove structures were made for use in absorbing electron cyclotron radiation emitted from fusion plasmas. The materials used were Pyrex. Macor, alumina, and graphite. Broadband absorption measurements indicate more than 99 % power absorption for dumps made of Pyrex and Macor, while absorption by alumina and graphite dumps are noticeably less. Waves polarized with E parallel to the grooves undergo higher absorption compared to those polarized with E perpendicular to the grooves. Three different mechanisms are identified as the source of reflected power. They are: (1)front surface reflection; (2)back surface reflection; and (3)diffraction grating effect. All the dumps exhibit greater reflection at lower frequen-cies.
This work was supported by DOE contract DE-AC02-78ET51013.
1. Introduction
Vacuum compatible viewing dumps that absorb electromagnetic radiation in the Far Infra Red and Millimeter wave range are required in plasma experiments for purposes such as electron density profile measurements using electron cyclotron emission, or ion temperature measurements using FIR Thomson scattering. Without viewing dumps, these diagnostics are hampered by scattering of the waves off the metallic walls which have high reflectivity. In this paper. we describe the design and measurement of microwave beam dumps constructed for the Alcator C tokamak at MIT. The design of the dump is motivated by the vertical ECE measurement project which attempts to measure electron velocity distribution in the plasma during RF current drive'll> and requires the proportion of multiply reflected power to be reduced to considerably below 10 of the beam.
2. Design Goals and Constraints
The design goal for the beam dumps is that they absorb more than 99% of the incident radiation in the frequency range 150GHz to 1000GHz. These frequencies correspond to the range of electron cyclotron emission in Alcator C, operating at approximately 10 Tesla magnetic field.
The dumps must occupy the limited space between the Alcator C torus wall and the plasma edge defined by the limiter. This limits the dump structure to be less than 2 cm by 10 cm by 10 cm. This limit includes support and protective structures so that the height of the actual wave absorbing material may be considerably less. This has consequences for the absorption process since it depends on the path length the wave traverses within the absorbing medium. In addition, the dump assembly must also clear the access holes used to bring it into the torus. The latter restriction, however, may be alleviated to some
extent if the dumps are made modular and assembled inside, or brought in through some other opening which may be distant but larger.
Since the dump will be placed inside the torus. it must withstand high vacuum, and high heat and particle flux. The dump must have acceptably low outgassing in the vacuum of Alcator C, which is approximately 1 x 10O Torr. Its vacuum properties should not alter
drastically at high temperatures, since temperatures as high as several hundred degrees Celsius may be attained locally due to high energy particle flux finding its way to the dump surface. In summary, the dump must not outgas, and it must withstand high temperatures and heat fluxes.
3. Design Calculations
We start with simple assumptions in determining the shape and the size of the dump. We assume: (1)a very large absorption coefficient although still with the real part of the refractive index much greater than the imaginary part: and (2)the validity of geometrical optics. The first assumption allows us to consider that fraction of the ray which is trans-mitted into the material as being completely absorbed. The second assumption allows us to execute simple ray-tracing to plot the ray trajectory. The ray's angle of incidence thus obtained allows us to calculate the transmitted and the reflected electric field compo-nents for a given wave polarization and the refractive index of the material. The following standard equations'2' for reflection from a refractive medium interface are used for these calculations. E, ( )2 cos 0 - [(S)2-sin2 E
(A
)2cos0 -4[(V )2 - sin2 01 cos -(
)2 - sin2E
cosO + (N1)2 - sin2 0(2)E(
N)
*+)E
(3)
Ei
N2Ei
3E)(Er)
(4)
Et
( - =I
-(Ei
) 4where we have assumed the refractive index to be purely real. The symbols and geometries
used in the above equations are defined in Figure 1. We square the quantities obtained
in equations (1) through (4) to obtain the transmitted and reflected powers. In general,
parallel polarization gives less reflection throughout most of the range of angles of incidence.
The above two assumptions are at best crude. The assumption of large
absorptiv-ity breaks down when the thickness of the dump is small compared to the reciprocal of
the absorption coefficient. A fraction of the transmitted ray may reemerge, contributing
to the reflected power. The second assumption of geometrical optics breaks down when
dimensions of the beam dump surface structure become equal in order of magnitude to
the wavelength. Therefore, if the typical scale of the dump is on the order of
centime-ters, the geometrical optics breakdown will affect the lower end of the frequency range of
interest(A z 2 mm).
Having defined the procedure to calculate the dump performance. the next task is to
shape the dump material such that sufficient absorption can be attained through multiple
reflection. Several geometries can accomplish multiple reflection. simplest of which is a
straight groove. An array of straight grooves are fairly easy to machine or grind, but the
reflectivity will be polarization dependent. Another possibility is a curved horn, sometimes
referred to as the Rayleigh horn. This geometry has better properties in terms of inducing
more reflections for a given space and aperture, but construction of curved surfaces present
numerous difficulties. The last alternative that we mention here, although there are many
more possible configurations, is a two dimensional array of cone structure. This geometry
provides polarization independent reflection. It is difficult to machine out of one piece, and
if individual cones are used, finding a way to hold them together without compromising
the vacuum property is a formidable task.
We have adopted the straight groove structure due to its simplicity in fabrication and
ray-tracing. The angle and the size of the grooves must now be determined. In general, the
relationship between N. the number of front surface reflections before the ray reemerges from the groove, and 0. the groove angle is,
N= 180
eg(degrees)
for a ray normally incident on the dump. A fractional N indicates that the ray eventually emerges non-normal to the dump. This relation is illustrated in the semicircle representa-tion of the grooves in Figure 2. In Figure 2. the grooves are packed next to one another like pie pieces. with the walls touching each other so as to form a semicircle. In this ficti-cious space, a straight line will represent a multiply reflected ray entering and exiting the groove. Thus. the number of reflections is equal to the number of times the ray intersects the groove wall lines. For normal incidence. the number of intersections corresponds to the number of grooves that can be fit within the 180 degree semicircle, hence the above equation.
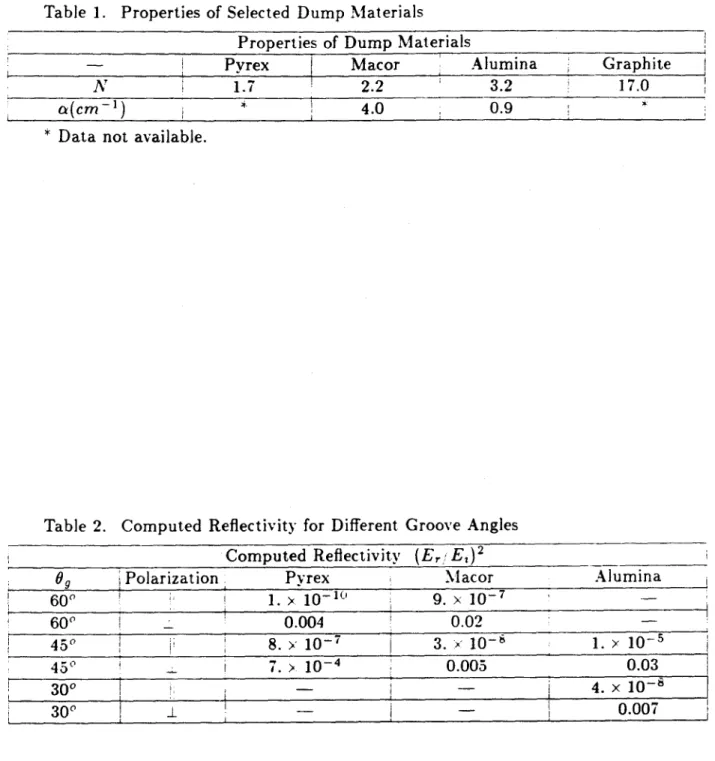
We selected four candidate materials which have both good vacuum properties and good absorption properties'3'. They are Macor4-. Pyrex. alumina. and graphite. Macor and alumina have been placed in Alcator vacuum in the past. They both have low reflec-tivity and high attenuation coefficient, with Macor being the superior of the two. Pyrex has been used for vacuum windows and we believe it can be used for the present purpose. It has the lowest reflection property amongst the four candidates. Graphite has good thermal properties and is quite compatible with Alcator vacuum. but has high reflectivity. However. its attenuation is very good. Table 1[5, shows refractive indicies for the four ma-terials and absorption coefficients for Macor and alumina. These values are approximate values over the frequency range of interest. All four materials have maximum operating temperatures above 1000'C. Graphite is excluded from further design analysis because of unacceptably high reflectivity, as implied by its large refractive index. However, some graphite dumps already in existence were tested.
Table 2 shows the computed reflectivity of Pyrex. Macor, and alumina for normally incident rays and for various groove angles. The numbers indicate that for Pyrex, the design goal can be achieved with a groove angle of 60 degrees which gives three reflections
while for Macor. an angle of 45 degrees. or four reflections. is needed. The requirement becomes more critical for alumina, which requires an angle of 30 degrees. In all cases, it is seen that parallel polarized waves have much lower front surface reflectivity.
We decided to use 45 degree angles for all three materials. While this angle is sufficient for Macor and Pyrex based on our calculations. it does not make the alumina dump meet our goals. However, heat flux and strength considerations along with economies of scale led us to build alumina dump also with 45 degree angles. To determine the aperture and the depth of the groove, we consider the validity of geometrical optics and spatial limitations. From the geometrical optics point of view, it is clear that larger dimensions help in supporting the validity of ray-tracing. However, the spatial constraints limit us to dimensions comparable to wavelengths at the low frequency end. We arrived at a groove spacing of 5mm and a depth of approximately 6mm after some optimization. The sketch of the dump is shown in Figure 3(a), with dimensions. While it was possible to make this shape out of one piece of Macor by machining it, Pyrex and alumina had to be ground. and required that there be no inside corners. Hence the dump was made of small pieces each with one groove structure as shown in Figure 3(b). They can then be placed next to one another to form the entire dump.
In addition to the three dumps of identical design. two graphite dumps. made by Woskoboinikow. et.al.31 for similar purposes were used for measurements. These are shown in Figure 4. The first has the straight groove structure, but with the aperture
approximately 2 mm and the groove angle approximately 15 degrees. The second has a conic structure which should be polarization independent.
4. Performance Tests
The measurement configuration is shown in Figure 5. A mercury arc lamp with a chopper is used as the broad band source, and the reflected signal is detected by the InSb detector connected to a lock-in amplifier. The spectral response of the mercury arc lamp-InSb detector system which extends from 100GHz to 1100GHz is ideally matched
to our frequency range of interest. The copper waveguide attached to the detector was used to place the detector behind the lamp. This was done so that the angle at the dump subtended by the lamp and the detector can be made as small as possible. The angular off set of the dump is approximately 10 degrees. This configuration makes normal incident measurement impossible. For polarization measurements, fine wire grid polarizers were placed in front of the source, and for qualitative measurements on the frequency dependence, a small aperture low pass filter(440GHz cut-off) was placed in front of the waveguide. The dump was held in place by an aluminum frame covered with microwave absorbers. The angular spread of the reflected radiation can be obtained by scanning the detector in a circular path about the beam dump.
In all. there are four different sources of the measured wave. They are; unpolarized. perpendicularly polarized. parallel polarized. and low frequency. In addition, since the detector can only be scanned in the plane of the table, measurements were taken for the two orientations of the groove; vertical and horizontal(Figure 5 shows the grooves to be vertical).
5. Results
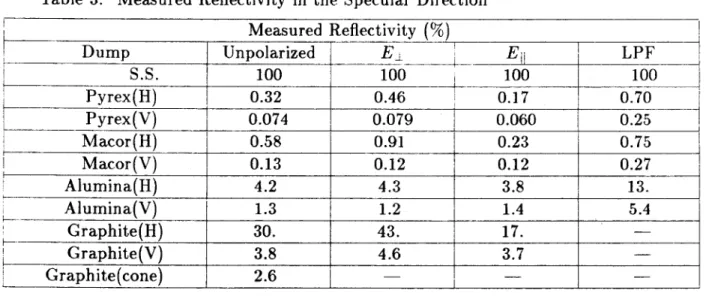
Table 3 shows the results of specular reflection measurement for the four modes and the five dumps. The dumps with straight grooves are oriented in two principal directions., horizontally and vertically, as mentioned previously. The symbols H and V in parentheses after the dump name in the first column of the table indicate the orientation. All mea-surements are normalized to the specularly reflected power off a stainless steel slab placed in the holder instead of the dump. Measured values indicate higher absorption for the parallel polarization, and for higher frequencies. The latter is implied by the fact that with the low pass filter on, reflectivities increase considerably. Pyrex is found to have the least reflection. with Macor, alumina and graphite following in that order. These measured values of reflectivity are higher than the calculated values. In the case of perpendicular polarization, they are high by factors of several, and in the case of parallel polarization, by
orders of magnitude. This shows that one or both of the assumptions made are not valid.
Another important point to note is that the specular reflectivity value for a given dump
differs depending on whether the straight grooves are oriented vertically or horizontally.
Horizontal groove orientation results in higher reflection for all dumps.
We will refer to the spectra obtained with the grooves horizontal as the Oh-scan, while
the spectra with grooves oriented vertical is referred to as the 0,-scan. Thus, Oh-scan is
the case where the specular reflectivity is relatively high.
Figure 6 shows the reflection spectra as a function of the detector position in terms of
the angle from the specular direction. These measurements were taken without polarizers
or the low pass filter. The values are plotted for all dumps including the stainless steel
reference slab, and for the two orientations of the grooves. The accuracy of the
measure-ment decreases with decreasing reflection. At an intensity of 0.003(A.U.). the accuracy
is
approximately 20%. The O,,-scan shows a relatively low peak and a wide tail, extending
to approximately 40 degrees from specular. The
Oh-scanshows a relatively high peak with
narrow width. extending up to approximately 15 degrees. The shape of the spectra for a
given scan are quite similar, especially among the three dumps of identical design.
Measurements with polarizers produce similar spectra. shifted up or down by the
relative value of reflection at the specular angle. It was not possible to obtain spectra
with the low pass filter, since its small aperture decreased the S/N by over an order of
magnitude.
Clearly. the difference in the magnitude and the shape of the spectra for the two
orientations of the groove indicate anisotropic distribution of the reflected power. The
task then is to identify mechanisms responsible for the anisotropy, and try to construct a
self consistent power distribution over all space such that total reflection can be calculated
for each dump.
Summarizing our situation, we have, for the 0,-scan a wide tail and a low peak(curve
A, Figure
7),
and for the Oh-scan, a high peak with narrow width (curve B, Figure
7).
Note
that Figure 7 is drawn such that the angle of incidence is zero. This approximation should
be fairly valid for large
Ohand 0,. We shall attempt to resolve the reflectivity discrepancy
We discuss three possible mechanisms by which the power incident on the dump may be reflected back. These are; (i) front surface reflection, (ii) back surface reflection, and (iii) diffraction grating effect. We will show how each of these mechanisms contribute to a particular segment of the spectra.
(i) Front Surface Reflection
Usefulness of the semicircle representation of the groove was discussed earlier in demonstrating the relationship between the groove angle and the number of reflections. Then, the rays were shown to be incident from the normal direction. Figure 8 shows the same semicircle representation with the 45 degree groove angle, but with ray A incident at a 10 degree angle. This configuration simulates the case of the 0,-scan. The figure, along with the physical space picture shown next to it shows that this ray will exit the dump and propagate back to its origin. i.e., to the lamp, after making four reflections. Thus, what this picture demonstrates is that in the case of the 0,-scan. the front surface reflected rays escape detection by the detector because they all reflect back to the lamp. This is a probable cause of the relatively low specular peak in the 0,-scan. This "retrospecular" reflection is irrelevant in the case of the Oh-scan since the rays enter the plane of the groove at the normal angle. Lastly, it should be noted that retrospecular reflection occurs only for certain combinations of the groove angle and the ray incidence angle. Figure 8 shows that ray B incident at 45 degrees on a 45 degree dump will exit the groove in the specular direction after two reflections.
(ii) Back Surface Reflection
Figure 9 shows the result of ray tracing within the Macor dump. Each successive ray was obtained by invoking Snell's law at the interface. It shows that the rays that enter the dump are reflected out in specular and quasi-retrospecular direction for the incident angle of 10 degrees. The aluminum support material which is in contact with the dump at its base does not affect the measurement very much if the angle of incidence of the rays on the back surface is larger than the critical angle of incidence which is approximately 27 degrees for Macor. Calculations show that ray A, which comes out in the specular direction, will
retain 0.3% of the initial power. These back surface reflected rays are probably responsible
for the low peaking of the spectrum in the specular position for the 0,-scan.
(iii) Diffraction Grating Effect
When the geometrical optics begins to break down at longer wavelengths, dump grooves begin to perform like diffraction gratings, which could cause reflection into an-gles other than the specular. The relationship between the angle of reflection and the wavelength for constructive interference is given by,
A = d- sin 10' sin(O + 10- ) (6)
where d is the spacing between the dumps, and the first and the second terms correspond
to distances marked "a" and "b" in Figure 10, respectively. For the Macor-like dump groove spacing of 5 mm, waves with frequencies in the range 100 GHz to 350GHz are scattered into 0,. = 10 ~ 50'. For the graphite dump groove spacing of 2 mm. 250GHz to 870GHz waves are scattered into the same range. This shows that primary diffraction is responsible for the wide shape of the 0,-scan spectra.
Thus. in summary. the discrepancy in the specular peak intensity between the 9,-scan and the Oh-scan is due to the retrospecular front surface reflection in the 0,-scan. The wide tail present in the 90-scan measurement is probably due to the diffraction grating effect and also to some extent, multiple-internally reflected rays which tend to diffuse out perpendicular to the groove direction.
To obtain the aggregate reflection spectra over the hemisphere facing the dump, we take a rather crude and simple approach of adding the retrospecular power component to the 0,-scan so as to make the peak value at normal reflection equal, as shown in Figure 11. Insofar as the angular distribution of reflected power can be approximated as a retrospec-ular peak plus other broader features this will provide a reasonable estimate, regardless of the exact cause of the broader scattering. This then enables us to estimate the reflected power everywhere on the hemisphere, and therefore calculate the total reflected power. By comparing this with the total reflected power from a stainless steel slab, the absorption by
the dump is obtained. Results are summarized in Table 4. It shows that the design goal of less than 1% reflection is achieved with the Pyrex dump regardless of source polarization. The goal is also achieved for parallel polarization with the Macor dump. but alumina and graphite dumps are noticeably worse off. It should be noted that for the graphite cone dump. the value of W-/ may be a gross underestimate, since in our present configuration there is no way of detecting the retrospecular component from this structure.
6. Conclusions
The design goal of less than 1% reflection is achieved for both polarizations with the Pyrex dump and for parallel polarization with the Macor dump. Generally speaking. less reflection is achieved for parallel polarization and for higher frequencies. Three reflection mechanisms which contribute to different segments of the reflected spectra are identified. First is the retrospecular front surface reflection which tends to be polarization sensitive. This mechanism is responsible for the high specular peak in the Oh-scan. Second is the back surface reflection. which accounts for the low specular peak in the 0,-scan. this component is less polarization sensitive than the front surface reflection. The third is the diffraction grating effect, which is responsible for the wide tail. in the 0,-scan.
7. Acknowledgements
The authors gratefully acknowledge Paul Woskoboinikow for many helpful discussions and advice, especially with respect to the initial selection of the candidate dump materials.
We also thank him for generously lending us his graphite dumps. Many thanks go to Camilo Gomez and Rex Gandy for support with the measurement hardware and helpful suggestions. This project was supported by DOE contract DE-AC02-78ET51013.
Table 1. Properties of Selected Dump Materials Properties of Dump Materials
-
Pyrex
Macor Alumina GraphiteN 1.7 2.2 3.2 17.0
a(cm-1) 4.0 0.9
* Data not available.
Table 2. Computed Reflectivity for Different Groove Angles Computed Reflectivity (E,.
E
2)20 Polarization Pyrex Macor Alumina
600
1.
x 10-11 9. X 10-7 600 0.004 0.02 450 8. x10 3. : 10.
10-5 45I 7.> x0-4 0.005 0.03 300 - - 4. x 10-8 30 0.007Reflectivity in the Specular Direction
Measured Reflectivity
(%)
Dump Unpolarized E Eli LPF
S.S. 100 100 100 100 Pyrex(H) 0.32 0.46 0.17 0.70 Pyrex(V) 0.074 0.079 0.060 0.25 Macor(H) 0.58 0.91 0.23 0.75 Macor(V) 0.13 0.12 0.12 0.27 Alumina(H) 4.2 4.3 3.8 13. Alumina(V) 1.3 1.2 1.4 5.4 Graphite(H) 30. 43. 17. --Graphite(V) 3.8 4.6 3.7 -Graphite(cone) 2.6
-Table 4. Measured Total Reflection
Measured Total Reflection
(%)
Dump Unpolarized E Ell
Pyrex 0.64 0.88 0.41
Macor 0.97 1.5 0.45
Alumina 7.8 7.8 7.3
Graphite(groove) 43 58 24
Graphite(cone) 10* --_
* Retrospecular component not accounted for.
13
List of Figures
Figure 1. Reflection and Transmission at a Dielectric Interface
Figure 2. Semicircle Representation of the Groove
Figure 3. Macor, Pyrex. and Alumina Dumps
Figure 4. Graphite Dumps
Figure 5. Measurement Configuration
Figure 6. Reflection Spectra for the Five Dumps
Figure 7. Oh-scan and 0,-scan Spectra
Figure 8. Retrospecular Reflection
Figure 9. Back Surface Reflection
Figure 10. Diffraction Grating Effect
Figure 11. Combined Spectra
References
1i Kato, K., "Non-Thermal Electron Distribution Measurement in Alcator C using
Elec-tron CycloElec-tron Emission,'" Ph.D. Thesis Prospectus submitted to the Department of
Nuclear Engineering, MIT, April 1984.
r2] Bekefi, G., and Barrett. A. Electromagnetic Vibrations, Waves, and Radiation, MIT
Press, Cambridge. Mass. 1977.
3 Woskoboinikow, P., Erickson, R., Mulligan, W.J.. "Submillimeter- Wave Dumps for
Fusion Plasma Diagnostics," PFC/JA-83-11, 1983.
4 Altemose, V.O., and Kacyon, A.R., "Vacuum Compatibility of Machinable Glass
Ce-ramics," Corning Technical Paper.
5 Afsar, M.N., and Button, K.J., "Precise Millimeter-Wave Measurements of Complex
Refractive Index. Complex Dielectric Permittivity and Loss Tangent of GaAs, Si, SiO2,
A1203. BeO. Macor and Glass." IEEE Tr. on Microwave Theory and Techniques. Vol.
MTT-31. No.2. Feb. 1983.
EiL
Ei,,
Er a
E Erar
/~E
r.L
N
1N..2
E t
Figure
1Incident
Ray
T
Figure 2 17Incident
Ray
A
450
4
<,,Groove Wall
E
E
5mm
4.mmm
70mm
(b)
Figure 3
(a)
v
\(b)
Figure
4
In Sb Detector
Hg
Arc Lamp
Copper
Waveguide
Polarizer/7
z dLow
Pass Filter
440 GHz Cut-off
Dump
Dump Holder
100
.- s.s.
o
-Graphite (H)
c- Alumina (H)
k&-Graphite (V)
v- Graphite (Cone)
u-Alumina (V)
10
--
Macor (H)
7
-
v- Pyrex (H)
5
-
-
Macor (V)
3
+-
Pyrex (V)
2
1
L 0.10.01
0
10
20
30
40
Detector Angle (Degrees)
from Specular Position
Figure 6
OV,
H
II
Cu rve A
Curve B
Fir
OH Figure 7A
10 0
<Groove Wall
--
/.
_
Figure 8 29A
A
B
450
10
1
-0
b
\ ---d
Figure 10
256