HAL Id: hal-02627387
https://hal.inrae.fr/hal-02627387
Submitted on 26 May 2020
HAL is a multi-disciplinary open access
archive for the deposit and dissemination of
sci-entific research documents, whether they are
pub-lished or not. The documents may come from
teaching and research institutions in France or
abroad, or from public or private research centers.
L’archive ouverte pluridisciplinaire HAL, est
destinée au dépôt et à la diffusion de documents
scientifiques de niveau recherche, publiés ou non,
émanant des établissements d’enseignement et de
recherche français ou étrangers, des laboratoires
publics ou privés.
plant water use, and ecological and environmental
controls
Remko A. Duursma, Christopher J. Blackman, Rosa Ana Lopez Rodriguez,
Nicolas Martin-Stpaul, Cochard, Belinda E. Medlyn
To cite this version:
Remko A. Duursma, Christopher J. Blackman, Rosa Ana Lopez Rodriguez, Nicolas Martin-Stpaul,
Cochard, et al.. On the minimum leaf conductance: its role in models of plant water use, and ecological
and environmental controls. New Phytologist, Wiley, 2019, 221 (2), pp.693-705. �10.1111/nph.15395�.
�hal-02627387�
Version preprint
Tansley review
On the minimum leaf conductance: its role in
models of plant water use, and ecological and
environmental controls
Author for correspondence: Remko A. Duursma Tel: +61(0)45701806
Email: remkoduursma@gmail.com Received: 28 February 2018 Accepted: 15 July 2018
Remko A. Duursma1 , Christopher J. Blackman1, Rosana Lop!ez1,2 , Nicolas
K. Martin-StPaul3 , Herv!e Cochard2 and Belinda E. Medlyn1
1Hawkesbury Institute for the Environment, Western Sydney University, Locked Bag 1797, Penrith, NSW, Australia;2Universit!e
Clermont-Auvergne, INRA, PIAF, 63000 Clermont-Ferrand, France;3URFM, INRA, 84000 Avignon, France
Contents
Summary 1
I. Introduction 1
II. Comparison of various definitions and measurement techniques of
minimum conductance 2
III. Cuticular conductance 3
IV. Contribution of stomata 4
V. Environmental and ecological variation in minimum conductance 4
VI. Use of minimum conductance in models 6
VII. Conclusions 11
Acknowledgements 11
References 11
New Phytologist(2018)
doi: 10.1111/nph.15395
Key words: cuticular conductance, drought tolerance, ecosystem modeling, plant water relations, stomatal conductance model.
Summary
When the rate of photosynthesis is greatly diminished, such as during severe drought, extreme temperature or low light, it seems advantageous for plants to close stomata and completely halt water loss. However, water loss continues through the cuticle and incompletely closed stomata, together constituting the leaf minimum conductance (gmin). In this review, we critically evaluate
the sources of variation in gmin, quantitatively compare various methods for its estimation, and
illustrate the role of gminin models of leaf gas exchange. A literature compilation of gminas
measured by the weight loss of detached leaves is presented, which shows much variation in this trait, which is not clearly related to species groups, climate of origin or leaf type. Much evidence points to the idea that gminis highly responsive to the growing conditions of the plant, including
soil water availability, temperature and air humidity – as we further demonstrate with two case studies. We pay special attention to the role of the minimum conductance in the Ball–Berry model of stomatal conductance, and caution against the usual regression-based method for its estimation. The synthesis presented here provides guidelines for the use of gminin ecosystem
models, and points to clear research gaps for this drought tolerance trait.
I. Introduction
Plants face a dilemma in constructing leaves that minimize water loss, whilst allowing the uptake of CO2. As a membrane that is
permeable to CO2, but not H2O, has never evolved, all land plants
have stomata in their leaves, which disrupt the cuticle and allow CO2 uptake. It is well known that stomata open and close in
response to changes in light intensity, humidity and CO2
concentration at the leaf surface. To avoid desiccation and ultimate death, stomata typically close during periods of water stress. When
Version preprint
stomata are closed, water loss continues at a greatly diminished rate through the cuticle. After accounting for evaporative demand, this rate of water loss is expressed as the minimum conductance of a leaf. There is increasing recognition that the minimum conductance plays an important role in estimating the water fluxes in plant canopies (Barnard & Bauerle, 2013), during heat waves (Kalaet al., 2016) and in models of plant drought response (Blackmanet al., 2016; Martin-StPaulet al., 2017).
A comprehensive review of gmin with the goal to improve
functional model representation is made difficult by the fact that literature data arise from various methods, and represent distinct processes. The absolute minimum attainable water loss rate is through the cuticle only, which is typically measured on isolated cuticles of the adaxial (nonstomatal) side of the leaf. Other measurements allow for the estimation of water loss through incompletely closed and broken stomata. Of particular interest because of its simplicity is the method in which leaves are detached from the plant, their weight loss monitored over time and expressed as the minimum conductance (gmin). This method (mass loss of
detached leaves, MLD) aims to simulate field conditions during severe drought, when water supply to the leaf has practically ceased, although it proceeds much more quickly (typically 0.5–2 d, compared with weeks or even months in field conditions). This measurement also includes both surfaces of the leaf – not just the adaxial side. A comprehensive compilation of estimates ofgminis
currently lacking, and is needed, not just to parameterize models, but also to study sources of variation in this overlooked plant trait. In this review, we discuss the role of the minimum conductance in models of plant water use, and critically evaluate sources of variation in this parameter. Previous reviews of the minimum conductance have largely focused on the biology of the plant cuticle, and detailed physiology and anatomy of water transport across cuticles (Kerstiens, 1996a; Riederer & Muller, 2006; Fern!andez et al., 2017; Schuster et al., 2017). Other work has focused on a different definition of the minimum conductance (g0):
the value that should be used in models of plant water use (e.g. Barnard & Bauerle, 2013; Lombardozzi et al., 2017), which includes bothgminand a ‘stomatal residual’ because of the fact that
stomata do not completely close during periods of zero photosyn-thesis (De Kauwe et al., 2015). This discussion often centers around leaf conductance during the night (Lombardozzi et al., 2017), but we must also consider appropriate values for the minimum conductance during the day, for example during very high (or low) temperature, transient low light and extreme drought. Thus, there is a lack of connection between the detailed understanding of the plant cuticle (Riederer & Muller, 2006) and the very simple assumptions made when using leaf conductance in global vegetation models (GVMs).
We aim to improve the connection between the physiology of minimum conductance, empirical approaches and model imple-mentations by synthesizing the state of knowledge. Our goals are as follows: (1) to quantitatively compare various definitions ofgmin,
which have sometimes been assumed to be equal; (2) to present a new compilation of minimum conductance measurements, which we use to test for ecologically meaningful patterns, and demonstrate the large acclimatory potential of this trait to environmental
drivers; and (3) to demonstrate the need to include a nonzero minimum conductance in models of water use efficiency and drought responses.
II. Comparison of various definitions and
measurement techniques of minimum conductance
Measurements of minimum conductance, after stomatal closure is either induced or assumed, can be broadly divided into the following categories: conductance of the cuticle only, conductance of detached leaves, and gas exchange measurements during conditions leading to presumed stomatal closure (Table 1). The absolute minimum conductance attained by leaves is that through the cuticle only. Measurements of cuticular conductance (gcuti) are
typically made on isolated nonstomatal cuticles (Riederer & Schreiber, 2001) via special gas exchange techniques (Boyeret al., 1997), or via MLD by sealing the side with stomata (Kerstiens, 1996a). We further discuss some important aspects of cuticular conductance in Section III.
The minimum conductance of intact leaves is typically measured by MLD. In this method, leaves are detached and leaf mass is monitored over time as the leaf dries out. Early work by Hygen (1951) showed that, after a leaf is detached, initial water loss rates are high, but, after some time, a constant low rate is achieved. From this minimum transpiration rate (sometimes described as the ‘residual transpiration’ or ‘epidermal transpiration’), the minimum conductance (gmin) can be estimated using the measured vapor
pressure deficit (VPD) (Sinclair & Ludlow, 1986). Although this method resembles the conditions that plants may experience during a dry-down or periods of extreme stress, some uncertainties regarding the methods of measurement remain. In our own work, we have found that, in some leaves, the water loss rate increases (rather than decreases) sometime after leaf detachment (see Supporting Information Methods S1). It is likely that the relatively rapid dry-down sometimes causes artifacts, and must be carefully avoided (see also Heinsoo & Koppel, 1998).
We quantitatively compared gcuti and gmin by synthesizing
existing data. In addition, we compiled data on leaf conductance when photosynthesis rates are low or zero during nondrought conditions: night-time conductance (gdark) (further discussed in
subsection VI.4), conductance at low photosynthetically active radiation (PAR) (0–40lmol m!2s!1) during the day, and
con-ductance during conditions in which photosynthesis rates are very low (< 1lmol m!2s!1) (but excluding low PAR and drought).
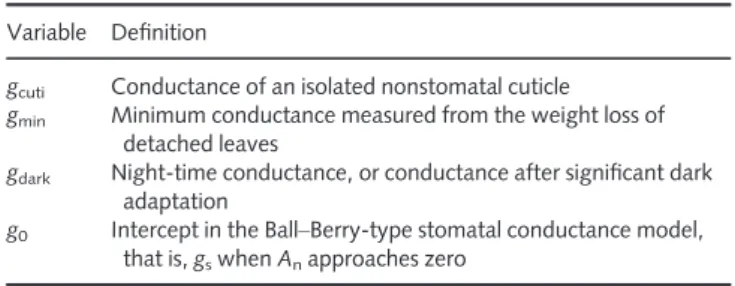
Table 1 Definitions of minimum conductance
Variable Definition
gcuti Conductance of an isolated nonstomatal cuticle
gmin Minimum conductance measured from the weight loss of
detached leaves
gdark Night-time conductance, or conductance after significant dark
adaptation
g0 Intercept in the Ball–Berry-type stomatal conductance model,
Version preprint
Measurements of conductance of isolated, nonstomatal cuticles (gcuti) were taken from the compilations by Kerstiens (1996a) and
Schusteret al. (2017) (both also include gmindata, but these were
not used as they included no metadata). Data on minimum conductance (gmin) from MLD were compiled from 40 original
papers (see Methods S2 for description and references). For the compilation, we returned to all original papers mentioned in the review by Kerstiens (1996a), and added many newer sources (see Methods S2 for full details of the compilation). The database includes a total of 221 species (136 Angiosperm, 49 Gymnosperm, 1 Pteridophyte) from 57 taxonomic families, with woody species making upc. two-thirds of the data.
All conductance values were converted to per unit projected surface area, allowing direct comparison with stomatal conduc-tance data which are typically presented in these units. Estimates of gdarkwere taken from Lombardozziet al. (2017), who compiled
measurements ofc. 150 species during the night (we selected only gas exchange-based measurements from their database). Daytime values (glow PARandglowA) were estimated from an update to the
Linet al. (2015) database by taking the appropriate subsets and averaging thegsvalues by species within the study. All data and code
to reproduce the database and analyses are available online (see the Acknowledgements section).
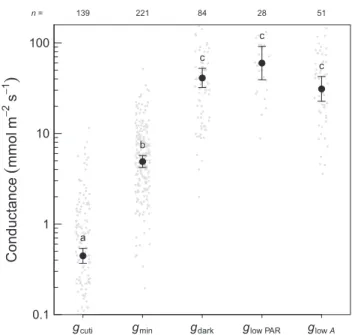
The results of the quantitative comparison are presented in Fig. 1. From this compilation, a few striking differences among the estimates are apparent. Cuticular conductance averaged 0.45 mmol m!2s!1, 10-fold lower thangmin(4.9 mmol m!2s!1).
This result is in line with the methods comparison of Kerstiens (1996a). More recently, Schusteret al. (2017) argued, based on data for eight species, thatgminfrom MLD is comparable withgcuti.
However, in the same study, a literature compilation of hundreds of values showed thatgcutiwas 10-fold lower thangmin, although this
finding was not reported by Schuster et al. (2017) (see also Fern!andezet al., 2017) and, instead, gminandgcutiwere pooled in
their analysis. Nonetheless, the comparison betweengcutiandgmin
should be viewed with some caution as Kerstiens (1996a) argued that measurements ofgcutimay be too low because of the low water
content of the cuticle after detachment from the leaf and storage in often dry-air conditions. Boyer et al. (1997) suggested that this decline in the cuticular permeability could be a result of stretching of the wax layer at full saturation and tightening of the wax structure as the turgor releases.
Conductance in the dark (gdark) (mean = 41.4 mmol m!2s!1)
was, on average, eight-fold higher than gmin. It is not a new
observation that stomata do not close fully in the dark (further discussed in subsection VI.4). Previous studies have directly compared gdark and gmin in the same species, and generally
concluded thatgdarkis much higher thangmin(Hygen & Midgaard,
1954; K€orner, 1994; Walden-Coleman et al., 2013), but an exception is Cavender-Bareset al. (2007), who found that the two rates are similar in oaks. In turn,gdarkcould not be differentiated
from stomatal conductance measurements during daytime in very low light (mostly just after dawn or before sunset) (glow PAR) or
during conditions in which photosynthetic rates were very low (as a result of very high temperature, VPD or other factors) (glowA).
These comparisons demonstrate thatgsvalues during nondrought
conditions when photosynthetic rates are zero or negligible are much higher than the minimum reached in simulated drought conditions (gmin).
III. Cuticular conductance
A review of cuticular transport mechanisms, biochemical compo-sition and formation of cuticular waxes is well outside the scope of this review, as these topics have been well described elsewhere (Kerstiens, 1996a, 2006; Schreiber & Riederer, 1996; Schreiber, 2001; Shepherd & Wynne, 2006; Schusteret al., 2016). However, a few key points should be summarized as they are relevant to the current discussion, in particular when we aim to interpret the variation in literature values ofgmin(Section V).
Although we use the term ‘cuticular conductance’ freely, this transport pathway does not represent a true conductance, as water does not diffuse as a gas through the cuticle. Instead, it dissolves into the medium of the cuticle, diffuses through the solid matrix and is desorbed at the outer edge of the cuticle (Kerstiens, 1996a; Schreiber & Riederer, 1996; Riederer & Schreiber, 2001). The main barrier to diffusion is actually a very thin layer of wax at the leaf surface. Because most of the resistance is located in such a thin layer, gcuti does not correlate with the thickness of the cuticle
(Priestley, 1943; Riederer & Schreiber, 2001; Anfodillo et al., 2002; Schuster et al., 2016). Nonetheless, there is considerable variation in cuticle thickness among plant species (Schuster, 2016), along altitudinal transects (DeLucia & Berlyn, 1984) and even with
Cond uctance
(
mmol m −2 s −1)
gcuti gmin gdark glow PAR glow A a b c c c 0.1 1 10 100 139 221 84 28 51 n =
Fig. 1 Comparison of various estimates of the (presumed) minimum conductance. Error bars are 95% confidence intervals. Gray dots are the original data (but a few data points occur outside the figure range). Different
letters denote significant differences (ata = 0.05). gcuti, conductance of
isolated cuticles; gmin, minimum conductance measured with mass loss of
detached leaves; gdark, leaf conductance during the night or after dark
adaptation; glow PAR, leaf conductance during low light (PAR,
photosynthetically active radiation); glow A, leaf conductance during periods
Version preprint
increasing height in the canopy of very tall trees (Woodruffet al., 2010). If the cuticle thickness does not directly affect its conductance, what is the value of a thicker cuticle?
It is important to bear in mind the many other functions of the cuticle, including the attenuation of radiation, as a barrier to fungal pathogens, various interactions with insects, including signaling and herbivory resistance (Kerstiens, 1996b; Riederer & Muller, 2006; M€uller, 2008), and foliar water uptake (Fern!andezet al., 2017). The thickness of the cuticle may also confer mechanical strength, as Onodaet al. (2012) reported that thicker cuticles are more resistant to tearing (the force to tear was proportional to the cuticle thickness). As such, thick cuticles may be advantageous in exposed environments to avoid excessive damage (Blackmanet al., 2005). Prolonged exposure to wind has been shown to increase the conductance of the cuticle (Grace, 1974; Hadley & Smith, 1983; van Gardingenet al., 1991) by dislodging cuticular compounds by abrasion (Roggeet al., 1993). Similarly, exposure to simulated rain damages the cuticle and increases its conductance (Baker & Hunt, 1986), most dramatically demonstrated in an ice storm, leading to much highergmin(Boyceet al., 2003).
Despite considerable work on the topic, no clear relationship between the chemical composition or structure of the cuticle and its conductance has emerged. Recently, Schuster (2016) presented a comprehensive study of cuticle chemical composition, but was able to explain only some of the wide range ofgcutimeasured across
different plant species. Similarly, Hauke & Schreiber (1998) found no relationship between the gradual decrease ingcutiinHedera helix
during leaf maturation and cuticle wax amount, mean chain lengths or cuticle weight.
IV. Contribution of stomata
The minimum leaf conductance includes two pathways: across the cuticle and through the (potentially incompletely closed) stomata. Only a few studies have directly quantified the stomatal component of minimum conductance, in contrast with the wealth of information on the cuticular component. A detailed study of Hedera helix concluded that 35% of water loss occurred across the stomatal pores (although closed) and 65% across the nonstomatal part of the cuticle, despite the fact that the stomata presumably covered only a small fraction of the leaf (#Santru#ceket al., 2004). For 10 Sorghum genotypes, Muchow & Sinclair (1989) reported a strong positive correlation between stomatal density and gmin,
suggesting that leaky stomata contribute substantially togmin. For
seven conifer species, Brodribbet al. (2014) reported that 50–94% of water loss of detached leaves originated from the stomatal side, concluding that stomata must be very leaky, and probably incompletely closed. However, #Santru#ceket al. (2004) found that the cuticle of the stomatal side (but excluding the stomata themselves) inHedera helix was many times more permeable than the nonstomatal side, thus providing another potential explanation for this difference. Either way, the water loss rates of intact leaves cannot be simply explained by the permeability of isolated nonstomatal cuticles, the contribution of leaky stomata and the potentially more permeable cuticle on the abaxial side, and probably varies among species.
One key question is whether incomplete stomatal closure is under the plant’s control, or whether it is an unavoidable consequence of imperfect stomata, damage, blocking by particles, etc. For example, endophytic fungi, which commonly colonize plant leaves, have been shown to prevent stomatal closure and greatly increase water use (Arnold & Engelbrecht, 2007). As discussed in the next section, there is ample evidence to suggest that stomata not only stay open in the dark, but that plants actively control stomatal conductance during the night. During severe drought, there is less evidence for such active control, and it seems likely that incomplete closure is not under the plant’s control as there is no obvious reason to keep stomata open. Some conditions (especially rapid drying conditions) may lead to excessive drying of the epidermis, which can physically pull apart the stomata (‘mechanical advantage’, Buckley, 2005).
V. Environmental and ecological variation in minimum conductance
1. Minimum conductance is highly variable among species In the following sections, we review the quite substantial literature ongminmeasured with the MLD technique, stretching back to the
1930s (Pisek & Berger, 1938), focusing on environmental and ecological determinants. We also further analyze the literature compilation ofgmin(Fig. 2), and separately analyze crop species and
their genotypic variation. Comparing all available data, we did not find significant relationships betweengminand climate of origin,
nor were there meaningful relationships with other traits (see Methods S1). We thus found it difficult to explain the variation in gmin among species. A simple breakdown by taxonomic order
(Fig. 2b) revealed that grasses (Poales) have a highergmincompared
with other orders, and conifers (especially Pinales) tend towards the lower range of values (but are only significantly different from Poales).
Very few studies have found meaningful correlations between gminand environmental factors or ecological categories. Based on
their own compilation of the literature, Schuster et al. (2017) concluded that there were no significant differences ingminorgcuti
(analyzed together) by plant growth form. One notable exception was Brodribbet al. (2014), who showed a correlation with rainfall at species origin (of the driest quarter), but these authors used a gas exchange approach (over many weeks), not MLD. This correlation did not hold across the species in our database. Of particular note, Eucalyptus species (n = 11, included in Myrtales) – all measured on the driest continent of Australia – havegminvalues slightly higher
than the average (Fig. 2b).
In crop science,gminhas long been identified as a key drought
tolerance trait (Sinclair & Ludlow, 1986). A number of studies have targetedgminas a key trait for the breeding of more drought-tolerant
crops, leading to comparisons ofgminacross genotypes grown in the
same conditions. For example, Jameset al. (2008) compared gminin
58 soybean (Glycine max) genotypes, and found more than two-fold variation that could not be easily explained by other traits. In Fig. 2(c), we have compiled a number of studies in crops, demonstrating not just variation ingminamong crops, but also
Version preprint
the wide range ingminamong genotypes. Again, it is striking that the
wide variation ingmincannot be easily explained by variation in leaf
or other traits, or chemical and structural components of the cuticle (Bengtson et al., 1978; James et al., 2008; Saito & Futakuchi, 2010), suggesting a significant role of incomplete stomatal closure.
2. Acclimation to the environment
Although there is clearly considerable variation in gmin among
species, a number of lines of evidence suggest thatgminalso has great
potential for plasticity. Here, we summarize the literature on the acclimation ofgminto drought conditions, to changes in
temper-ature and humidity, and the change ingminwith leaf age, altitude
and other factors. This discussion is directly relevant to the use of gmin in models, because, if the degree of plasticity is large, it
complicates model parameterization.
There is a general tendency for a decreased gmin in plants
acclimated to drought stress (Jameset al., 2008). The magnitude of the decrease ingminwith acclimation to drought stress varies from
!4 to !70% (across 10 studies, see Table S1), with a typical decrease on the order of 30–40%. In each of the studies summarized, plants were grown in well-watered or drought conditions, and, in one case, a difference ingminwas demonstrated
after just 4 d of drought exposure (Bengtsonet al., 1978). We also demonstrate drought acclimation via a case study on 11Hakea species grown in two watering treatments (Fig. 3). All 11 species showed a decrease ingminin the drought treatment (see Methods S3
for experimental details). This significant change in gmin with
drought acclimation is probably an important component of the overall drought hardening of plants.
The idea that water limitation causes a reduction in gmin(via
changes in the chemical composition of the cuticle) can be tested by
inspecting the response to factors that increase evaporative demand. As one of the very few studies testing this idea, Fanourakiset al. (2013) reported much lowergmininRosa sp. plants grown in 60% vs
95% relative humidity. The difference could be attributed largely to a change in stomatal anatomy and lack of closure during desiccation, not to changes in the cuticleper se. Also relevant is Sack
gmin
(
mmol m−2s−1)
Density 0.1 1 10 100 0.0 0.2 0.4 0.6 0.8 1.0 1.2 (a) gmin(
mmol m −2 s −1)
Pinales A ra uc ar ia le s Er icales Fa ga le s Rosales Cupressales Lamiales Fa ba le s Myr tales Po al es a a ab a ab a ab ab ab b 0 5 10 15 20 25n = 15 12 8 18 13 24 8 19 13 15 (b) gmi n(
mm ol m −2 s −1)
Oats Pe an ut Cotton Sorghum Maiz e Soybean Millet Wheat Rice
0 5 10 15 20 25 30 35n = 6 21 22 20 3 64 2 15 13 (c)
Fig. 2 Analysis of a literature compilation of minimum conductance (gmin) estimates, as measured with mass loss of detached leaves. (a) Histogram (probability
density) of all estimates (after averaging by species, n = 221), with a log-normal distribution curve (mean = 4.89, SD = 2.67). (b) gminaveraged by phylogenetic
order (including only the top 10 orders in the database). Bars are 95% confidence intervals. Numbers above the figure refer to the number of species. Different
letters denote significant differences (ata = 0.05, adjusted for multiple comparisons) and gray symbols are species-level data. (c) gminestimates for crops only,
averaged by genotype. Bars denote the range, illustrating the wide range in gminamong genotypes for a particular crop species. Numbers above the figure refer
to the number of genotypes included.
H. petiolar is H. dactyloides H. elliptica H. prostr ata H. leucopter a H. teretif olia H. ser icea H. v ar ia H. lorea H. salicif olia H. propinqua gmi n ( mmol m −2 s −1 ) 05 10 15 20 Well−watered Drought stress B B B B N N N B N B N
Fig. 3 Minimum conductance (gmin) measured by mass loss of detached
leaves on a variety of Hakea species, a genus native to Australia. Plants were grown in containers in a grow house, and supplied with ample water or subjected to long-term (8 months) mild drought stress. Bars are labeled by
leaf form (broadleaf (B) or needle-like (N)) and ordered by gminin the
well-watered treatment. For drought-treated plants, gminwas higher for species
with needle-like leaves (Wilcoxon test, P = 0.02), but not for well-watered plants (P = 0.14).
Version preprint
et al. (2003), who reported lower gminin sun leaves (for two of four
species) compared with shade leaves, again a lowergminfor leaves
acclimated to high evaporative conditions.
A number of studies have attempted to attribute the drought-induced acclimation ingminto a change in the chemical
compo-sition of the cuticle. Bengtsonet al. (1978) reported lower gminin
six oat varieties in response to drought, and an increase in the amount of cuticular waxes, but could not find a relationship between the two and the response was highly genotype specific. However, Premachandraet al. (1992) found that the epicuticular wax load increased on leaves of nonirrigatedSorghum cultivars and was positively correlated with cuticular conductance and cell membrane stability. Mackov!aet al. (2013) found that the addition of abscisic acid (ABA, simulating drought stress) to Lepidium sativum increased the chain length of cuticular waxes (but not the total amounts). Biet al. (2017) also reported that drought caused a change in cuticular wax production and chemical composition, but again in a highly genotype-specific way. Thus, it can be concluded that the cuticle indeed changes substantially after a change in plant-available water, but in a complex, species-specific manner that is yet to be connected directly to changes ingmin.
The response ofgminto temperature is more complex; it shows
both a response to instantaneous changes in temperature, as well as an acclimatory response to growth temperature. Riederer & Schreiber (2001) and Schuster et al. (2016) have both demon-strated a steep nonlinear instantaneous response of gcuti to
temperature, with the response becoming especially steep at higher temperatures (> 40°C). InEucalyptus haemastoma, the response of gminto temperature was so steep that the proportion of cuticular to
total transpiration increased from 2–3% at 20°C to 40% at 38°C (Eamus et al., 2008). The mechanism of the instantaneous temperature response is complex and highly species specific, and we refer to Schusteret al. (2016) for a detailed investigation. The rapid increase ingminat high temperature may well be a crucial
component of the ability of plants to tolerate heat waves (Drake et al., 2018). In support of the link between gminand heat tolerance,
Schuster (2016) reported a negative relationship between thermal tolerance and gmin across nine species, such that species with
improved tolerance to very high temperature had a lowgmin.
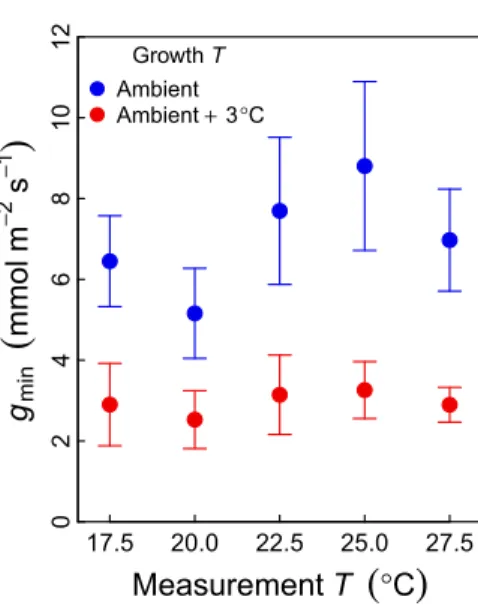
Less well established is the acclimatory potential of gmin to
changes in growth temperature. We present a case study on Eucalyptus parramattensis grown in whole-tree chambers (see Methods S3 for experimental details). The chambers either tracked ambient conditions, or were subjected to a + 3°C warming treatment. After several months of growth in the treatments,gmin
was measured at various temperatures, ranging from 17.5 to 27.5°C. We found a 56% decrease in gmin in the elevated
temperature trees, but there was no clear pattern with measurement temperature (Fig. 4). This decrease ingminis consistent with the
drought response because, again,gminis reduced in leaves that are
subjected to conditions that increase evaporative demand (VPD was higher in the elevated temperature treatment, see Drakeet al., 2018). The direction of this response is consistent with Duarteet al. (2016), who reported lowerg0andgdarkin a heat wave treatment in
Pseudotsuga menziesii, which persisted for some time. Responses across temperature gradients are more complex. In particular, the
change in gmin with altitude has been well studied, and it is
commonly reported thatgminincreases with altitude (e.g. DeLucia
& Berlyn, 1984; Herrick & Friedland, 1991; Anfodillo et al., 2002). Fern!andezet al. (2017) discuss the literature on altitude responses in detail and argue that the short growing seasons at high altitude are insufficient for complete maturation of leaf cuticles.
Finally, we mention the striking effect of leaf age ongmin. We
have summarized five studies in Fig. S1, all of which reported an increasedgminfor older leaves for the majority of species studied.
The data reported by Jordan & Brodribb (2007) are particularly impressive, asgminin the woody shrubAgastachys odorata gradually
increased with leaf age up toc. 10 yr. If this effect is caused by properties of the cuticle alone, a possible explanation for the increase in gmin is the continued exposure to wind, rain and
abrasives, which have been shown to damage the cuticle and increase its conductance (see discussion in Section III). Another possibility is that the contribution of stomata togminincreases with
leaf age, as reported by Jordan & Brodribb (2007). In plants that maintain several cohorts of leaves, the identification of an appropriate value ofgminfor use in models must take into account
the leaf age effect.
VI. Use of minimum conductance in models
1. Models of water use efficiency
Most current-generation, process-based GVMs use a version of the Ball–Berry class of ‘stomatal’ (technically including both stomata and the cuticle) conductance (gs) models characterized by the
dependence on assimilation rate, CO2and humidity (Eqn 1).
Measurement T
(
°C)
gmin(
mmol m −2 s −1)
02468 10 12 17.5 20.0 22.5 25.0 27.5 Growth T Ambient Ambient + 3°CFig. 4 Minimum conductance (gmin) measured with mass loss of detached
leaves on Eucalyptus parramattensis grown in whole-tree chambers. Trees were grown following ambient conditions or in an elevated temperature
treatment (+ 3°C) (see Drake et al., 2018). Measurements of gminwere
carried out at five different temperatures on replicate leaves. There was no
consistent effect of measurement temperature on gmin, but leaves of trees
grown in elevated temperature showed, on average, a 45% reduction in gmin
(P < 0.01, linear mixed-effects model). Error bars denote 95% confidence intervals.
Version preprint
gs¼ g0þ g1An
CafðDÞ
Eqn 1 whereg1is a ‘slope’ parameter,Anis the leaf net photosynthetic
rate, Ca is the atmospheric CO2 concentration, f(D) is some
function of the VPDD (or relative humidity in the case of the model of Ballet al. (1987); see Damour et al. (2010) for a list of functions) and g0 is the value of gs when An is zero. The g1
parameter is directly related to the water use efficiency: large values ofg1indicate low water use efficiency. In this article, we refer to
Eqn 1 as ‘the Ball–Berry model’, thus including all model formulations that include different f (D) functions besides that proposed by Ballet al. (1987). Much attention has been paid to the quantification and interpretation of the variation in the g1
parameter (Medlynet al., 2011; Prentice et al., 2014; Lin et al., 2015; Mineret al., 2017), but the g0parameter has been studied in
much less detail. For example, a recent comprehensive review of stomatal conductance models did not mentiong0or any similar
minimum conductance (Damour et al., 2010). The original description of Eqn 1 as published by Ball et al. (1987) did not include an intercept term. It was first introduced in the unpublished manuscript of Ball et al. (1987) as an ‘intercept’ without further discussion of the role that it plays in the model. In practice,g0is usually estimated from a regression of Eqn 1 with
leaf gas exchange data, but, as shown here, this approach may lead to inaccurate values, as pointed out by Barnard & Bauerle (2013), but not explained in detail.
In the Ball–Berry-type framework of stomatal conductance models, the effects of the photosynthetic photon flux density (PPFD) and leaf temperature ongsare both assumed to enter via the
dependence of Anon these drivers. Here, we show that theg0
parameter not only sets a minimum value ofgsin the model (when
Anis zero), but it also modifies the behavior of Eqn 1 after it has
been coupled to the Farquhar–von Caemmerer–Berry model of photosynthesis (the so-called ‘coupled leaf gas exchange model’). Leuning (1990) definedg0asgswhenAnapproaches zero as PPFD
approaches the light compensation point, and pointed out thatg0is
necessary to simulate the increase inAn/gs(andCi) at low light (see
also Leuning, 1995). Similarly, Collatzet al. (1992) showed that the inclusion ofg0affects the response ofgsto relative humidity in
the coupled leaf gas exchange model. Despite these early reports, the exact role ofg0in models is often overlooked.
In this review, we focus on the cuticle as a barrier to water loss, but point out that previous work has shown that the cuticle is much less permeable to CO2than H2O (Boyeret al., 1997; Boyer, 2015).
This finding, if indeed generally true, has a large effect on the calculation of various gas exchange parameters (Hanson et al., 2016). Manzoniet al. (2011) recalculated leaf water use efficiency for drought-treated plants assuming that CO2is blocked by the
cuticle, but the uncertainty of this approach is the effect of leaky and incompletely closed stomata. Because g0 includes not just the
cuticle, but also incompletely closed stomata, we ignore this effect in the model simulations that follow.
Within the model framework,g0is reached when photosynthesis
(An) goes to zero. However, An can approach zero for many
different reasons, including low light, high temperature, low
humidity and drought, and it is unclear whether the sameg0is
reached in each of these cases. In the application of the Ball–Berry model, it is frequently assumed thatg0must equalgsat night, simply
because no photosynthesis occurs at night (Uddlinget al., 2005; Barnard & Bauerle, 2013; Lombardozziet al., 2017). An alterna-tive common assumption is that g0 is equal to the absolute
minimum conductance achievable for a leaf, the ‘cuticular conductance’ (gcuti) (Baldocchi, 1997; Egeaet al., 2011; Manzoni
et al., 2011), which technically is the conductance of the cuticle alone, ignoring leaky and incompletely closed stomata. Photosyn-thesis also ceases at very high temperature, but stomata do not appear to always close in proportion to this decrease in photosyn-thesis, if at all (Urbanet al., 2017; Drake et al., 2018).
A popular approach in thinking about how stomata ‘should’ respond to environmental drivers is the idea that stomatal conductance is varied to maximize total photosynthesis for a given amount of water use (Cowan & Farquhar, 1977). The consequence is that stomata tend to open during periods that are favorable for photosynthesis (high light, optimal temperature) and close when photosynthesis drops to zero (darkness, very high temperature). Clearly, in this optimality framework, there is no place forg0, as it is
always suboptimal to open stomata (i.e. spend water) when there is no photosynthetic gain. Indeed, early work on optimal stomatal conductance models ignored the possibility ofgs> 0 when An= 0
(Cowan & Farquhar, 1977; Cowan, 1978; Hariet al., 1986, 1999). More recent work derives the optimalgs, and simply adds ag0to the
solution (Medlynet al., 2011).
As pointed out by Leuning (1990, 1995),g0needs to be > 0,
otherwise the ratio of intercellular CO2 to atmospheric CO2
concentration (Ci/Ca) does not vary with PAR, as is typical in leaf
gas exchange data (although other mechanisms can also be employed to simulate this pattern, see Dewaret al., 2018). When PAR approaches the light compensation point, clearlyCineeds to
approachCa, as no photosynthesis is occurring that draws downCi.
To see this point, we can rearrange Eqn 1 to give:
An=gs¼ CafðDÞ=g1 Eqn 2
and, using the diffusion constraint (Fick’s law) An¼ gs=1:6ðCa! CiÞ, we obtain an expression for Ci/Ca:
Ci=Ca¼ 1 ! fðDÞ
1:6& g1
Eqn 3
Eqn 3, derived using zerog0, thus does not give any dependence
on PAR.
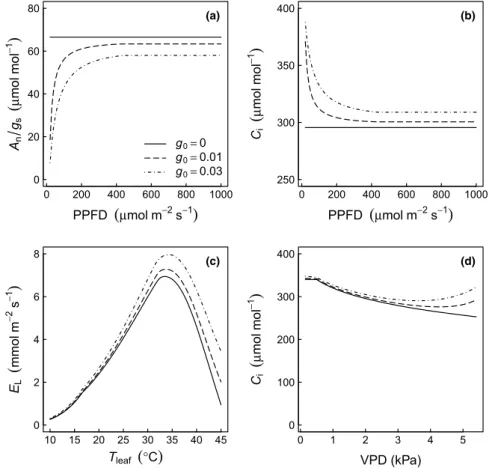
Using the coupled leaf gas exchange model, we show in Fig. 5 howAn/gsandCidepend on PPFD with three values ofg0(0, 0.01
and 0.03 mol m!2s!1). We also demonstrate the effect ofg0on
modeling of theTleafresponse. In this simulation,Tleafand VPD
are assumed to co-vary with an empirical relationship as used by Duursmaet al. (2014). Over the entire range of Tleaf, the inclusion
of a nonzerog0 obviously increases leaf transpiration, but at a
slightly higher rate than just due tog0. This effect arises because the
additional conductance allows slightly higher rates of photosyn-thesis, which, in turn, increasegsvia Eqn 1.
Version preprint
2. Models of plant desiccation
When plants are sufficiently water stressed so that stomata are mostly closed, water loss still continues at a rate determined by the minimum conductance. Thus, models that aim to predict when plants desiccate and die must include a minimum conductance term. A classic study by Pisek & Winkler (1953) calculated the length of time needed to desiccate leaves to some critical low water content, given the minimum transpiration rate and the saturated water content of the leaves. Based on that work, Burghardt & Riederer (2006) reported a direct correlation betweengminand the
survival time of leaves. Sinclair (2000) presented the minimum conductance as a key drought tolerance trait, and used it as a basis for the prediction of crop mortality during severe drought. More recently, Gleason et al. (2014) and Blackman et al. (2016) have proposed that embolism resistance together with whole-plant capacitance and minimum transpiration rates all contribute to define the time to desiccation. Building on this work, Martin-StPaul et al. (2017) demonstrated, in a whole-plant model of hydraulic failure, thatgminwas one of the key parameters to explain
the drop in water potential below the cavitation threshold, because
stomata generally close well before this threshold. Applying the Sureau model presented in Martin-StPaul et al. (2017), we illustrate the critical role ofgminin defining the desiccation time
(Fig. 6).
3. Problems with the estimation of g0from regression
The previous section discussed and compared methods for more or less direct measurements of minimum conductance according to various definitions. The approach taken by the majority of vegetation models is, however, very different. Usually,g0(for use
in Eqn 1) is estimated from regression, with gs as the response
variable and the right-hand side of Eqn 1 as the predictor (a combination of measured photosynthesis rate, air humidity and CO2 concentration). Theg0 parameter is thus estimated as the
intercept. Here, we briefly discuss some statistical aspects of this estimation procedure, and draw the general conclusion thatg0is
poorly estimated by this method. The difficulty of the estimation can already be anticipated from the fact that: (1) many studies setg0
to some assumed value rather than fitting it (e.g. Leuning (1995) uses 0.01 mol m!2s!1 for all species, presumably because
0 200 400 600 800 1000 0 20 40 60 80 PPFD
(
µmol m−2 s−1)
An gs(
µmol mol −1)
(a) g0= 0 g0= 0.01 g0= 0.03 0 200 400 600 800 1000 250 300 350 400 PPFD(
µmol m−2 s−1)
Ci(
µmo l mol −1)
(b) 10 15 20 25 30 35 40 45 0 2 4 6 8 Tleaf(
°C)
EL(
mmol m −2 s −1)
(c) 0 1 2 3 4 5 0 100 200 300 400 VPD (kPa) Ci(
µmol mo l −1)
(d)Fig. 5 Simulations with a coupled leaf gas exchange model (Duursma, 2015), demonstrating the effect of inclusion of the g0parameter (Eqn 1) on leaf fluxes.
(a) Intrinsic water use efficiency (An/gs) as a function of the photosynthetic photon flux density (PPFD), holding other environmental drivers constant, for three
values of g0. (b) The same simulations as in (a), but showing the intercellular CO2concentration (Ci). (c) Leaf transpiration (EL) simulations, where the vapor
pressure deficit (VPD) and air temperature (Tair) were covaried based on an empirical relationship (Duursma et al., 2014), reflecting typical covariation in field
conditions. (d) The same simulations as in (c), but showing Ci. Note how Ciincreases at high VPD and Tair, only when g0> 0. For all simulations, it is assumed that
Version preprint
unreliable estimates were obtained); and (2) negativeg0estimates
from regression are commonly reported (Leuning, 1995; Heroult et al., 2013; Miner et al., 2017), although it is clearly nonsensical to suggest negative conductance values. Barnard & Bauerle (2013) also mentioned the difficulty of fitting Eqn 1 to estimateg0, but did
not present specific details. The following analysis builds on their work by demonstrating statistical uncertainties.
It is also telling that there are few reports on the intraspecific plasticity or interspecific variation ofg0, perhaps because it is so
poorly estimated. An exception is Duarteet al. (2016), who found a lowerg0in a heat wave treatment inP. menziesii (although g1was
unaffected), but, in their case,g0was very accurately estimated by
careful multi-point light response curves. Another exception is Missonet al. (2004), who reported a close negative correlation between predawn leaf water potential andg0in Ponderosa pine
(again, theg1parameter was unaffected).
In the following, we demonstrate that the fitting process is problematic for three reasons: (1) the estimates ofg0 andg1are
highly correlated; (2) the precision forg0is generally much lower
than forg1; and (3) for data that have a worse fit overall, theg0
estimates are elevated. We thus conclude that g0 should not be
estimated from regression, although this is the most common method applied. In addition, it is difficult – and generally not recommended – to accurately measure low fluxes with a portable gas exchange system, and great care must be taken to arrive at reasonable estimates ofg0in this way.
Typically, gas exchange data are collected across a range of conditions, and are used to plotgsvs a combined term including
photosynthesis rate, CO2 concentration and air humidity. An
example dataset is shown in Fig. 7(a), together with a fitted linear regression line. We show in Fig. 7(b) that estimates ofg0andg1are
statistically correlated, that is, their confidence intervals are not
independent. Thus, large estimated values for g1 lead to low
estimates forg0, and vice versa. The consequence is that we cannot
use estimates ofg0from this approach in a compilation, because
these estimates depend ong1. The correlation between slopes and
intercepts is not unique to Eqn 1, but a general property of linear models (Stapleton, 1995; Becker & Wu, 2007).
Next, we study the values obtained when fitting Eqn 1 to many datasets, basing our work on the large database collected by Lin et al. (2015) and the compilation of Miner et al. (2017). The (updated version of) the Lin et al. (2015) database includes >15 000 gas exchange measurements on over 300 species. After selecting species/site combinations withn > 15, we produced 78 estimates ofg1andg0with nonlinear regression of the Medlynet al.
(2011) model of stomatal conductance. The compilation by Miner et al. (2017) includes 233 estimates of g0andm (they compiled
parameters for the original Ball–Berry model, equivalent tog1) for
172 species (including woody plants and crops).
For both databases, estimates ofg0are inflated when the model
fits poorly (Fig. 8a,b). This can be understood by considering that a poor fit often results in the flattening out of the regression line, thus giving a large value for the intercept. A poor fit is often obtained when there is little variation in the right-hand side of Eqn 1, usually because there is low variation in environmental conditions (humidity, light, temperature). We confirm this by showing that the standard error (SE) ofg0 increases when the coefficient of
variation of the right-hand side of Eqn 1 is lower (Fig. 8c).
4. Night-time conductance
A number of studies have assumed thatg0in the Ball–Berry model
equals the night-time conductance (gdark) (Barnard & Bauerle,
2013; Lombardozziet al., 2017), simply because it is a condition in
0 20 40 60 80 0.0 0.2 0.4 0.6 0.8 1.0
Time (d) Time (d) Time (d)
REW (a) gmin 2 4 0 20 40 60 80 −7 −6 −5 −4 −3 −2 −1 0 Wa te r p ot en tia l ( M Pa ) (b) Leaf Soil 0 20 40 60 80 0 20 40 60 80 100 PLC (%) (c)
Fig. 6 Simulations with the Sureau model demonstrating the effect of gminon the desiccation tolerance of plants. The Sureau model simulates water transport in
the soil–plant–atmosphere continuum, and includes a detailed representation of capacitance in stem and leaf tissues. (a) Soil relative extractable water (REW;
1 = field capacity, 0 = permanent wilting point) for the two simulations, using a minimum conductance (gmin) of 2 or 4 mmol m!2s!1– all other parameters were
equal. (b) Water potential in the soil and leaf as the dry-down progresses. (c) Progression of percent loss conductivity (PLC) of the xylem. Dashed line is at a PLC of 88%, indicating possible mortality.
Version preprint
which net photosynthesis is zero. We provide some caution to the assumption that gdark can be used in models of daytime leaf
conductance. First, ample observations suggest thatgdarkis not a
fixed rate, but varies tremendously during the night. Cairdet al. (2007) (and references therein) described how, for many species, gdarkis not stable throughout the night period. Instead,
endoge-nous, gradual increases in stomatal opening during predawn hours have been reported in many species under natural field conditions, as well as in controlled environments (Rawson & Clarke, 1988). Resco de Dios et al. (2016) showed that, in Eucalyptus camaldulensis, gdarkin the period just after sunset was much lower
than pre-dawngdark. Strong evidence for endogenous regulation of
gdarkwas reported by Resco de Dioset al. (2013), who showed that
gdark fluctuated throughout the night, despite environmental
conditions being held constant in whole-tree chambers. In addition, gdark can show a clear response to VPD (Barbour &
Buckley, 2007) during night-time conditions. Finally, gdark is
under strong genetic control independent of daytime water use – at least in grapevine (Coupel-Ledruet al., 2016). Clearly, gdarkis an
actively controlled process that cannot be adequately summarized by a single constant g0, and should be modeled in a separate
framework that is yet to be identified.
0.00 0.01 0.02 0.03 0.04 0 50 100 150 An (Ca D) gs ( mmol m −2 s −1 ) (a) 0 5 10 15 20 25 3.0 3.5 4.0 4.5 5.0 g0 (mmol m−2s−1) g1 ( kPa −0.5 ) (b)
Fig. 7 (a) Example linear regression of stomatal conductance (gs) against a combination of terms, in this case the linearized version of the model of Medlyn et al.
(2011) applied to a leaf gas exchange dataset of Martin-StPaul et al. (2012). This example shows a very good fit between gsand the stomatal index, and was
selected from the database of Lin et al. (2015). The solid line is the regression line, and the shaded area is the 95% confidence interval for the mean. (b) The
correlation between the estimated slope (g1) and intercept (g0) of the regression shown in (a). The dotted ellipse is a bivariate 95% confidence interval for slope
and intercept. The symbols represent 1000 bootstrap samples of the coefficients.
0.0 0.2 0.4 0.6 0.8 1.0 −100 0 100 200 300 R2 g0 ( mmol m −2 s −1 ) Lin et al. (2015) (a) 0.0 0.2 0.4 0.6 0.8 1.0 −100 0 100 200 300 R2 g0 ( mmol m −2 s −1) Miner et al. (2017) (b) 0.2 0.4 0.6 0.8 01 0 20 30 40 50 60 CV of An(Ca D) SE of g0 ( mmol m −2 s −1 ) (c)
Fig. 8 Statistical uncertainty in the estimation of g0from regression, demonstrated with two parameter databases. (a) We fitted the linearized form of the
Medlyn et al. (2011) model to each of the datasets in the Lin et al. (2015) leaf gas exchange database, showing that, for poorly fitted relationships (low R2),
inflated estimates of g0are obtained. Vertical lines are 95% confidence intervals. The gray line is a fitted loess smoother with 95% confidence interval. Note the
wide confidence intervals and frequent negative values. (b) Similar to (a), but using the published compilation by Miner et al. (2017). The gray line is a fitted loess
smoother with 95% confidence interval. (c) Using the fits from (a), a demonstration that the standard error (SE) of g0is much higher when the coefficient of
Version preprint
5. Towards a new model formulation
We suggest that the minimum conductance in the Ball–Berry model should include both ag0and agminterm, asg0represents the
minimum reached during low light and conditions of low photosynthesis, andgminrepresents the minimum reached during
severe drought. Moreover, we suggest that the minimum conduc-tance is not simply added to the photosynthesis-dependent term (right-hand side of Eqn 1), but used as an actual minimum. Thus:
gs¼ max max gðmin;g0Þ; g1An
Ca
fðDÞ
! "
Eqn 4
This model for gs will converge to g0 during periods of low
photosynthesis, and to gmin during drought, if we further
include a model for the dependence ofg0 on water availability
(see, for example, Misson et al., 2004) – as long as the right-hand term (including g1) is reduced under drought as well
(Zhou et al., 2013). Another advantage is that independent estimates of g0 can be used, not those obtained via regression,
which produces the undesirable correlation with estimates ofg1.
The above formulation is yet to be tested against data, but we propose that this test should be performed with data from drought and nondrought conditions.
VII. Conclusions
In a pioneering publication on stomatal conductance, Jarvis (1976) stated that ‘we have assumed in the following equations that when stomata are closed the leaf conductance is zero because field data are generally inadequate to define a cuticular conductance’. Similarly, given the poor statistical properties ofg0estimated from regression,
we conclude thatg0should not be estimated from regression on leaf
gas exchange data for use in models. Then, how should g0 be
estimated? It is clear from our review and synthesis of available data that there is no single minimum conductance. Leaves maintain much highergdark(itself an actively controlled process) than the
minimum conductance measured on intact detached leaves. Thus, when modeling night-time or low-light conductance, a differentg0
should be used than when modeling the drought response of plants. We suggest a new model form that includes bothg0andgminwith
some desirable properties in Section VI.
Finally, we conclude that gmin displays a large amount of
variation among species that could not be explained by traits, and remarkable plasticity to growing conditions. Perhaps this plasticity is the reason thatgmindoes not vary predictably among species.
Another possibility is that the lack of standardized methods for measurement preclude clear comparisons among species. Future studies should comparegminon many species grown in the same
conditions to better understand the adaptive value of the minimum water loss rate of leaves.
Acknowledgements
This work was made possible by the ARC Linkage Project LP140100232. R.L. was supported by a Marie Curie fellowship
(FP7-IOF 624473). All raw data, code and a fully reproducible workflow which generated the figures, the manuscript and all analyses are available at https://www.github.com/remkoduursma/ g0paper, archived at Zenodo (doi: 10.5281/zenodo.1313588).
ORCID
Remko A. Duursma http://orcid.org/0000-0002-8499-5580 Rosana Lop!ez http://orcid.org/0000-0003-3553-9148 Nicolas K. Martin-StPaul http://orcid.org/0000-0001-7574-0108
Herv!e Cochard http://orcid.org/0000-0002-2727-7072 Belinda E. Medlyn http://orcid.org/0000-0001-5728-9827
References
Anfodillo T, Bisceglie DPD, Urso T. 2002. Minimum cuticular conductance and
cuticle features ofPicea abies and Pinus cembra needles along an altitudinal
gradient in the Dolomites (NE Italian Alps).Tree Physiology 22: 479–487.
Arnold AE, Engelbrecht BM. 2007. Fungal endophytes nearly double minimum
leaf conductance in seedlings of a neotropical tree species.Journal of Tropical
Ecology 23: 369–372.
Baker EA, Hunt GM. 1986. Erosion of waxes from leaf surfaces by simulated rain. New Phytologist 102: 161–173.
Baldocchi D. 1997. Measuring and modelling carbon dioxide and water vapour exchange over a temperate broad-leaved forest during the 1995 summer drought. Plant, Cell & Environment 20: 1108–1122.
Ball JT, Woodrow I, Berry JA. 1987. A model predicting stomatal conductance and its contribution to the control of photosynthesis under different environmental
conditions. In: Biggins J, ed.Progress in photosynthesis research. Dordrecht, the
Netherlands: Martinus-Nijhoff Publishers, 221–224.
Barbour MM, Buckley TN. 2007. The stomatal response to evaporative demand
persists at night inRicinus communis plants with high nocturnal conductance.
Plant, Cell & Environment 30: 711–721.
Barnard DM, Bauerle WL. 2013. The implications of minimum stomatal
conductance on modeling water flux in forest canopies.Journal of Geophysical
Research: Biogeosciences 118: 1322–1333.
Becker BJ, Wu M-J. 2007. The synthesis of regression slopes in meta-analysis. Statistical Science 22: 414–429.
Bengtson C, Larsson S, Liljenberg C. 1978. Effects of water stress on cuticular transpiration rate and amount and composition of epicuticular wax in seedlings of
six oat varieties.Physiologia Plantarum 44: 319–324.
Bi H, Kovalchuk N, Langridge P, Tricker PJ, Lopato S, Borisjuk N. 2017. The
impact of drought on wheat leaf cuticle properties.BMC Plant Biology 17: 85.
Blackman CJ, Jordan GJ, Wiltshire RJE. 2005. Leaf gigantism in coastal areas: morphological and physiological variation in four species on the Tasman
Peninsula, Tasmania.Australian Journal of Botany 53: 91–100.
Blackman CJ, Pfautsch S, Choat B, Delzon S, Gleason SM, Duursma RA. 2016. Toward an index of desiccation time to tree mortality under drought.Plant, Cell & Environment 39: 2342–2345.
Boyce RL, Friedland AJ, Vostral CB, Perkins TD. 2003. Effects of a major ice storm
on the foliage of four New England conifers.Ecoscience 10: 342–350.
Boyer JS. 2015. Turgor and the transport of CO2and water across the cuticle
(epidermis) of leaves.Journal of Experimental Botany 66: 2625–2633.
Boyer J, Wong S, Farquhar G. 1997. CO2and water vapor exchange
across leaf cuticle (epidermis) at various water potentials.Plant Physiology
114: 185.
Brodribb TJ, McAdam SAM, Jordan GJ, Martins SCV. 2014. Conifer species adapt to low-rainfall climates by following one of two divergent pathways. Proceedings of the National Academy of Sciences, USA 111: 14489–14493.
Buckley TN. 2005. The control of stomata by water balance.New Phytologist 168:
Version preprint
Burghardt M, Riederer M. 2006. Cuticular transpiration. In: Riederer M, M€uller C,
eds.Biology of the plant cuticle, vol. 23. Oxford, UK: Blackwell Publishing, 292–
311.
Caird MA, Richards JH, Donovan LA. 2007. Nighttime stomatal conductance and
transpiration in C3and C4plants.Plant Physiology 143: 4–10.
Cavender-Bares J, Sack L, Savage J. 2007. Atmospheric and soil drought reduce
nocturnal conductance in live oaks.Tree Physiology 27: 611–620.
Collatz G, Ribas-Carbo M, Berry J. 1992. Coupled photosynthesis-stomatal
conductance model for leaves of C4plants.Functional Plant Biology 19: 519–538.
Coupel-Ledru A, Lebon E, Christophe A, Gallo A, Gago P, Pantin F, Doligez A, Simonneau T. 2016. Reduced nighttime transpiration is a relevant breeding
target for high water-use efficiency in grapevine.Proceedings of the National
Academy of Sciences, USA 113: 8963–8968.
Cowan I. 1978. Stomatal behaviour and environment.Advances in Botanical
Research 4: 117–228.
Cowan I, Farquhar GD. 1977. Stomatal function in relation to leaf metabolism and
environment. In: Jennings D, ed.Integration of activity in the higher plant.
Cambridge, UK: Cambridge University Press, 471–505.
Damour G, Simonneau T, Cochard H, Urban L. 2010. An overview of models of
stomatal conductance at the leaf level.Plant, Cell & Environment 33: 1419–1438.
De Kauwe MG, Kala J, Lin Y-S, Pitman AJ, Medlyn BE, Duursma RA, Abramowitz G, Wang Y-P, Miralles DG. 2015. A test of an optimal stomatal
conductance scheme within the CABLE land surface model.Geoscientific Model
Development 8: 431–452.
DeLucia EH, Berlyn GP. 1984. The effect of increasing elevation on leaf cuticle
thickness and cuticular transpiration in balsam fir.Canadian Journal of Botany
62: 2423–2431.
Dewar R, Mauranen A, M€akel€a A, H€oltt€a T, Medlyn B, Vesala T. 2018. New
insights into the covariation of stomatal, mesophyll and hydraulic conductances from optimization models incorporating nonstomatal limitations to
photosynthesis.New Phytologist 217: 571–585.
Drake JE, Tjoelker MG, V$arhammar A, Medlyn BE, Reich PB, Leigh A, Pfautsch
S, Blackman CJ, L!opez R, Aspinwall MJet al. 2018. Trees tolerate an extreme
heatwave via sustained transpirational cooling and increased leaf thermal
tolerance.Global Change Biology 24: 2390–2402.
Duarte AG, Katata G, Hoshika Y, Hossain M, Kreuzwieser J, Arneth A, Ruehr NK. 2016. Immediate and potential long-term effects of consecutive heat waves on the
photosynthetic performance and water balance in Douglas-fir.Journal of Plant
Physiology 205: 57–66.
Duursma RA. 2015.Plantecophys – an R package for analysing and modelling leaf
gas exchange data.PLoS ONE 10: e0143346.
Duursma RA, Barton CVM, Lin Y-S, Medlyn BE, Eamus D, Tissue DT, Ellsworth DS, McMurtrie RE. 2014. The peaked response of transpiration rate to vapour pressure deficit in field conditions can be explained by the temperature optimum
of photosynthesis.Agricultural and Forest Meteorology 189–190: 2–10.
Eamus D, Taylor DT, Macinnis-Ng CMO, Shanahan S, De Silva L. 2008. Comparing model predictions and experimental data for the response of stomatal conductance and guard cell turgor to manipulations of cuticular conductance, leaf-to-air vapour pressure difference and temperature: feedback mechanisms are
able to account for all observations.Plant, Cell & Environment 31: 269–277.
Egea G, Verhoef A, Vidale PL. 2011. Towards an improved and more flexible representation of water stress in coupled photosynthesis-stomatal conductance
models.Agricultural and Forest Meteorology 151: 1370–1384.
Fanourakis D, Heuvelink E, Carvalho SM. 2013. A comprehensive analysis of the physiological and anatomical components involved in higher water loss rates after
leaf development at high humidity.Journal of Plant Physiology 170: 890–898.
Fern!andez V, Bahamonde HA, Javier Peguero-Pina J, Gil-Pelegr~a E, Sancho-Knapik D, Gil L, Goldbach HE, Eichert T. 2017. Physico-chemical properties of
plant cuticles and their functional and ecological significance.Journal of
Experimental Botany 68: 5293–5306.
van Gardingen PR, Grace J, Jeffree CE. 1991. Abrasive damage by wind to the
needle surfaces ofPicea sitchensis (Bong.) Carr. and Pinus sylvestris L. Plant, Cell &
Environment 14: 185–193.
Gleason SM, Blackman CJ, Cook AM, Laws CA, Westoby M. 2014. Whole-plant capacitance, embolism resistance and slow transpiration rates all contribute to
longer desiccation times in woody angiosperms from arid and wet habitats.Tree
Physiology 34: 275–284.
Grace J. 1974. The effect of wind on grasses 1. Cuticular a stomatal transpiration. Journal of Experimental Botany 25: 542–551.
Hadley JL, Smith WK. 1983. Influence of wind exposure on needle desiccation and
mortality for timberline conifers in Wyoming, U.S.A.Arctic and Alpine Research
15: 127–135.
Hanson DT, Stutz SS, Boyer JS. 2016. Why small fluxes matter: the case and approaches for improving measurements of photosynthesis and (photo)
respiration.Journal of Experimental Botany 67: 3027–3039.
Hari P, M€akel€a A, Berninger F, Pohja T. 1999. Field evidence for the optimality
hypothesis of gas exchange in plants.Australian Journal of Plant Physiology 26:
239.
Hari P, M€akel€a A, Korpilahti E, Holmberg M. 1986. Optimal control of gas
exchange.Tree Physiology 2: 169–175.
Hauke V, Schreiber L. 1998. Ontogenetic and seasonal development of wax composition and cuticular transpiration of ivy (Hedera helix L.) sun and shade
leaves.Planta 207: 67–75.
Heinsoo K, Koppel A. 1998. Minimum epidermal conductance of Norway spruce (Picea abies) needles: influence of age and shoot position in the crown. Annales Botanici Fennici 35: 257–262.
Heroult A, Lin Y-S, Bourne A, Medlyn BE, Ellsworth DS. 2013. Optimal stomatal
conductance in relation to photosynthesis in climatically contrastingEucalyptus
species under drought.Plant, Cell & Environment 36: 262–274.
Herrick GT, Friedland AJ. 1991. Winter desiccation and injury of subalpine red
spruce.Tree Physiology 8: 23–36.
Hygen G. 1951. Studies in plant transpiration I.Physiologia Plantarum 4: 57–183.
Hygen G, Midgaard E. 1954. A reinvestigation of the influence of varying air
humidity on cuticular transpiration inPinus sylvestris L. Physiologia Plantarum 7:
128–140.
James AT, Lawn RJ, Cooper M. 2008. Genotypic variation for drought stress
response traits in soybean. I. Variation in soybean and wildGlycine spp. for
epidermal conductance, osmotic potential, and relative water content.Australian
Journal of Agricultural Research 59: 656–669.
Jarvis PG. 1976. The interpretation of the variations in leaf water potential and
stomatal conductance found in canopies in the field.Philosophical Transactions of
the Royal Society of London. Series B, Biological Sciences 273: 593–610. Jordan GJ, Brodribb TJ. 2007. Incontinence in aging leaves: deteriorating water
relations with leaf age inAgastachys odorata (Proteaceae), a shrub with very
long-lived leaves.Functional Plant Biology 34: 918–924.
Kala J, Kauwe MGD, Pitman AJ, Medlyn BE, Wang Y-P, Lorenz R, Perkins-Kirkpatrick SE. 2016. Impact of the representation of stomatal conductance on
model projections of heatwave intensity.Scientific Reports 6: 23418.
Kerstiens G. 1996a. Cuticular water permeability and its physiological significance. Journal of Experimental Botany 47: 1813–1832.
Kerstiens G. 1996b. Signalling across the divide: a wider perspective of cuticular
structure–function relationships.Trends in Plant Science 1: 125–129.
Kerstiens G. 2006. Water transport in plant cuticles: an update.Journal of
Experimental Botany 57: 2493–2499.
K€orner C. 1994. Leaf diffusive conductances in the major vegetation types of the
globe. In: Schulze PDE-D, Caldwell PDMM, eds.Ecophysiology of photosynthesis.
Berlin/Heidelberg, Germany: Springer, 463–490.
Leuning R. 1990. Modelling stomatal behaviour and photosynthesis ofEucalyptus
grandis. Australian Journal of Plant Physiology 17: 159–175.
Leuning R. 1995. A critical appraisal of a combined stomatal-photosynthesis model
for C3plants.Plant, Cell & Environment 18: 339–355.
Lin Y-S, Medlyn BE, Duursma RA, Prentice IC, Wang H, Baig S, Eamus D, de
Dios VR, Mitchell P, Ellsworth DSet al. 2015. Optimal stomatal behaviour
around the world.Nature Climate Change 5: 459–464.
Lombardozzi DL, Zeppel MJB, Fisher RA, Tawfik A. 2017. Representing nighttime and minimum conductance in CLM4.5: global hydrology and carbon
sensitivity analysis using observational constraints.Geoscientific Model
Development 10: 321–331.
Mackov!a J, Va#skov!a M, Macek P, Hronkov!a M, Schreiber L, #Santru#cek J. 2013.
Plant response to drought stress simulated by ABA application: changes in chemical composition of cuticular waxes.Environmental and Experimental Botany 86: 70–75.
Manzoni S, Vico G, Katul G, Fay PA, Polley W, Palmroth S, Porporato A. 2011. Optimizing stomatal conductance for maximum carbon gain under water stress: a