Publisher’s version / Version de l'éditeur:
Magazine of Concrete Research, 17, 50, pp. 5-14, 1965-07-01
READ THESE TERMS AND CONDITIONS CAREFULLY BEFORE USING THIS WEBSITE.
https://nrc-publications.canada.ca/eng/copyright
Vous avez des questions? Nous pouvons vous aider. Pour communiquer directement avec un auteur, consultez la première page de la revue dans laquelle son article a été publié afin de trouver ses coordonnées. Si vous n’arrivez pas à les repérer, communiquez avec nous à PublicationsArchive-ArchivesPublications@nrc-cnrc.gc.ca.
Questions? Contact the NRC Publications Archive team at
PublicationsArchive-ArchivesPublications@nrc-cnrc.gc.ca. If you wish to email the authors directly, please see the first page of the publication for their contact information.
NRC Publications Archive
Archives des publications du CNRC
This publication could be one of several versions: author’s original, accepted manuscript or the publisher’s version. / La version de cette publication peut être l’une des suivantes : la version prépublication de l’auteur, la version acceptée du manuscrit ou la version de l’éditeur.
For the publisher’s version, please access the DOI link below./ Pour consulter la version de l’éditeur, utilisez le lien DOI ci-dessous.
https://doi.org/10.1680/macr.1965.17.50.5
Access and use of this website and the material on it are subject to the Terms and Conditions set forth at
Changes in weight and dimensions in the drying and carbonation of
Portland cement mortars
Kamimura, K.; Sereda, P. J.; Swenson, E. G.
https://publications-cnrc.canada.ca/fra/droits
L’accès à ce site Web et l’utilisation de son contenu sont assujettis aux conditions présentées dans le site
LISEZ CES CONDITIONS ATTENTIVEMENT AVANT D’UTILISER CE SITE WEB.
NRC Publications Record / Notice d'Archives des publications de CNRC:
https://nrc-publications.canada.ca/eng/view/object/?id=74381548-9a23-41d2-9453-5cee1f519241 https://publications-cnrc.canada.ca/fra/voir/objet/?id=74381548-9a23-41d2-9453-5cee1f519241
I N N21r2 no.
265
c . 2T I O N A L R E S E A R C H C O U N C I L
ANALYZED
BLDGY
A D A
1 1C U N S E I L N A T I O N A L D E R E C H E R C H E S
Changes in weigh
dimensions in he drying and
carbonation o Portland
cement mortars
by
K. Kamimura, P.
J.
Sereda and
E.
G.
Swenson
Reprinted from
Magazine of Concrete Research,
Vol. 17, No. 50, March 1965, p.5-14
Research Paper No. 265
of the
Division of Building Research
BUILDING RESEARCH
Variations de poids et de dimensions
des mortiers de ciment Portland
produites par le sCchage et la
carbonatation
Sommaire
De petits spkcimens de mortier et de p2te (traitks
durant 28 jours) de permkabilitP et de compressi-
bilitk varikes oot ktk skchks avec carbonatation
subskquente ou simultanke, ci dlffkrents degrb
d'humiditk relative allant de 100 ci 0%.&n--a
ensuite skchk les spkcimens Pquilibrks afin ze faire disparaitre I'eau kvaporable, puis on les'a saturks de nouveau et skchks une autre fois pour dkter- miner la diffkrence des rkactions pour ce qui est des variations de longueur et de poids, et de la
teneur en CO,. Quand ils n'ktaient pas soumis ci
/'action du CO,, les spkcimens saturb, gardks duns une humiditk relative de 50%, laissaient kclzapper un minimum d'eau non-kvaporable et subissaient un retrait maximum en comparaison des spkcimens
PquilibrPs ci d'autres degrPs d'humiditk relative.
Soumis ci une carbotzatation subskquente, ces
spkcimens ont subi un retrait de carbonatation maximum pr2s de deux fois supkrieur au retrait
dii d l'kvaporation de l'eau. A 100
%
et de 25 ci 0%
d'llurniditk relative, la carbotzatation n'a pas provoquk de variation de volume importante. L'action maximum de la carbonatation s'est
manifestke chez les spPci ens Pquilibrks ci une
humiditk relative de 75
X . 6
gknkral, les rksultatsde la carbonatation, pour une corzcentration donnke de CO,, dkpendent de la permkabilitk, de la teneur en humiditk et du temps, mais l'importance du
retrait dG ci la carbonatation et la constance finale
du volume dkpetzdent de la compressibilitk des agrkgats, du rapport eau-ciment, de la maturiti de la pite, du milieu ambiant et de la vitesse du skcllage, et des skquences de skcllage et de car- bonatation. L'auteur note quelques implications pratiques de ces rksultats.
Changes
R E P R I N T E D F R O M M A G A Z I N E O F C O N C R E T E R E S E A R C H . VOL. 1 7 , No. 50. M A R C H 1965. p p . 5-14.ANALYZED
U D C 666.096.2 : 666.97.015weight
MCRPO9
R E P R I N Tand dimensions
the
drying and carbonation of Port and cement
mortars
by
K. Kamimura*,
P ~ . D . ,P. J.
Sereda,
M.SC.and
E.
G.
Swensoi~,
M.SC.N A T I O N A L R E S E A R C H C O U N C I L , C A N A D A : D I V I S I O N O F B U I L D I N G R E S E A R C H
S U M M A R Y
Small specimens of mortar and paste were cured for
28 days and then subjected to various cot~ditiot1s of
drying and carbonation. It1 general the extent o f car-
bonation, for a given CO, concentration, depends up011
permeability, moisture content and time, but the extent of' carbonation shrinkage and ultimate volume stability depend on the compressibility of the aggregate, the ri~aterlcement ratio, the maturity of rhe paste, the drying envir.onment and rate, and on the sequence of drying and carbonutiotl. Some of the practical implications of these results are noted.
Introduction
The significance of carbonation and carbonation shrinkage of Portland cement products has been of special interest to the Division of Building Research in its continuing studies of dimensional change in building materials. In Canada the extremes and vari- ability of climate are conducive to wide changes in relation to humidity and, consequently, to moisture contents in materials. Because both drying shrinkage and carbonation shrinkage increase with decrease in relative humidity over the higher and intermediate ranges of humidity, and because the two effects are additive, the resulting large volume changes can, under certain conditions, lead t o cracking, displacement, warping and related problems. The relative humidity in a heated building in very coid weather has been known to go well below 10%; in spring or summer it may approach 100°/0 in the same building. Concentra- tions of carbon dioxide in heated, non-ventilated rooms can become high.
Field evidence of excessive shrinkage cracking that can be specifically traced to the added influence of *Guest worker with the Inorganic Materials Section, Division of
Building Research, National Research Council, Ottawa, Canada, from the Building Research Institute, Tokyo, Japan.
carbonation is not well defined. This is doubtless due to a failure to recognize that the magnitude of car- bonation shrinkage can approach that of drying shrinkage. The first-named author has, however, ob- served cases in Japan where both cracking and corro- sion of reinforcement in lightweight concrete are believed to be due to carbonation of cement paste.
With dense 'concretes, drying and carbonation shrinkage are both normally small because of the low permeability of the concrete and the low compress- ibility of the aggregate. But over a long period of time the additional shrinkage resulting from carbonation can be critical for certain elements such as thin, pre- stressed units. Crazing of surfaces and warping of beams may also occur through carbonation.
Lightweight concretes are more susceptible to car- bonation and its effects because they are usually more permeable. The problem of shrinkage is further aggra- vated by the higher compressibility of the aggregate. The general irreversibility of changes in volume due to carbonation is beginning t o be applied in the block and brick industry to pre-shrink masonry units by the
" drying-carbonation "
Research on carbonation and its effects on Portland cement paste, mortar and concrete has been summar- ized u p to 1956 by Lea.(4) Subsequent investigations have been reported by V e r b e ~ k ' ~ ) , Leber and B l a k e ~ ' ~ ) , Kroone and B l a k e ~ ' ~ ) , Alexander and Wardlaw's), Hunt and Tomes(g), and Powers(1ot. The present state of knowledge may be briefly summarized as follows. Substantial carbonation occurs even at the low CO, concentrations normally found in the atmosphere. It is not limited to the hydroxides present, but is also associated with other components in the paste. The resulting modification of the cement gel is reflected in certain changes in properties. Except at early ages, strengths are improved. Hardness, impermeability, and volume stability are favourably affected. The most dramatic effect of carbonation, however, is the large
Magazine of Concrete Research : Vol. 17, No. 50 : March 1965
increase in shrinkage under intermediate conditions of T A B L E 1 : Composition of mortars and paste.
relative humidity. Maximum carbonation and car- I
bonation shrinkage occur at about 50% relative Mix
I
AggregateI
ProportionsI
W / C *Below 25%
R.H.
there is some disagreement. Car-bonation shrinkage is a separate phenomenon from drying shrinkage and is superimposed upon the latter.
It is largely irreversible, as compared with shrinkage natural sand
due to loss of water. The size and permeability of the 1 : 4 by weight
specimen and the concentration of CO, are rate- - paste 0.500
-
, " ,humidity (R.H.). Some carbonation but no carbon- 1
ation shrinkage occur at 100% and at 25% R.H.
determining factors. There is considerable evidence that more than one type of carbonation product is formed.
Carbonation appears to be accompanied by a de- crease in the amount of non-evaporable water in the paste. Changes produced by carbonation do not appear to affect the rate of hydration, at least at later ages. Until recently, carbonation shrinkage was usually attributed to water released as the product of the re- action between CO, and hydroxides or hydrates. An hypothesis for the mechanism of carbonation shrink- age based on " dissolution of calcium hydroxide cry-
stals while the crystals are under pressure " has been advanced by P ~ w e r s . " ~ ' Concurrent studies would indicate, however, that less than one mole of water is released per mole of reacted CO, even at early stages of the reaction(g1; this suggests that other mechanisms may also be involved.
The present paper describes an exploratory study of the role played by carbonation in the dimensional changes of Portland cement products. It was designed to reveal general relationships, particularly where dis- agreement exists and where information is lacking. It is intended as a basis for subsequent detailed studies. More specifically, it was desired to obtain equili- brium weight and volume changes over the full range of relative humidity, 1GO to O x , for three main condi- tions: drying in C0,-free air; drying with subsequent carbonation; and drying with simultaneous carbon- ation. To obtain maximum effects, highly permeable mortars were compared with dense mortars and only 100°/, CO, was used for carbonation. Subsequent treatments of drying, re-wetting, and re-drying were designed to reveal relationships between the charac- teristics of the cement paste subjected to the above conditions.
Materials and methods
Two mortars were made with a perlite aggregate and two with natural sand (see Table 1); cement paste was used as a partial reference; and all mixes were made with the same ordinary Portland cement.
Each of the five batches was placed by hand in a 3 x 4x 16 in. mould. After storage in a fog room, the prisms were demoulded and cured in fog at 73°F to the age of 21 days. They were then stored under water for 7 days, during which period they were cut by
1 : 2 by volume
1 : 0.273 by weight
*includes water in aggregate
0.686
diamond saw while wet, to reduce the danger of pre- carbonation. Each prism was cut in half and each end ground to a plane surface into bars 3
x
4x
5 in. Thelatter were cut lengthwise into the final test specimens of three sizes: $ x
+
x
5,i-
x8
x 5, and & x4-
x 5 in. Triplicate specimens for each test condition were selected from the top, middle and bottom of each bar. The larger cross-section was chosen for the main tests, partly for ease in handling and partly because of the success of other investigators with even larger specimens. A range of permeability and compress- ibility was achieved by the two mix proportions and the two aggregates.All conditioning was carried out in large vacuum- type desiccators, the samples being arranged vertically over the respective relative humidity conditioners. Dis- tilled water was used for 100% R.H., and anhydrous magnesium perchlorate and vacuum for 0% R.H. The 75, 50, 25 and 9% R.H. conditions were achieved by sulphuric acid solutions of suitable concentrations. C0,-free air was obtained by injecting air filtered through an absorbent into the evacuated desiccator. Carbonation was effected by attaching a balloon filled with pure CO, to the evacuated desiccator.
A dial gauge extensometer was used to measure lengths to an accuracy of 0.0001 in. Change in length was calculated as a percentage of the original length before the start of conditioning. Weight changes to the oven-dry weight were measured to 0.001 g and calculated as percentage o f " oven-dry weights " at 28 days. The latter were obtained by drying separate 28- day prisms for each of the four mixes at the start of each conditioning period. The drying was at 11 0-1 15OC to constant weight. From the losses in weight thus ob- tained, the " oven-dry weights " of the saturated
prisms to be subjected to the different test conditions were then calculated. Although arbitrary, this was a convenient standard reference. Up to the end of the first stage, i.e. conditioning at each of the six relative humidities, all measurements were made in a room conditioned at 50% R.H. and 73°F. The very short exposure times affected weights and lengths very slightly. For the subsequent treatments of drying in vacuum over magnesium perchlorate, re-saturation,
Changes in weight and dimensions in the drying and carbonation of Portland cement mortars and final drying, all measurements were made in a
" dry box " except for the saturated specimens. Equilibrium was considered to have been reached when the average change in length did not exceed 0.002% and the average weight change did not exceed 0.2% over 14 days. In order t o maintain a reasonably organized programme, however, it was not always possible to fulfil both requirements.
For the C0,-free conditioning and for the drying with simultaneous carbonation, the average time t o reach equilibrium for all relative humidity conditions was 100 days for the mortars and 140 days for the paste. Subsequent carbonation required an average of 65 days. The first drying over magnesium perchlorate in vacuum required 75 days, re-saturation 30 days, and final drying 45 days. Re-saturation consisted of soak- ing in water t o constant weight. At the end of this period the prisms were, one at a time, surface-blotted to remove surface water and quickly weighed.
The amounts of CO, in the test specimens at the end of the last drying stage were determined by a standard method of direct chemical analysis. Hydrochloric acid was used for decomposition and a n absorbent t o col- lect the evolved gas."" Determinations were made in the C02-free samples as well, because some pre-car- bonation had occurred in all samples during fabrica- tion and curing. Corrections were made where neces- sary.
The cement paste specimens were only carried through the drying and carbonation stages before final drying, without the subsequent re-drying and satur- ation. The high concentration of CO, and the den- sity of the paste evidently caused the development of stress gradients that resulted in early cracking of some of the more highly carbonated samples.
In addition t o the standard 28-day samples, some were cured for 3 months and subjected to the same conditions. This was also done for the smaller speci- mens t o check the effect of size.
Results and discussion
E Q U I L I B R I U M S H R I N K A G E A N D W E I G H T C H A N G E S I N F I R S T S T A G E
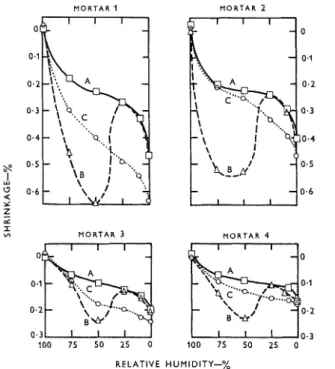
Values of equilibrium shrinkage for the four mor- tars cured for 28 days are plotted in Figure 1. The corresponding weight changes for mortars 1 and 3 are plotted in Figure 2 ; the others, including the paste, are similar in form. The individual data are too volum- inous to be recorded in this paper.
Curves A are those for C0,-free drying, curves B for drying with subsequent carbonation, and curves C for drying with simultaneous carbonation. It is important t o recognize that curves B and C are different from the normal isotherm type.(4) In these experiments each point represents the average equi- librium value on triplicate specimens dried and/or carbonated from the original starting condition. The
M O R T A R 1 M O R T A R 2
M O R T A R 3 M O R T A R 4
R E L A T I V E H U M I D I T Y - %
Figure 1: Relations between equilibrium shrinkage and relative
humidity for mortars. A=drying in C02-free air ; B=dryit~g with
subsequent carbonation; C = drying with s~rnrrltaneo~ts carbonation.
curves d o not represent reversible states corresponding t o changing conditions from high t o low relative humidity.
C0,-free drying
Curves A in Figure 1 are similar t o the desorption isotherms obtained for Portland cement paste and other porous materials that have a common charac- teristic of shrinking progressively as they lose evapor- able water. Another way of expressing this result is shown in Figure 4 where the shrinkage is plotted against moisture content. This curve shows clearly the three regions M-N, N - 0 and 0 - P which have been described and explained.""
In comparing the curves A in Figure 1, it may be noted that the slopes are influenced by the compress- ibility of the material, which, in turn, depends o n the nature of the aggregate, the waterlcement ratio, and the cement content. The apparent expansion at 100% R.H. is, of course, due to the arbitrary starting point. T h e changes in weight in C0,-free drying follow the normal pattern (see curves A in Figure 2).
Drying
with
subsequent carbonation
In Figure 1, curves B for this system show that the greatest total shrinkage (drying t o equilibrium fAllowed by carbonation t o equilibrium) occurs be- tween 75 and 50% R.H., with the maximum at about 50% R.H. At 25% R.H. the total shrinkage is essen- tially the same as for water-loss shrinkage, indicating
M ~ g a z i n e of Concrete Researclz : Vol. 17, N o . 50 : March 1965
M O R T A R 1 M O R T A R 2
RELATIVE HUMIDITY-%
Figlire 2: Relatiot~s l~etweetl eqlrilibriutn weight change and
relative l~lrmidity for mortars I and 3. A=drying in C0,-free air;
B=drying with slrbseqlrent carbonofion ; C=dryittg with sinl-
irltaneoris corbot~ation.
that no carbonation shrinkage has occurred. This agrees with Verbeck's findings'j), but it is contrary to results obtained by Alexander and ward la^'^). Below 2544 R.H., the tendency for curves A and B t o diverge slightly was at first attributed to experimental error, but this apparent anomaly (tendency to some shrinkage below 25% R.H. as against no shrinkage at 25% R.H.) occurred repeatedly throughout changes in weight and volume in the subsequent stages of treat- ment as well. In any event, the zero or nearly zero carbonation shrinkage from 25 to 0% R.H. is con- trary t o the results of Alexander and Wardlaw; Verbeck did not report for this range.
It may be noted that the maximum shrinkage due to carbonation alone was nearly double that of the water- loss shrinkage in mortar 1, and that it was about one- and-a-half times as great in the other three mortars; for the paste it was twice as great. These differences can be attributed to the differences in compressibility of the materials as they are influenced by type of aggregate, waterlcement ratio and cement content.
In Figure 2 the curves of weight change for drying with subsequent carbonation (B) show a maximum divergence from those for C0,-free drying (A) in the range of 75 t o 50% R.H.
Figure 3 shows more clearly the actual shrinkages and weight gains due to carbonation alone. The points represent the difference between the values given in curves A and B. For carbonation after drying. (B-A) the maximum carbonation shrinkage occurred at 50% R.H. for all mixes except mortar 2, the most porous material, where the maximum occurred at about 62% R.H. The very high compressibility of this material may have been responsible for the shift.
The net weight gains from carbonation alone, also shown as B-A curves in the lower part of Figure 3, yield maxima at 70, 65, 50 and 63% R.H. in order of mix number. In the paste samples, the maximum
M O R T A R 1 M O R T A R 2 d 5 M O R T A R 3 M O R T A R 4 RELATIVE HUMIDITY-O/, M O R T A R 1 2 5 C-A '\ 15 10 B A M O R T A R 3 M O R T A R 2 B A M O R T A R 4 RELATIVE HUMIDITY-%
Figlire 3: Equilibrilmz shrinkage and weigl~t goin due t o
cnrbonofion only. B - X = after drying ; C - A =
sinwrltaneous with drying.
occurred at 50% R.H. However, two of.the triplicate paste specimens cracked, owing t o the stress gradients developed for this low-porosity material.
Thus, generally, the maximum carbonation in- creases with increasing permeability. It may therefore be concluded that when COZ can penetrate freely, maximum weight gains due to carbonation occur at a higher relative humidity (or moisture content) than the maximum carbonation shrinkage. Figure 3 also shows that considerable carbonation occurred at 100% R.H. for the porous mortar 2, but this decreased t o prac- tically zero for the low-porosity mortar 3. Some car- bonation occurred between 25 and 0% R.H.
In this system it would appear that carbonation proceeds more rapidly and extensively at about 75% R.H. than at 50q/, R.H., possibly because more solu- tion is present t o facilitate reaction o r because of a difference in the product of the reaction. At 50% R.H., however, it would appear that the greater tension i n the capillary water, with resulting higher forces i n the
Changes in eight arid dimensions in the drying arld carbonation of Portland cement mortars material, produces a greater shrinkage per unit of R E S P O N S E O F S P E C I M E N S T O
carbonation product. Evidently the carbonation pro- S U B S E Q U E N T D R Y 1 N G A N D W E T T I N G duct a t 1000/,, a t 25%, a n d a t lower relative humidities It was of interest t o observe t h e effect of subjecting
is not conducive t o shrinkage. specimens t h a t had reached the equilibrium states des-
Drying with simultar~eous carborzation
In Figure 1, curves C for this condition show a n increasing divergence from curves A (C0,-free) a s t h e relative humidity decreases t o a b o u t 25%. Because carbonation is acconlpanied by a release of water for at least a major part of the reaction a n d because time is required t o extract water by drying, it is evident t h a t the internal relative humidity of the sample will, at any given time, be higher than the ambient relative humidity. This accounts for the fact t h a t maximum carbonation shrinkage occurs at a b o u t 25% R.H. (ambient) rather t h a n a t 50°/, R.H. as it does for subsequent carbonation.
In Figure 3 it may be noted that the maximum car- bonation shrinkage d u e t o simultaneous drying and carbonation (C-A) is a b o u t one-half t o one-third of that resulting from drying with subsequent carbona- tion (B-A). Evidently, carbonation of the paste a t very high humidities, possibly as high as go?,, confers some degree of volume stability that is retained throughout the lower humidity levels. It would a p p e a r that the more sensitive paste characteristics that obtain a t 50% R.H. a r e not achieved in this system.
Below ambient 25% R.H., carbonation shrinkage decreases progressively a s the internal relative humid- ity approaches the " insensitive " condition a t 25%
R.H.
T h e changes in weight for simultaneous drying a n d carbonation, as illustrated by curves C in Figure 2, also show a divergence from curves A (C0,-free), but t h e maximum is a t a b o u t 50°/;, R . H . With the same reasoning a s before, this maximum would corres- pond t o s o m e higher internal relative humidity, in all probability'to the maximum of a b o u t 75% found in drying with subsequent carbonation. There is, tliere- fore, a n agreement in behaviour for both methods of carbonation a s t o both shrinkage a n d weight gain maxima.
Figure 3 shows that the extent of carbonation a t the
maxima is, in general, greater for sin~ultaneous drying
a n d carbonation than for carbonation after drying. T h i s suggests t h a t m o r e extensive reaction occurs a t the higher relative humidities, o r t h a t a different pro- duct is formed. T h e increase in carbonation below 25% R.H. is a n apparent anomaly, as for the shrinkage referred t o previously.
T h e paste samples subjected t o drying with simul- taneous carbonation behaved similarly t o the mortars. But t h e three specimens conditioned a t 50% R.H. cracked at 19 days; this was evidently due t o the development of a high stress differential d u e t o very rapid carbonation a t the surface under these condi- tions.
cribed above t o three successive treatments: drying in vacuum over magnesium perchlorate, re-saturation, a n d drying again. T h e t w o stages of drying were in- tended t o remove evaporable water.
These treatments were not designed t o simulate normal cycling, but rather t o reveal differences in response of those specimens t h a t had presumably reached different levels of compressive stress. Volume stability conferred by cycling is considered as well- e ~ t a b l i s h e d " . ~ ) a n d was not a part of the study.
A, fter C0,- free conditiorling
T h e results of this stage of the work have not been included in this paper because o f shortage o f space. It should be pointed out, however, t h a t samples con- ditioned a n d stored a t a b o u t 50% R.H. showed a different physical response t o subsequent changes in conditions from that of samples conditioned a n d stored a t other levels of relative humidity. It follows t h a t samples conditioned near 50% R.H. should have a different sensitivity t o volunle change if some secon- dary reaction is involved, o r where external load is applied a s in creep. Powers has referred t o this a t
various times.(lO) This region of highest sensitivity may
extend above o r below 50% R.H.; the present d a t a are t o o sparse t o define the limits accurately.
A n investigation reported by Hunt, T o m e s a n d Blaine brings o u t concepts consistent with the above findings.(13)
A,fter ~lr-ving
arm' subsequent carbonatior~
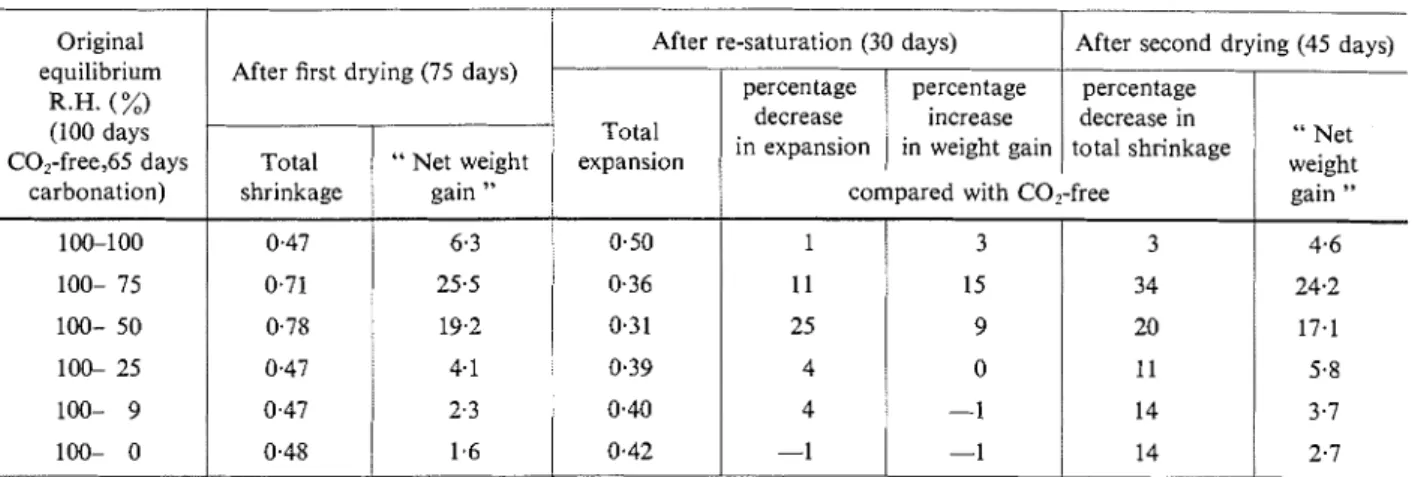
T h e three steps of drying, re-saturation a n d final drying were also carried o u t o n specimens previously subjected t o drying and subsequent carbonation. T h e results for mortar 1 are given in Table 2. With the minor exceptions noted, the other three mortars showed the same behaviour. It is t o be noted t h a t the effect of the original relative humidity of conditioning enters into the following results mainly by virtue of its effect o n the extent of carbonation. Nevertheless, some interesting trends can be observed.
O n first drying, a maximum in total shrinkage oc- curs for samples previously carbonated a t 50% R.H., with the 75% R.H. samples near the maximum (Table 2 , column 2). Corresponding maxima in " net weight
gain
"*
d u e t o carbonation occurred for the 75% R.H. specimens, with 50% R . H . sanlples near this max- imum (column 3). T h e condition for maximum car-*In the following, the term " net weight gain " is used because the net weight changes of the " oven-dry weight " are positive with respect t o t h e original " oven-dry weights " o n which they
Magazine of Cotzcrete Research : Vol. 17, NO. 50 : March 1965
T A B L E 2 : Changes in length and weight of specimens of mortar 1 after drying with subsequent carbonation.
N O T E S : Drying in vacuum over anhydrous magnesium perchlorate. Shrinkage is expressed as a percentage of the original saturated
condition (28-day curing). The gain in oven-dry weight is given as a percentage of the oven-dry weight after 28 days curing. Negative values indicate expansion or loss in weight.
bonation does not, therefore, correspond to the condi- tion for maximum shrinkage.
O n re-saturation, expansion was at a minimum for those specimens previously carbonated at 50% R.H. (column 4). This evidence of volume stability is shown as percentage decrease in expansion as compared with the C0,-free condition (column 5). The actual values in order of mortar numbers were: 25,35,38 and 32%. The corresponding increase in weight gain on re- saturation (column 6) yields a maximum for the samples previously carbonated at 75% R.H. (in mor- tar 3 at 50% R.H.).
O n final drying, the percentage decrease in total shrinkage, compared with the C0,-free samples, yield- ed maxima for specimens previously carbonated at 75% R.H., the values for the mortars being, in order, 34, 48, 30 and 46%. This may be taken as an indirect measure of the improvement in volume stability con- ferred by carbonation.
In comparing columns 8 and 3, it may be noted that the " net weight gain " at the maximum is less at the
final drying than at the first drying. This is in contrast t o the small " net weight gains " for the samples pre-
viously conditioned at the higher and lower humid- ities. If the hydration gains with time are taken into account, this considerable net loss at the maxima may be attributed, at least in part, t o continued reduction in chemically combined water.(g) It may also be a result of some change in the nature of the carbonation product; Kroone and Blakey found different degrees of stability in such product^.'^)
I t may be recalled that a mild controversy exists as t o whether, on desorption, the last menisci disappear
af 45% R.H.(lO) or at 31% R.H.(12). T h e indirect and presumptive evidence in the present study favours the latter. Plots of total shrinkage against weight loss for both drying with subsequent carbonation and drying with simultaneous carbonation yield two distinct
Original equilibrium R.H. (%) (100 days C0,-free,65 days carbonation) 100-1 00 100- 75 100- 50 100- 25 100- 9 100- 0
Figure 4: Eqrrilibri~m~ relations between sl~rinkage and moistlrre
content under COz-free conditions for mortar I .
After re-saturation (30 days) After first drying (75 days)
0 0.1 0.2 0 . 3 0 . 4 0.5
curves with junctions nearer the 31% R.H. value (recall Figure 4).
expansion
After second drying (45 days)
Total shrinkage 0.47 0.71 0.78 0.47 0.47 0.48 1 I I I I I I I I
-
-
-
-
-
-
-
-
-
Figurer indicate-
relative humidity (%) I 1 1 I I I I I I . 45 40 35 30 25 20 15 10 5 0Ajter drying with simultaneous carbonation
0.50 0.36 0.3 1 0.39 0.40 0.42 percentage decrease in total shrinkage " Net weight gain " 6.3 25.5 19.2 4.1 2.3 1.6 MOISTURE CONTENT-%Results for this conditioning are not reported; they yielded maxima and minima of shrinkage and weight gain corresponding closely t o those above. I n com- parison with the results on the C0,-free specimens, the percentage decrease in total shrinkage a t the maxima was somewhat greater for simultaneous than for subsequent carbonation; this was also true for
" net weight gain
".
Since simultaneously dried andpercentage decrease in expansion " Net weight percentage increase in weight gain gain " 4.6 24.2 17.1 5.8 3.7 2.7 compared with C0,-free
I 11 25 4 4 -1 3 15 9 0 -1 -1 3 34 20 1 I 14 14
Changes in weight and dimensions in the drying and carbonation of Portland cement mortars carbonated mortar contains more moisture during T A B L E 3 : Comparison of
"
net weight gains"
carbonation than pre-conditioned material, the opti- with actual CO, gains for specimens of mortar 1
mum condition for maximum carbonation may be dried with subsequent carbonation.
even higher than 75% R.H. or carbonate products at high humidities may be different from those at lower
humidities. The results also showed that carbonation R.H, second
at the high humidities (during the early drying in this
series) conferred considerable volu~ne stability on the ( %) ( %)
mortars.
100
In this series very extensive carbonation occurred
at the 100°/n R.H. condition for mortar 2, the most 75
E X T E N T O F C A R B O N A T I O N
Direct CO, determinations by acid decomposition were made after the final drying stage on single speci- mens from each set of triplicates. This was done for mortars 1 and 2 and for the paste; the natural sand had too high a carbonate content to allow reasonable accuracy by difference.
The original CO, content of perlite aggregate was 0.12%); that of the cement, 0.72%. The CO, contents, as percentages of the cement content, for mortars 1 and 2 conditioned under C0,-free conditions were 1.7 and 2.7% respectively; for the paste, it was O.lO/o owing to pre-carbonation during fabrication and curing.
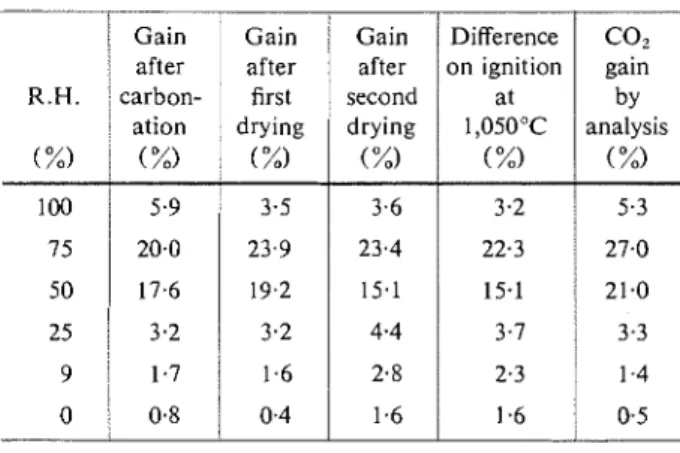
Table 3 compares the " CO, gains " that resulted
from drying with subsequent carbonation with the corresponding " net weight gains ", each corrected for the corresponding C02-free condition. It may be noted that actual CO, gains for the 50 and 75% R.H. speci- mens are higher than the weight gains obtained from the equilibrium end-points and the differences in igni- tion loss. (The latter are the differences between the ignited weights of carbonated and uncarbonated sam- ples of the same material at the same stage in condi- tioning.) This is not always true for specimens car- bonated at 100°/o or at low relative humidities. One must take into account four factors that make for the differences noted :
water loss accompanying carbonation;
water gain through continued hydration with time; decrease in non-evaporable water as a consequence of carbonation ;
possible differences and changes in the nature of the carbonation products.
For the highly carbonated specimens (75 and 50°/b R.H.), the water loss accompanying carbonation has been greater than the water gain accompanying hydra- tion. (The actual CO, contents are considerably higher than the weight gains at the three steps in conditioning shown in Table 3.) This is additional evidence that carbonation produces a net decrease in the amount of chemically combined ~ a t e r . ( ~ , l ~ J Below 25% R.H.,
permeable and open-textured material, and decreased 50
with decreasing permeability. Apparent abllormalities 25
in shrinkage and carbonation " net weight gain " for 9
25 to 0% R.H. were in evidence here also. 0
N O T E S : Each result from a single determination, corrected by subtracting corresponding value under C02-free condition. Gain in oven-dry weight expressed as a percentage of the oven-dry weight after 28 days curing.
5.9 20.0
T A B L E 4: Extent of carbonation of cement calculated on CO, contents: subsequent carbonation.
17.6 3.2
1
1;:; 0.8/
Carbonation as percentage of ultimate carbonation 3.5 23.9 15.1 4.4 2.8 1.6N O T E S : Ultimate carbonation = 0.48 g CO, per g of cement. " Total "-based on COL analyses.
" Gain "-based on " net weight gain ".
3.6 23.4
mortar 1 mortar 2 paste
where carbonation was low, it is evident that the small decrease in non-evaporable water is roughly of the same magnitude as the water gained through con- tinued hydration with time.
Similar trends were observed for samples previously dried with simultaneous carbonation.
On the basis of CO, analysis on the single specimens described above, the extent of carbonation was cal- culated as a percentage of ultimate carbonation by the method used in other i n v e s t i g a t i ~ n s . ( ~ ~ ~ l ~ ) Table 4 gives the results as total percentages of ultimate car- bonation based on analyses of CO, and as gain per- centages based on the " net weight gain
".
Considering the high permeabilities of mortars 1 and 2, the length of the carbonation period and the high concentration of CO,, one would expect ultimate
15.1 3.7 2.3 1.6 3.2 22.3 21.0 3.3 1.4 0.5 100 75 50 25 5.3 27.0 64 83 65 17 20 87 69 14 58 77 59 11 18 84 65 10 4 66 68 12 3 65 67 12
Mrrgnzine of Concrete Research : Vol. 17, No. 50 : Mnrc carbonation to be nearer 100% than these calculations would indicate. Some doubt is therefore justified as to the assumptions on which calculations of ultimate carbonation have been based in the past.
The increasing carbonation at 100% R.H. with in- creasing permeability, or larger pore system, is again apparent. It is suggested that even at loo:/, R.H. the larger voids are not completely filled with water and that considerable diffusion of gas can occur. The fact that roughly 60% of ultimate carbonation occurs at 100% R.H., with no significant carbonation shrinkage, is not consistent with Verbeck's .conclusion that the maximum should be in the order of 20%.(5)
It was possible to estimate the moles of water re- leased per mole of CO? gained from the test data obtained. For highly carbonated samples (75 and 50%), the values ranged from 0.2 to 0.8 with an average of about 0.5. This is considered consistent with recent reports. ' 5 > 9 )
M O R T A R S C U R E D F O R 2 8 D A Y S A N D F O R 3 M O N T H S
In addition to the 28-day mortars, to which the fore- going results apply, some specimens were cured under water to the age of 3 months before being subjected to the C0,-free conditioning and to drying with sub- sequent carbonation. Only the 50 and go/, R.H. condi- tions were compared.
For the dense sand mortars, shrinkages and weight gains due to carbonation were essentially the same: for mortar 3 the percentages of carbonation shrinkage were respectively 0.141 and 0.142% for 28-day and 3-month specinlens at 50% R.H.; and 0.01 1% for 9% R.H. in both cases. The corresponding weight gains resulting from carbonation were, in order: 6.4 and 5.8% at 50% R.H. and 0.4% in both cases at 9% R.H. Similar agreement was obtained for mortar 4.
For the perlite mortars, however, the carbonation shrinkages at 50% R.H. were 23% higher for samples aged 3 months than for those aged 28 days, in spite of practically no difference in weight gain from carbon- ation. The same was true at 9% R.H. except that both carbonation shrinkage and weight gain were very low in each case.
These results indicate, then, that there is no in'crease in the extent of carbonation through prior ageing from 28 days to 3 months. On the other hand, a greater stress has apparently developed from the carbonation of the 3-month paste, so that although the dense sand mortar was not affected the perlite mortar suffered a con- siderably higher shrinkage. One hesitates to draw a conclusion here because several factors are involved: ageing produces more gel and hence a greater tendency to shrink; more gel decreases permeability so that penetration of carbon dioxide and loss of water is retarded; the perlite aggregate itself may suffer in- creased compressibility through longer soaking in the solution in the mortar; and the change in character of
the paste induced by carbonation may be greater for the additional gel at 3 months.
The last possibility is tempting as a tentative ex- planation. It may be recalled that Verbeck's 7-day mortars subjected to drying with subsequent carbon- ation yielded carbonation shrinkage of the same order of magnitude as the water loss at 50% R.H.(5) In this study, the 28-day mortars (also with dense sand) yielded a corresponding carbonation shrinkage about one-and-a-half times as great as the drying shrinkage. The main difference in these mortars would appear to be the age at start of test.
It is interesting t o compare the results of the 28-day and 3-month mortars in the CO1-free system at 50 a n d 9%) R.H. Ageing to 3 months produced the expected small increase in weight in all cases (additional hydra- tion). In the dense sand mortars, the expected small decrease in drying shrinkage occurred. For the perlite mortars, however, there was an appreciable increase in shrinkage in the 3-month specimens over those cured for 28 days for both 50 and 9qlO R.H. conditions. The explanation may be that the additional hydration products in the more mature specimens provide addi- tional stress after prolonged drying, but the effect appeared to be greater than can be accounted for by this difference.
R A T E S
Simultaneous drying and carbonation
Changes in volume and weight under this condi- tioning were measured periodically from 5 to 97 days at each relative humidity.
At 5 days only a very slight carbonation shrinkage had occurred for the 75 and 50% R.H. conditions; yet approximately 80% of the eventual total weight gain due to carbonation had taken place. As the internal humidities at this stage in drying would obviously be much higher than 75 and 50% R.H., probably over 95%, it is evident that at least a major part of carbon- ation can occur with no carbonation shrinkage, and that this can and does take place very readily at relative humidities only slightly below 100%. This would bear out early observations that carbonation can proceed extensively at very high humidities.(16) It would appear also that loss of water must occur for carbonation to produce shrinkage in such mortars.
After the initial rapid carbonation during the first 5 days (it occurred for small as well as large weight gains), further slow gains occurred at all humidities below loo%, even after carbonation shrinkage had reached a constant value. This would suggest that a secondary carbonation product is formed slowly, fol- lowing the major reaction, and that it is not conducive t o carbonation shrinkage. This secondary reaction may be topochemical in nature."O) For the specimens dried at 0% R.H., carbonation shrinkage showed the
Changes in weight and dimensions in the drying and carboriatiorz of Portland cement mortars usual gradual increase, but this was then followed by
a slow decrease t o a constant value. This would sug- gest that changes can occur in initial carbonation products with time.
Rates decreased, in order, as follows: 25, 9, 0, 50 and 75% R.H. for carbonation shrinkage; 50, 75, 25, 9 and 0% R.H. for carbonation. This is further evi- dence that the condition for maximum carbonation is at a higher relative humidity than the condition for maximum carbonation shrinkage.
Drying with subsequent carbonation
Changes in volume and weight were measured periodically from 12 t o 68 days during the carbonation period.
At 12 days the 75% R.H. condition yielded the greatest weight gain and carbonation shrinkage relative t o the final values. In the highly permeable mortar 2, the large initial weight gain was followed by a slow decrease, suggesting a change in the initial carbonation product with time.
At 100 and 25% R.H., the slight initial volume changes remained stable although, as expected, there was a slight but continuous weight gain due t o car- bonation. At 9% R.H., however, both weight gain and carbonation shrinkage continued t o increase at a slow rate. At 0% R.H. the carbonation shrinkage also increased slowly, but initial weight gain decreased sharply with time. These apparent anomalies below 25% R.H. are again noted without explanation.
Drying under C0,-free conditions
It is interesting that the rates of water loss and dry- ing shrinkage under C0,-free drying were decreased in order at relative humidities of 25, 9,0, 50 and 75% (as for simultaneous drying and carbonation, see above). It is evident that these rates depend upon the rate at which the water is brought t o the surface of the speci- men as well as on the rate of evaporation. It would appear that the 25% R.H. condition provides the maximum gradient for the first process. Below 25% R.H. the drying plane recedes into the specimen and changes the character of the process.
S I Z E O F S P E C I M E N
As previously noted, the foregoing test results were based on & x & x 5 in. specimens. The two smaller sizes,
3
x4
x 5 and ax4
x 5 in., were carried through the 50 and 9% R.H. conditions for the three series: C0,-free drying, drying with subsequent carbonation, and drying with simultaneous carbonation. Compari- son of final results indicated that, although differences had been considered negligible, the trend was definitely toward higher values for shrinkage and weight with decreasing size of specimen, even for the more per- meable mortars. It is concluded that any refinements of such test values require thinner and highly per- meable specimens.Conclusions
Drying t o equilibrium under COz-free conditions revealed that changes, apart from hydration effects, occurred in the mature cement paste, depending o n the relative humidity. T h e greatest change occurred for the 50°/, R.H. condition where the results appeared t o show a minimum in the non-evaporable water con- tent, maxima in the total shrinkage and in " net
weight gain " on re-saturation, and a maximum reduc-
tion in total shrinkage on final drying. These proper- ties were associated with maximum sensitivity to secondary reactions and maximum stress due t o capil- lary forces exerted by residual capillary water.
Subsequent carbonation of these specimens pro- duced maximum carbonation shrinkage for those equilibrated at 50% R.H. In this case shrinkage due t o carbonation ranged from one-and-a-half t o two times that of water-loss shrinkage, depending on the compressibility of the material. Maximum carbon- ation, however, occurred for those specimens equili- brated at 75% R.H. Maximum carbonation shrinkage coincided also with a condition of apparently mini- mum non-evaporable water content, maximum capac- ity for water on re-saturation, and maximum reduction in total shrinkage on subsequent drying. N o appre- ciable volume change due to carbonation occurred at
100% R.H. or between 25 and
Ox,
but there was somecarbonation.
Drying with simultaneous carbonation under differ- ent relative humidities yielded higher maximum " net
weight gain " but much lower maxinium carbonation shrinkage than drying with subsequent carbonation. The most sensitive paste condition was therefore not achieved under this treatment. Early measurements for the 75% and lower relative humidities showed that most of the carbonation occurred while the internal relative humidity was still near 100%; there was n o appreciable carbonation shrinkage, however, until lower internal humidity had been achieved later in the conditioning while the specimens were still exposed to CO,. Thus, carbonation induces shrinkage only if the condition of the paste is at a moisture content corres- ponding t o some relative humidity below 100%. In the highly permeable specimens very extensive carbonation occurred at 100°/, R.H. without carbonation shrink- age. Apparently anomalous weight and volume changes occurred at and below 25% R.H.
Early rapid carbonation, which requires the pre- sence of water and an intermediate moisture content for maximum shrinkage, is followed by much slower carbonation at moderate and low humidities, the latter not accompanied by any significant shrinkage. There was evidence of change in the early carbonation pro- ducts with time of drying.
It appeared that maximum o r ultimate carbonation may be considerably less than the values previously accepted.
Magazine of Concrete Research : Vol. 17, No. 50 : Marc Curing from 28 days t o 3 months did not increase the maximum extent of carbonation but the shrinkage stress appeared to become greater.
From a practical point of view, the extent of carbon- ation for a given concentration of CO, depends upon permeability, moisture content and time; the extent of carbonation shrinkage and ultimate volume stability depends upon compressibility of aggregate, water/ cement ratio, maturity of paste, drying environment, and sequence of drying and carbonation. Simultaneous carbonation and drying at moderate relative humid- ities would appear t o be the best condition for ob- taining maximum volume stability.
Because carbonation can occur even at very high humidities, it would appear that dense concretes can, with time, suffer ultimate carbonation shrinkage at moderate humidities.
It is interesting to speculate on the significance of existing test data o n shrinkage and creep. It is evident that test methods for these properties, involving long periods of time, must include means of eliminating o r controlling carbonation. It is also interesting t o spec- ulate on the results of other tests on concretes and mortars subjected t o conditioning in 50% R.H. en- vironments stipulated by many specifications.
A C K N O W L E D G E M E N T
This paper is a contribution b o r n the Division of Building Research, National Research Council, Canada, and is published with the approval of the Director of the Division.
R E F E R E N C E S
1. SHIDELER, J. J. Investigatiotr oJthe moistrrre-volume stability of concrete rnasotlry units. Chicago, Portland Cement
Association, 1955. pp. 54. Research and Development Laboratories Bulletin D3.
2. TOENNIES, H. T. Artificial carbonation of concrete masonry units. Proceedings of the Americatt Concrete Institute. Vol. 31, No. 8. February 1960. pp. 737-755.
3. TOENNIES, H. T. and SHIDELER, J. J. Plant drying and car- bonation of concrete block-N.C.M.A. and P.C.A. co- operative program. Proceedings of the Atnerican Concre/e
It~stitute. Vol. 60, No. 5. May 1963. pp. 617-633.
4. LEA, F. M. and DESCH, C. H. The chemistry of cettret~/ and
cotrcrete. London, Edward Arnold (Publishers) Ltd, 1956.
pp. 473-477.
5. VERUECK, G. J. Carbonatiot~ of hydrated Portland cet~retzt.
Philadelphia, American Society for Testing and Materials, February 1958. Special Technical Publication No. 205. pp. 17-36. See also Chicago, Portland Cement Association, February 1958. Bulletin No. 87.
6. LEBER, I. and BLAKEY, F. A. Some effects of carbon dioxide on mortars and concrete. Proceedings of the Atnericatz
Cot~crete It~stitute. Vol. 28, No. 3. September 1956.
pp. 295-308.
7. KROONE, B. and BLAKEY, F. A. Reaction between carbon dioxide gas and mortar. Proceedit~gs of the Atnerican
Concrete Institute. Vol. 31, No. 6. December 1959. pp.
497-5 10.
8. ALEXANDER, K. M. and WARDLAW, J. A possible mechanism for carbonation shrinkage and crazing, based on the srudy of thin layers of hydrated cement. Australian Journal o f
Applied Sciet~ce. Vol. 10, No. 4. 1959. pp. 470-483.
9. HUNT, C. M. and TOMES, L. A. Reaction of hardened Portland cement paste with carbon dioxide. Jourt~al o f Researcll of
the National Bureau of Standards. Section A. Physics and
Chemistry. Vol. 66, No. 6. November-December 1962. pp. 473-480.
10. POWERS, T. C. A hypothesis on carbonation shrinkage.
Jourtral of the Research and Developt?let~t Laboratories
(PCA). Vol. 4, No. 2. May 1962. pp. 40-50.
1 1 . HILLEBRAND, W. F. and LUNDELL, G. E. F. Applied inorgat~ic analysis. New York, John Wiley and Sons, 1950. pp.
623-625.
12. FELDMAN, R. F. and SEREDA, P. J. The sorption of water on compacts of bottle-hydrated cement. I. The sorption and length change isothernls. Journal o f Applied Clre~tristry. Vol. 14, No. 2. February 1964. pp. 87-93.
13. HUNT, C. M., TOMES, L. A. and BLAINE, R . L. Some effects of ageing in the surface area of Portland cement paste.
Jolrrnal of Research of the National Brrreau of Statrdarrls.
Section A. Physics and Chemistry. Vol. 64, No. 2. March- April 1960. pp. 163-169.
14. STEINOUR, H. H. Discussion on reference 6. Proceeclitrgs of
the At?~ericatr Concrete It~stitrrte. Vo1. 30, NO. 8. February
1959. pp. 905-907.
15. HUNT, C. M., DANTZLER, v., TOMES, L. A. and BLAINE, R. L. Reaction of Portland cement with carbon dioxide. Jorrrtral
of Research of the Natiotral Burearr of Statrdarrls. Vol. 60,
No. 5. September-October 1958. pp. 441-446.
16. YOSHIDA, Y. Length changes of cement paste in relation to combined water. Proceeditrgs of //re Attrerican Cotlcrete