HAL Id: hal-02365990
https://hal.archives-ouvertes.fr/hal-02365990
Submitted on 7 Dec 2019HAL is a multi-disciplinary open access
archive for the deposit and dissemination of sci-entific research documents, whether they are pub-lished or not. The documents may come from teaching and research institutions in France or abroad, or from public or private research centers.
L’archive ouverte pluridisciplinaire HAL, est destinée au dépôt et à la diffusion de documents scientifiques de niveau recherche, publiés ou non, émanant des établissements d’enseignement et de recherche français ou étrangers, des laboratoires publics ou privés.
Gustavo Coelho Rezende, Stéphane Le Calvé, Juergen J. Brandner, David
Newport
To cite this version:
Gustavo Coelho Rezende, Stéphane Le Calvé, Juergen J. Brandner, David Newport. Microfluidic photoionization detector: channel geomtery and signal evalutation, (oral presentation & poster & proceedings with peer review). International Symposium on Thermal Effects in Gas flows in Microscale (ISTEGIM), Oct 2019, Ettligen, Germany. �hal-02365990�
1
ISTEGIM2019:283282
MICROFLUIDIC PHOTOIONIZATION DETECTOR: CHANNEL
GEOMETRY AND SIGNAL EVALUATION
Gustavo Coelho Rezende
1, Stéphane Le Calvé
2,3, Jürgen J. Brandner
4, David Newport*
1,
1
Bernal Institute, School of Engineering, University of Limerick, V94 T9PX Limerick, Ireland gustavo.coelho@ul.ie
*
Correspondence: david.newport@ul.ie; Tel.: +353-61-202-849 2
Université de Strasbourg, Centre national de la recherche scientifique (CNRS), ICPEES UMR 7515, F-67087 Strasbourg, France
slecalve@unistra.fr 3
In’Air Solutions, 25 rue Becquerel, 67087 Strasbourg, France 4
Institute of Microstructure Technology (IMT), Karlsruhe Institute of Technology, Hermann-von-Helmholtz-Platz 1, 76344 Eggenstein-Leopoldshafen, Germany,
juergen.brandner@kit.edu
KEY WORDS
Photoionization detector; volatile organic compounds; gas analysis; microfluidics
INTRODUCTION
Air quality is fundamental for healthy life. Recently, a class of carbon-containing chemicals is raising awareness of authorities in air quality due to their potential harms: the Volatile Organic Compounds (VOCs). They are commonly found in vapor phase at ambient atmospheric conditions and can be found in indoor environments as they come from sources such as varnishes, paints, solvents, cleaning materials, etc. [1]. A common VOC found indoor is benzene, which is carcinogenic and has no safe level of exposure recommended [2]. In the European Union, indoor air quality concern has resulted in regulations and guidelines limiting benzene exposure [3].
In order to monitor air quality, Gas Chromatographs (GCs) equipped with detectors can be used. GCs can identify and quantify chemicals present in air, including VOCs. However, most GCs used in the market with low detection limit are not portable, meaning: heavy, bulky and lab-based [4,5]. The demand for air quality evaluation drives the need for improved gas chromatographs, enabling effective air monitoring resources. A possible way to achieve improvement is miniaturization of all the GC components, including the detector [6].
The photoionization detector (PID) is a concentration-sensitive detector frequently used with GCs (also for VOC analysis) and it is compatible with miniaturization. The PID working principle is based on ionizing gaseous compounds by light emitted from an ionization source when the sample flows through an ionization chamber. Within the ionization chamber, two electrodes stablish an electric field for collection of the ionization current generated by the ionized sample. The ionization current is proportional to the concentration of the ionizable sample inside the ionization chamber. By using external calibration gas with known concentrations, the current signal can be expressed as concentration of compounds in the sample.
*
2
specialized environmental control, increasing the initial cost for prototyping [7]. This work presents a µPID design fabricated with simpler techniques, micromilling and electro discharge machining [8]. The ionization chamber, which is a microchannel, has its dimensions presented and compared to the signal magnitudes for different channel shapes. Moreover, an important signal parameter for detection limit definition, the baseline noise, is displayed and compared for various filter cut-off frequencies in two experiments designed to investigate the influence of a Faraday Cage (FC).
DESIGN, GEOMETRY AND SIGNAL
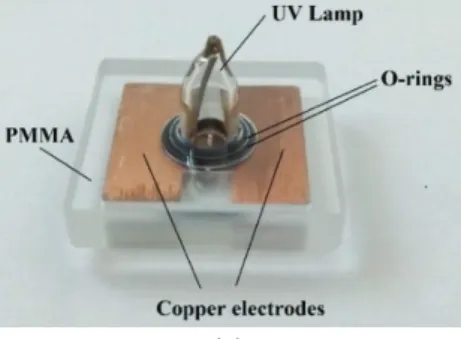
The µPID design referred in this work is described in detail by Rezende et al. (2019) [8]. The detection cell is formed in the core of the device, represented in Figure 1a, which is composed of two PMMA parts, two copper electrode plates, two O-rings and a commercial UV lamp (10.6 eV, Baseline-Mocon, 043-257) [5]. The core parts are all assembled together without any bonding process, this enables a modular function of the device with possibility to exchange a faulty component without having to dispose the whole detector. The UV lamp, for example, is an important element to be exchanged periodically since it has a limited lifetime (~10000 h). Figure 1b shows the commercial UV lamp with its main dimensions and features. Since the ionization chamber is a microchannel (Figure 2a), the main geometric parameters can be extracted from the channel dimensions (Figure 2b). The vertical walls of the microchannel are made of the copper electrodes; therefore, the electrodes area ( !) is obtained from the vertical walls. The top wall of the channel
is made by the lamp window (composed by MgF2); therefore, the illumination area ( ") is calculated as the
lamp window surface at the channel opening.
The lamp window diameter (#$) and bulb diameter (#") are compared in the channel image on Figure
2a. #" encloses a region where light has probably higher intensity, and is also named as illumination
diameter. Based on that, for channel design purposes, different channel shapes were enclosed into the #". For
channel characterization, the whole top surface of the microchannel is defined as the illumination area of the ionization chamber.
(a) (b)
Figure 1: a) µPID core main components; b) Commercial UV lamp features and dimensions (uncertainty = ±0.05 mm).
The geometrical parameters influencing directly the sensitivity of the µPID are: 1) Channel width (%): changes the strength of the electric field at fixed applied voltage. A lower width yields stronger electric field with less possibility for ion recombination; 2) Electrode area: higher electrode area means lower resistance to the ionization current, yielding a higher current for a fixed voltage; 3) Illumination area: large area yields more ionized molecules resulting in higher signal; 4) Channel height: impacts directly on the number of ionized molecules. However, if the height is too large it means some molecules at the bottom might not be ionized, meaning an unnecessary increase in ionization chamber volume (&'). Chamber volume increase is
3
(a) (b)
Figure 2: a) Optical microscope image indicating microchannel, illumination and window diameters; b) Microchannel
schematics with main geometry and geometrical parameters.
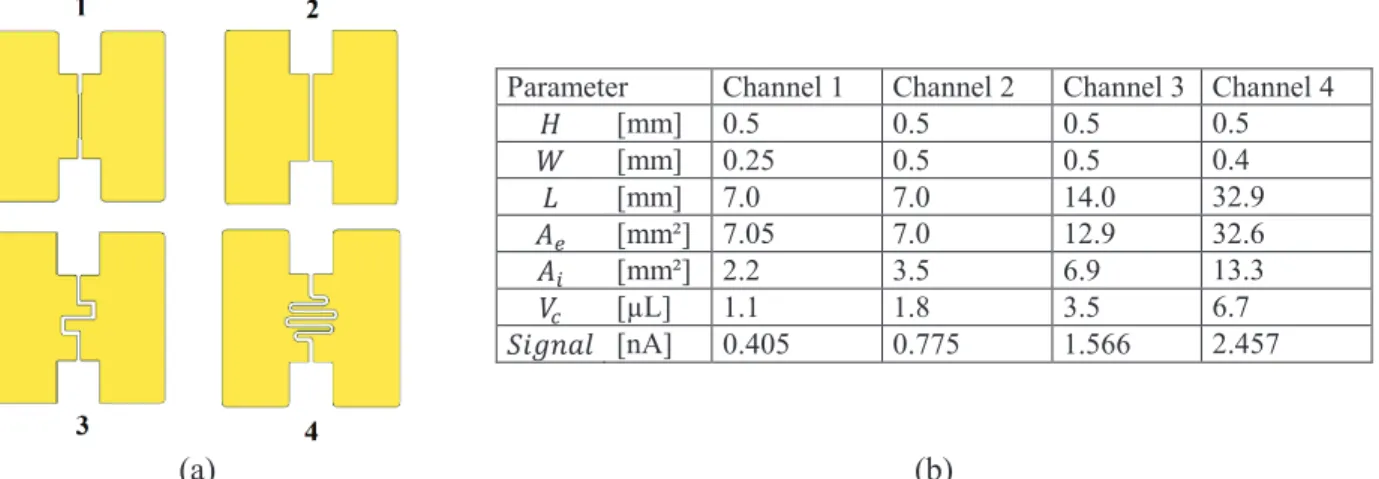
Four microchannels with different shapes are shown in Figure 3a. They were tested inside the µPID core and their respective signal level is presented in Figure 3b. The signal is generated from a constant flow rate (20 mL/min) of a gas mixture containing 100 ppm of toluene in nitrogen and with 30 V applied on the electrodes. All signals were recorded after stabilization and the values presented on Figure 3b are averages of 10 points taken in a 1 min interval with a maximum uncertainty of 2 %. The four channel designs represented in Figure 3a were chosen to verify the influence of an increasing electrode area and different channel widths.
The table shown on Figure 3b displays all the geometric parameters measured and the signal magnitude for the four channels. The only parameter that is kept constant is the height of the channel, because it is set by the thickness of the copper plates used to make the copper electrodes (0.5 mm). From channel 1 to channel 2, two main parameters change: and !". There is an increase in channel width and an increase in illumination area, resulting in two opposing effects on the signal magnitude. It is possible to notice an almost 100 % increase in signal level when using the larger channel, suggesting that the effect of the illumination area overcomes the width change for the modification of dimensions provided. Channels 3 and 4 present a greater increase in electrode area and illumination area compared to channel 1 and 2, and these two factors serve to increase the detector sensitivity. As a consequence of the changes in shapes, #$ increases, but the order of magnitude of #$ is still similar, indicating it should not have a significant impact on the signal even if the device is used with a GC, depending on the sample volume. The results show that the electrode area and illumination area play an important role in the signal level for the presented µPID design. Future efforts should be done to improve sensitivity by optimizing those two parameters.
Parameter Channel 1 Channel 2 Channel 3 Channel 4
% [mm] 0.5 0.5 0.5 0.5 [mm] 0.25 0.5 0.5 0.4 & [mm] 7.0 7.0 14.0 32.9 !' [mm²] 7.05 7.0 12.9 32.6 !" [mm²] 2.2 3.5 6.9 13.3 #$ [µL] 1.1 1.8 3.5 6.7 ()*+,- [nA] 0.405 0.775 1.566 2.457 (a) (b)
Figure 3: a) Microchannels shapes; b) Geometry parameters and signal level for channels 1, 2, 3 and 4.
Figure 4a shows the signal obtained from channel 4 when 30 V is applied on the electrodes with nitrogen flow at 50 mL/min. This plot illustrates how the noise changes for different operation inputs of the µPID. Two datasets are displayed, one without FC for the entire data acquisition (Test 1) and another with FC starting at 4 min on the data acquisition (Test 2). The signal acquisition started with the lamp off for 2 min and then the lamp is turned on. With the lamp is turned off, no current should be present; however, the
4
acquisition, the FC was included in the Test 2 experiment. Figure 4b shows the noise level measured for the two datasets presented on Figure 4a. It is clear that the addition of the Faraday cage reduces significantly the noise. After 6 minutes of experiment a first order RC filter with 12 dB attenuation was applied with varying cut-off frequencies until the end of the experiment. The cut-off frequencies were 1 MHz, 10 kHz, 10 Hz and 0.03 Hz and each one was applied for 2 min. It is possible to see that the 0.03 Hz cut-off frequency reduces considerably the noise, which is essential to decrease the detection limit of the sensor. However, for use with a GC column or low frequency signals, the 0.03 Hz cut-off frequency is not suitable, because it can reduce the intensity of the chromatographic peaks. Therefore, it is estimated that for optimal operation of the PID coupled with the GC, a 10 Hz filter should be used in addition with a Faraday cage.
(a) (b)
Figure 4: a) Signal vs time with and without Faraday cage; b) Noise measured with and without Faraday cage.
Acknowledgements
This study was developed during the ITN Research Project, MIGRATE, supported by European Community H2020 Framework under the Grant Agreement No. 643095.
References and Citations
[1] L.A. Wallace, E. Pellizzari, B. Leaderer, H. Zelon, L. Sheldon, Emissions of volatile organic compounds from building materials and consumer products, 1987. doi:10.1016/0004-6981(87)90017-5.
[2] WHO, Air quality guidelines for Europe, 2nd ed., 2000. doi:10.1007/BF02986808.
[3] European Comission, DIRECTIVE 2000/69/EC OF THE EUROPEAN PARLIAMENT AND OF THE COUNCIL of 16 November 2000 relating to limit values for benzene and carbon monoxide in ambient air., Off. J. Eur. Communities. (2000). doi:10.1016/j.jclepro.2010.02.014.
[4] MODEL GC955-600, ET enviro Technology Services, (n.d.). http://www.et.co.uk/products/air-quality-monitoring/continuous-gas-analysers/synspec-gc955-601-btx/ (accessed July 19, 2018).
[5] Baseline MOCON, (2019). http://www.baseline-mocon.com (accessed July 6, 2018).
[6] S. Khan, D. Newport, Development of a Toluene Detector Based on Deep UV Absorption Spectrophotometry Using Glass and Aluminum Capillary Tube Gas Cells with a LED Source, (2019). doi:10.3390/mi10030193.
[7] G.C. Rezende, S. Le Calvé, J.J. Brandner, D. Newport, Micro photoionization detectors, Sensors Actuators B Chem. 287 (2019) 86–94. doi:10.1016/j.snb.2019.01.072.
[8] G. Rezende, S. Le Calvé, J. Brandner, D. Newport, Micro Milled Microfluidic Photoionization Detector for Volatile Organic Compounds, Micromachines. 10 (2019). doi:10.3390/mi10040228.