HAL Id: hal-01273414
https://hal.archives-ouvertes.fr/hal-01273414
Preprint submitted on 12 Feb 2016
HAL is a multi-disciplinary open access
archive for the deposit and dissemination of
sci-entific research documents, whether they are
pub-lished or not. The documents may come from
teaching and research institutions in France or
abroad, or from public or private research centers.
L’archive ouverte pluridisciplinaire HAL, est
destinée au dépôt et à la diffusion de documents
scientifiques de niveau recherche, publiés ou non,
émanant des établissements d’enseignement et de
recherche français ou étrangers, des laboratoires
publics ou privés.
Study of Surface Acoustic Wave propagation using
Synchrotron Radiation X-Ray Topography
Bernard Capelle, Yves Epelboin, Alain Soyer, Jacques Détaint
To cite this version:
Bernard Capelle, Yves Epelboin, Alain Soyer, Jacques Détaint. Study of Surface Acoustic Wave
propagation using Synchrotron Radiation X-Ray Topography . 2014. �hal-01273414�
Abstract— X-ray topography is an accurate and sensitive
method to image the strain fields existing in crystals, particularly those created by bulk or surface acoustic waves (BAW or SAW). The time structure of the synchrotron radiation allows to image progressive waves having a frequency multiple of that of the synchrotron. The main purpose of this study is the understanding of the exact nature of the information obtained about SAW by means of X-Ray topography. To this end we will consider experimental and computed images obtained for SAW propagating on ST-cut quartz and YZ-LNB. Most experiments were made using wide X-ray beams. Depending on the diffraction conditions, the so-called "translation" topographs seem often as being good maps of the displacement existing near the surface of the SAW device. These images may be considered as the result of a process of spatial integration of section topographs, more simply related to the X-ray diffraction process and to the displacement gradients of the acoustic field. These section topographs, corresponding to an extremely thin X-ray beam, contain, in fact, more information about the SAW.
Quite intricate section topographs of low amplitude SAW propagating on YZ lithium niobate and ST-cut quartz were experimentally obtained using the Bragg diffraction geometry (reflection). Simulations of these section topographs gave information about the displacement gradients existing near the surface (most intense contrast) and about the depth dependence of this gradient (weak contrasts). In the summation process, leading to the "translation" topographs, only the intense contrasts (representing the largest strains) contribute significantly while the weaker ones are blurred into a grey level. Thus, the main contrast in translation topographs arise mainly from the gradients of the component of the displacement along the diffraction vector, at (or very near) the surface. These derivatives are proportional to the displacement so that these topographs represent essentially, with a different phase, the corresponding displacement. When the amplitude of the SAW becomes large enough, a kinematical diffraction process explains that the most intense contrast generated near the surface is enlarged proportionally to the local amplitude. This allows a simple method to measure the transverse amplitude variations of the surface modes.
The authors are with the Institut de Minéralogie, de Physique des Matériaux et de Cosmochimie; CNRS UMR 7590. Sorbonne Universités Université Pierre et Marie Curie (Paris VI) & CNRS. 4, Place Jussieu 75005 Paris France.(e-mail: [email protected]).
The two other elastic components of the SAW are imaged using the Laue diffraction geometry (transmission) with appropriate diffraction vectors. The corresponding section topographs obtained with ST-cut quartz are also complex and again, simulated images were used to understand the contrasts observed. Similarly the summation process, leading to the translation images, is dominated by the largest displacement gradient and so leads to a representation of the lateral displacements existing near the surface. Small velocity (phase) variations most probably induced by the dislocations present in the synthetic quartz crystal, were observed in the sections images. (Abstract).
Index Terms: Propagation of Surface Acoustic Waves (SAW),
SAW filter, Synchrotron radiation, Visualization of piezoelectric waves in crystals. X-ray diffraction, X-ray topography. Lithium niobate. Quartz.
I. INTRODUCTION
-RAY topography is a very sensitive method to image strain fields existing in crystals. It is widely employed to observe the fields associated with the defects of the crystals and thus to assess the crystalline quality of the materials [1]. It is also very powerful to image the elastic fields associated to the piezoelectric waves. The periodic nature of the synchrotron radiation, constituted of very short X-Ray pulses, may be used for time resolved stroboscopic observations of the progressive acoustic waves existing in the SAW devices [2-3-4].
The dynamic theory of X-ray diffraction [5-7] indicates that the diffraction process, by a sufficiently perfect crystal, in which acoustic waves of small or moderate amplitude propagate, is sensitive to the displacement gradients of the acoustic field.
Previously most studies of SAW devices, using synchrotron radiation, considered reflection topographs with a diffraction vector close to the normal to the surface and a wide X-ray beam. These images seem to be good maps of the normal displacement of the SAW near the surface even if the relation between the optical density, in the recorded image, and the vibration amplitude may be intricate. The mechanism leading to this fact is complex and will be explained in this paper. The
Study of Surface Acoustic Wave propagation
using Synchrotron Radiation X-Ray
Topography
Bernard Capelle, Yves Epelboin, Alain Soyer and Jacques Détaint,
Member IEEE
.
Sorbonne Universités, UPMC Univ. Paris 06, UMR 7590, IMPMC. 4, Place Jussieu 75005 Paris. France.
CNRS UMR 7590. Institut de Minéralogie, de Physique des Matériaux et de Cosmochimie. 75005 Paris.
contrast of these translation topographs [8] originates from the summation of the underlying section topographs [9], ie. from images recorded with a very narrow beam [8]. The choice of the diffraction vector and of the incidence plane determines the components of the displacement gradient being imaged. Many parameters, governing the diffraction depend sharply on the wavelength, so that the contrasts can drastically change for the same diffracting plane when the wavelength is modified. In this paper, we present several new features observed in section” and translation images, using white beams or monochromatic radiations with SAW devices made from quartz and lithium niobate. Comparing experimental and simulated topographs, we will show that the images are often more complex than previously considered and observed. This complexity allows obtaining more information about the SAW. Another factor of complexity of the images arises from the fact that the SAW existing in the real devices having finite dimensions may be quite different from the theoretical straight crested waves propagating on substrates of infinite lateral dimensions. This difference is often due to the effect of the finite dimensions of the transducers, to the effects of the bus lines and almost to the apodization of the transducers used in the transversal filters.
II. TRANSLATION TOPOGRAPHS.
A. Experimental conditions.
Most of the topographs presented here after were obtained during experiments made on beam lines ID19 and BM05 at the European Synchrotron Radiation Facility (ESRF-Grenoble) with the objective to better understand the mechanism of diffraction by crystals distorted by acoustic waves. A few topographs were obtained some time ago at the LURE Synchrotron (Orsay-France) using similar devices (delay lines or filters). Both section topographs and translation topographs were recorded on high resolution X-ray films with SAW having various amplitudes and phases. Many section images were compared to image computed as numerical solutions of the equations of the dynamic theory of X-ray diffraction in view to further understand the mechanisms implied in the formation of the diffraction images and to get back information from the experimental images.
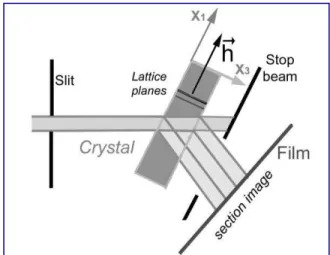
Figure 1. The Bragg diffraction geometry.
The Laue diffraction geometry was used to image mostly the gradients of the in-plane displacements of the SAW (Figure 2). Again, the use of a symmetric reflection (then the lattice plane is normal to the surface) is useful to image only the gradients of the displacement perpendicular to the lattice plane. In figures 1 and 2 the SAW are referred to the usual axis system (x1, x2, x3 or x'1, x'2, x'3); in which x1 is the
propagation direction of the SAW and x3 the inward normal to
the surface while the diffraction geometry is characterized by axis related to the incidence plane x"1 O x"3 . X"1 on the
surface, is directed toward the X-ray source, x"3 being the
inward normal to the surface.
Figure 2. The Laue diffraction Geometry.
The frequency of the signal exciting the SAW is produced from an internal signal of the synchrotron so to be an exact multiple of the revolution frequency of the synchrotron. A phase shifter is used to adjust the relative phase between the synchrotron pulses and the current exciting the SAW. In many cases, the maximum or a zero of the exciting current or of the diffracted intensity was adjusted to correspond exactly to the arrival of the X-ray pulses delivered by the synchrotron.
B. Translation images of SAW devices using Y-Z LNB.
The devices studied were either filters or delay lines [10]. The filters were all high performance transversal filters made for high-end professional video applications. Many identical filters of two different kinds were studied. These filters, made by a French manufacturer are all constituted of two apodized transducers disposed in two separated tracks to avoid the triple transit echo. A multi-strip coupler [11-12] is used to transfer the SAW from one track to the second one where they are detected. In order to obtain simpler wave shapes, large delay lines, having uniform transducers with a wide aperture were also studied.
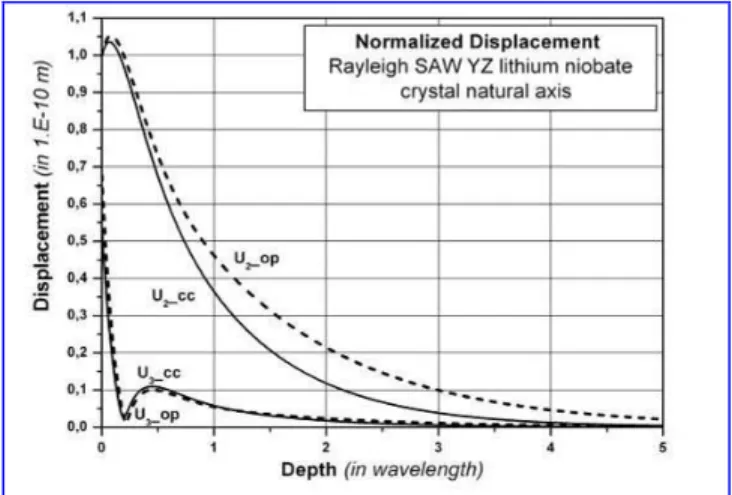
Due to the mirror symmetry, the theoretical straight crested Rayleigh surface mode propagating on Y-Z LNB is characterized by only two non-zero elastic components (u'1
and u'3 in the SAW axis or u2 and u3 in the natural axis of the
crystal) and by a potential wave Φ. The computed variations of the modulus of these components in the thickness of the substrate are recalled in figure 3.
The large X-ray absorption of lithium niobate and the large density of extended defects existing in this material render difficult the observation of SAW using the Laue diffraction geometry so that most of the experiments were made using the Bragg geometry. During the experiments, we have observed
that the best images of the SAW made with white synchrotron radiations and the (03.0) reflection, were obtained with incidence angles in the range 20-30°.
Figure 3. Components of the displacement of the straight-crested SAW in YZ LNB (op=Open circuit mode; cc=Short circuit mode).
A typical observation is presented in figure 4 where the (upper) apodized input transducer generates a complex wave shape. The multi-strip coupler generates a nearly straight crested wave (details on figure 5) which propagates from the left to the right whereas its amplitude increases. These topographs were obtained with an incidence direction situated in the saggital plane of the SAW.
Figure 4. Bragg translation topographs of a SAW filter [Y-Z LiNbO3 , white
beam, (03.0) reflection, incidence #25°, incidence plane Y0Z (crystal axes); F=34.86080MHz. Length represented #25mm].
Figures 4 and 5 represent quite accurately the normal displacement existing near the surface but with a phase factor. This point will be justified and further discussed in § III. In this case, the accuracy of the representation is due to the particular diffraction conditions, that produce a quite simple relation between the density of the contrasts and the local amplitude (#α(|u3|). This constitutes the principal interest in
using translation topographs to study the SAW devices. For the same diffracting plane, when the incidence of the X-rays is
changed by a rotation of the device around its normal, the contrasts becomes sensitive to other derivatives (
u
i/
x
1and
u
j/
x
2etc...
in the SAW coordinates) and the curvature of the wave fronts, under the input transducer, can be observed (figure 6).Figure 5. Details of the waves emitted by the multistrip coupler [similar diffraction parameters as for figure 4].
Figure 6. Detection of the curvature of the wave fronts in the first track of the filter using a 45° rotation of the incidence plane. [(03.0) reflection,.θ=22.5°, Frequency=34.86080MHz].
The bandwidth of the studied filters is sufficiently wide to contain several integer multiples of the synchrotron frequency; excitation signals having different frequencies, all situated in the pass band of the filters, were used to obtain figure 4, 7a, 7b and 8 (see the legends). The radiation diagram of the emitting transducer appears to vary significantly with the excitation frequency (Figures 7a-7b).
The observation of the surface waves, using a smaller incidence angle, gives less information about the wave and more details about the defects of the substrate (figure 7). Since the X-Ray wave length is shorter, the absorption decreases, and the diffraction is more sensitive to the numerous defects in the bulk (dislocations, sub-grain boundary, etc.). Some contrasts arise from strains resulting from striations made at the back of the device. The filter, in figure 7, contains many sub-grains but with smaller disorientations than those that we will observe in figure 9. In figure 8, many are situated in the region of the multi-strip coupler (white contrast).
Figure 7. Variation of the radiation diagramm with the excitation frequency (Fig.7a F= 38.031358MHz; Fig. 7b F=34.862078MHz).
Figure 8. Image of a similar SAW filter obtained with a smaller incidence angle [Same type of filter, same reflection, θ=15°; F=34.084148 MHz].
In figure 9 we observe the waves generated on YZ LNB by a uniform transducer with a wide aperture. They are very nearly straight crested in most of the aperture. The amplitude decreases rapidly outside of the bus lines. The distortions observed in the upper part of the topograph are due to continuous and abrupt variations of the crystal orientation, that result respectively from a very high density of dislocations and from the presence of a sub-grain boundary (white contrasts).
Figure 9. SAW generated by a uniform transducer on YZ LNB. (F=11.361376 MHz).
C. Translation topographs of SAW propagating on ST-cut quartz.
Surface waves propagating in delay lines made on ST-cut quartz were studied using the Bragg and the Laue diffraction geometries. The piezoelectric SAW propagating in the x1
direction of ST-cut quartz has three elastic components that can be studied nearly separately using appropriate diffraction vectors. The variations of the modulus of these component in the depth of the substrate (x'3 direction) are recalled on figure
10 where the same normalization of the normal component (u3) to 1 Å at the surface is made as for figure 3.
Figure 10. Components of the SAW propagating along the two-fold axis in ST-cut quartz.
The minor natural face of the rhombohedra (lattice plane (0-1.1)) is very close to the ST-cut so that the normal component of the SAW (u3) can be nearly independently observed. The
component along the two-fold axis of quartz (x1) can be
rigorously observed using the (-2 1.0) symmetric reflection. The other transverse component (u2) is observed, with a good
approximation, using the (0 2.3) or the (0 1.1) reflections. An example of topograph made with the (0-1.1) reflection is presented in figure 11. In this image, the acicular black contrasts of triangular shape, with one edge nearly parallel to the wave front (representing the dislocation line), are due to the numerous dislocations existing in this large ST-cut plate taken in a commercial 4 inches wafer.
7b 7a
Figure 11. Reflection topograph of the SAW propagating on ST-cut quartz (large delay line operating at F=11.361376 MHz).
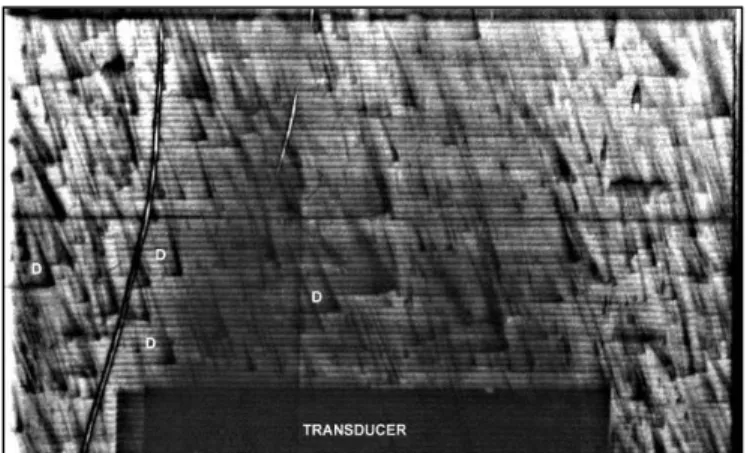
A transmission topograph of a ST-quartz delay line having a much better crystalline quality, made using the (-21.0) reflection) is presented in Figure 12. This large ST-cut plate was obtained in a high-Q quartz crystal presenting a reduced density of dislocations. It was designed to operate at 9.507840MHz and excited with a signal having larger amplitude than for figure 11. Some frequency doubling occurs after that the SAW crosses bundles of dislocations (D) and variations of the instantaneous amplitude are observed in the SAW path. A part of the transducer can be observed in the lower part of this figure.
Figure 12. Transmission topograph of the SAW propagating on a large ST-cut delay line operating at 9.507840 MHz.
III. SECTION TOPOGRAPHS IN BRAGG GEOMETRY AND
COMPARISON WITH COMPUTED IMAGES.
A. Experiments with small amplitude SAW.
Some of the observations made during the experiments related in the preceding paragraph, particularly those concerning the influence of the incidence, have suggested that the mechanisms implied in the formation of the translation image of the SAW were not as simple as previously considered. In order to get a further understanding, we have recorded section topographs of crystals with propagating SAW. The first experiments, using Y-Z lithium niobate and an incidence in the saggital plane, did not provide any new information but they led to suspect that the images contain unexpected overlapping contrasts. To resolve them, the
incidence plane was rotated (20° and 25°), around the normal to the Y-cut plate. In the (03.0) section topograph, for an incidence angle θ=20° and a rotation (Ψ = 20°) around the y axis, with a slit 30µm large, the contrast extends much away from the strong expected one. Figure 13 is typical of these observations. This topograph was obtained in the region of the multi-strip coupler where straight crested waves are generated (see figure 5) and where the amplitude of the SAW is moderate. From the bottom of the topograph, the first darker contrast is the expected one. The modulations are due to the spatial variations of the displacement gradients of the SAW near the surface. The other fringes, typically four to six in the propagation direction, are quite unexpected. They correspond to a multi-trajectory diffraction mechanism in which several other diffracted beams are generated at increasing depth by the displacement gradients of the SAW. In the part of the image, where no SAW propagate, no multiple contrasts exist and the diffracted intensity decrease continuously from the surface even if defects may generate contrasts in the bulk (part of figure 13 where no SAW propagates).
Figure 13. Section image taken under the multistrip coupler. (03.0) reflection (F=34.084148 MHz).
B. Numerical simulation of the diffraction images.
To understand the observations, simulated section images were computed as numerical solutions of the Tagaki-Taupin equations {1} of the dynamical theory of X-ray diffraction [5-6-7].
.sin(2 ) 1 : . 1 . . . 2 0 0 0 0 0 h h h h h h h h h with u h s k k j D k j s D D k j s D {1}
4 1 1 3 .2. . )exp( ) . . 2 exp( k k ik k n i j t j x j x Z A u {2}In equations {1} D0 and Dh are the incident and diffracted
electrical displacement along s0 and sh the unit vectors along
the incident and the diffracted direction. h
is the diffraction vector, k the X-ray wave number, u the displacement,
is the Bragg angle;h h
, χ
χ
0,
are the dielectric susceptibilities in the directionsh h
s
s
s
0,
,
; 0,h are functions of the angles between h,s0andsh. The diffractions conditions (incidencethe experiments and the parameters, appearing in the equations, were computed for these conditions. The values of the partial derivatives of the displacement appearing in equations {1} were obtained from expression {2} valid for a piezoelectric Rayleigh SAW [10-12,13]. The coefficients Zk, αk, ik appearing in {2} were numerically computed as those
of the surface wave solution of the equations of piezoelectricity for the corresponding propagation direction and plate orientation. An, the amplitude normalisation
coefficient, was used as a parameter chosen so that the simulated diffraction image corresponds best to the experimental one.
The solutions of equations {1} were computed using an improved numerical scheme described in [14 -15], employing a very small spatial step (the principle of the discretization is recalled in figure 14 which represents also the variations of
1 3/ "' ' " x
u
). The results of these computations indicate that the strains associated with the surface waves modify largely the distribution of the diffracted intensity in the topograph and introduce a modulation in the spatial distribution of this intensity (compare figures 15 and 16).
Figure 14. Principle of the discretization used for the numerical simulations.
Figure 15 represents the computed distribution of the diffracted intensity for a perfect LNB crystal without SAW, along a line in the incidence plane (where it cuts an X-ray film parallel to the surface, see figure 1). Most of the diffracted intensity is generated very near the surface, and those generated inside is rapidly decreasing.
Figure 15. Computed diffracted intensity without SAW (perfect crystal).
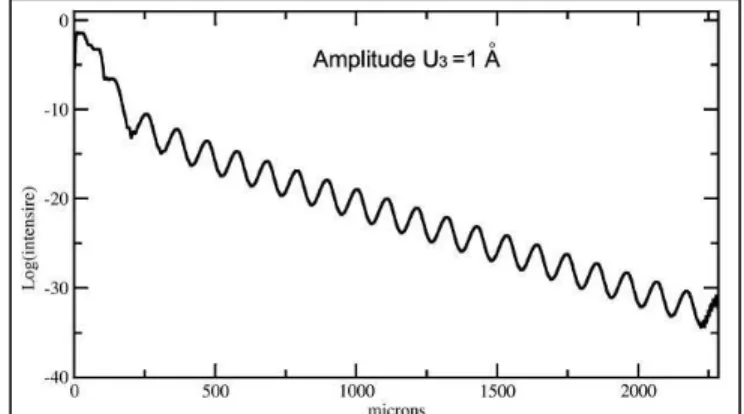
Figure 16 represents the same diffracted intensity in presence of a SAW having a peak amplitude of 1Å (for u3)at
the surface. It should be noticed that this small amplitude is sufficient to change greatly the contrasts.
The corresponding simulated section image is shown in figure 17 where the diffracted intensity is represented with a scale extending over 40 decades (as in figure 15 and 16). Some filtering was applied to this image in order to blur tiny fringes, not resolved in the films and some sampling artifacts.
Figure 16. Computed diffracted intensity with SAW (u3=1Å).
Figure 17. Computed section image (same extended density scale as considered in figures 15 and 16).
This dynamical range of optical density is far beyond the capacity of the X-ray films which is typically of 4 decades, or a little more if saturation of the darker parts of the image is allowed. In modifying the density scale, the computed image becomes very similar to the experimental one (Figure 18). The calculations confirm that the multiple contrasts are generated along the incident path, at different depth where the displacement gradients become extremal (figure 19).
Figure 18. Computed section image (reduced density scale).
More precisely, the simulations have shown that the contrasts produced by the SAW, are mostly due to the variations of 3 ' / 3 ' x u
(X-ray axis) and hence to the extrema along the incident ray of this quantity. The variations of this gradient (normalized to 0.5 at x'3=0) are represented in figure
19. The calculations explain the complex variations of the intensity diffracted near the surface (see figures 15 to 18) and the successive contrasts generated at more important depth.
Figure 19. Variations of u'3/x'3and generation of the multiple contrasts (the points correspond to zeros of the function and to the sucessive white
contrasts).
The variations of the diffracted intensity (figure 16) depend on the relative phase between the X-ray pulses and the current exciting the SAW. Particularly, the shape of the most important (darker) contrasts, generated near the surface, varies significantly with this relative phase (a phase change is equivalent to a horizontal translation of a vertical line in figures 17 and 18). On the whole, the observations can be explained as a multi-trajectory diffraction phenomenon, with a similar nature as those previously studied by C. Malgrange and J. Gronkowski [16-17] in the case of a crystal submitted to a static constant strain gradient.
C. Relation between Section and Translation Images.
In the summation process of section images leading to a translation topograph, the contrast arises mainly from the darker contrasts present in each section topograph. The weaker ones are blurred in the summation process and create a grey background, but, in some instances, depending on geometrical considerations (case of figure 4 and of some others), they may contribute to the darker ones. As the gradients of the normal component are proportional to it, and as the density of the darker contrasts are dependant on the wave amplitude, the translation image contain essentially a representation of the normal component even if the relation between the density and the amplitude may be complex (cases of contrasts inversion etc...).
D. Experiments with large amplitude SAW.
Section topographs taken in the emitting track using a large excitation (many volts) but with similar diffraction conditions, as for figure 13, have revealed a new phenomenon. On figure 20, we observe that the large amplitude of the SAW produces an enlargement of the width of the first black fringe in the section topograph, which becomes practically proportional to the local amplitude, near the surface. This results from a kinematical diffraction process where the formation of the image becomes mostly governed by the local rotations of the lattice planes, when this rotation is large enough. This effect occurs when the strains, produced by the SAW, are too large to satisfy the hypothesis of small strains used to establish the equations of the dynamical theory of diffraction.
Then, the local rotation of the lattice planes deflects the diffracted beam, like a mirror with the light, so to enlarge the width of the most intense contrasts of the section topograph. We have already observed this effect in section topographs of bulk wave resonators [18] and shown that it permits a precise cartography of the vibration amplitude.
Figure 20. Bragg section topographs of large amplitude SAW with transverse variations (F=11.361376 MHz).
As observed in figures 4, 6, 7 and 8, the waves generated by the apodized transducers are not straight crested and the amplitude of the displacement varies rapidly in the transversal direction. Consequently the rotations of the lattice plane vary also rapidly with the transversal coordinate. Using sucessive section images, it is thus possible to determine precisely the radiation diagramm of the transducer.
Figure 21. Successive sections topographs taken in the emitting track of a filter submitted to a large electrical excitation.
Figure 21 represents five successive sections taken, in the emitting track, every 0.5mm in the vertical direction (1.46 mm in the propagation direction and on the film). The contrasts concerning the receiving track (low amplitude SAW) are similar to those previously shown and discussed (figures 13
and 20). It should be noticed that there is a large power ratio (15 to 20 dB) between the SAW exiting in the emitting track and those generated in the second track by the multi-strip coupler. We observe also that the weak contrasts generated by the strain extrema, existing in the depth of the substrate, along the incident wave, remain present for the high amplitude track but their shape is modified due to modifications of the X-ray trajectories produced near the surface by the rotations. In the emitting track, sufficiently inside the substrate, the strains remain weak and dynamical: multi-trajectory diffraction still occurs; so we have here an illustration of a continuous change from kinematical to dynamical diffraction when the strain level decreases.
IV. SECTION TOPOGRAPHS IN LAUE GEOMETRY AND
COMPARISON WITH COMPUTED IMAGES
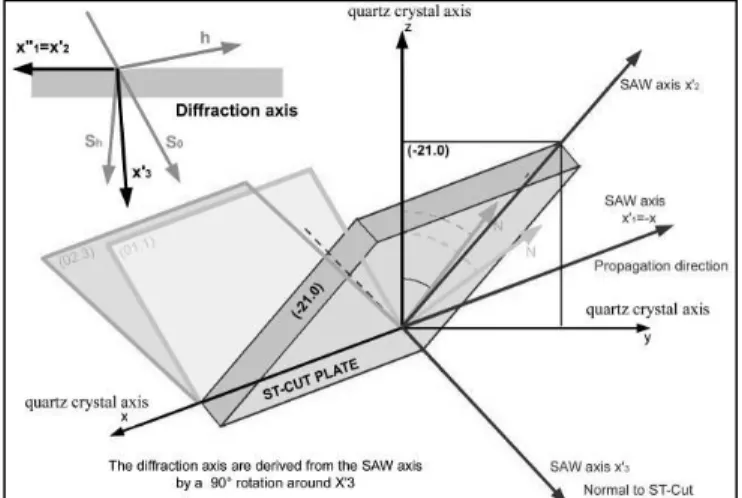
SAW propagating on lithium niobate are difficult to observe using the transmission setting due to the large X-ray absorption of niobium atoms and to the very large density of extended defects existing in the bulk of this material [1]. Quartz is very convenient for this kind of experiments because of the small absorption for small wavelength X-rays and the moderate density of extended defects. The in-plane components (u'1 and u'2 in the SAW axis) of the SAW propagating on ST-cut quartz were studied using the Laue geometry. More precisely the (-21.0) reflection (lattice plane normal to the x axis) is very convenient to obtain images produced by the gradients of the u'1 component. The (01.1)
and the (02.3) reflections were used to study essentially the u'2
component. Figure 22 shows the positions of these lattice planes relatively to the ST-cut plate and to the axis (x'1, x'2,
x'3) used to compute the SAW displacements. The diffraction
axis (x"1, x"2, x"3) used to compute the section images, in the
case of (01.1) or (02.3) diffraction, are also represented on this figure; their exact position is explained in the text for the different cases.
Figure 22. Position of the lattice planes used to image the in-plane components of the SAW propagating on ST-cut quartz.
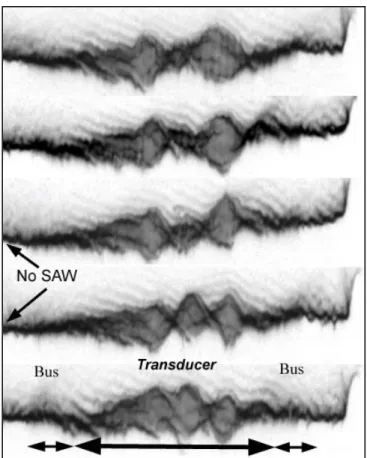
The section images, recorded using the (-21.0) reflection and an incidence plane defined by the x axis and the normal to the ST cut (x'3 axis in figure 22), are parallel to the wave crests
so that the section images do not contain very interesting information about the SAW. To obtain an image, that cut
several crests, the incidence plane was slightly rotated around the normal to the plate (#6.5°). In figure 23, slightly different excitations and exposure times are presented (F=11.361376 MHz).
Figure 23. Section topographs made using the (-21.0) reflection.
The black contrasts, situated near both edges of the section images, correspond to the positive and negative half waves of the SAW. Several dislocations are present and disrupt these contrasts. These images explain how, in the translation image of figure 12, corresponding to the summation of section topographs, each half wave generates similar contrasts. Section topographs made using the (01.0) reflection were obtained with an X-ray energy close to 17.4keV (Bragg angle about 6°05'19"). In this case the X-ray axis were derived from the SAW axis (x'1, x'2, x'3) of figure 22 making a rotation of
82° around the normal of the ST-cut, so to be essentially sensitive to the gradients of the u'2 displacement. A single
section topograph is presented in figure 24 (F=9.507840 MHz). This image was obtained using the same delay line presented in figure 12. This sample contains a moderate density of dislocations but some of them, situated close to the surface and close to each other interact strongly with the SAW and cause a frequency doubling effect (D in figure 12).
Figure 24. Laue section image obtained using the (01.1) reflection.
In figure 24, details (part a and part b) of the section are enlarged and compared to the simulated image computed, supposing a peak normal displacement of 100Å. This indicates that the contrasts, present in the experimental image, are very sensitive to the defects existing in the sample and to the instantaneous local amplitude of the SAW, which varies along the SAW path due to velocity (phase) variations, probably induced by the defects. Several simulations, computed with
different amplitudes and different departures from the exact Bragg angle (ΔΘ in equation {1}), have shown that the contrasts present in the image are also sensitive to these parameters and that the u3 instantaneous peak amplitude in the
delay line was comprised between 50 and 100Å depending on the position. The contrasts, present in these images, are constituted by modifications and modulations of the Pendellosüng fringes.
The u'2 component of the SAW propagating on ST cut
quartz in the x1=x'1 direction was also imaged using the (02.3)
reflection (figure 25). An incidence plane (x''1Ox"3) obtained
from the saggital plane x'1Ox'3 by a 90° rotation around
x'3=x"3 was used.
Figure 25. Laue section image obtained using the (02.3) reflection.
These images, obtained with the same sample as for figures 12 and 24 and a similar X-ray wavelength close to those of Mo Kα, are very sensitive to the strain associated to the
defects, to those produced along both surfaces by the polishing and etching techniques and to those due to the metallic thin films constituting the transducer. A detailed examination of the image indicates, as for figure 24, that velocity (phase) variations exist along the SAW path. The corresponding variations of the instantaneous amplitude along the section image are observed considering the eccentricity of the elliptical or circular fringes appearing in the center of the section (see figure 26).
Figure 26. Parts of section images computed with various u3 peak amplitudes
[(a)=10Å, (b)= 20Å, (c)= 50Å; F=9.507840MHz].
These velocity variations seem to be related to the existence of bundle of dislocations situated near the surface (D in figure
12). The frequency doubling phenomenon observed in figure 12 occurs also near these dislocations. Both effects are most probably due to non linear elastic effects induced by the static stress field of the dislocations. The examination of figures 25 and 26 also shows that, the summation leading to the "translation” images will not produce equal contrasts for the positive and negative half waves.
V. CONCLUSION
X-ray topography is an accurate and sensitive method to image the strain fields created by surface or bulk acoustic waves. The time structure of the synchrotron radiation allows observing progressive waves. The previous studies of SAW devices, using synchrotron radiation, have mostly considered reflection topographs recorded with a diffraction vector, close to the normal to the surface, and wide parallel X-ray beams. We have observed that these images, called translation topographs, are most often good maps of the normal displacement of the SAW near the surface provided that appropriate diffraction conditions are chosen. This has been explained, in the present paper, considering the properties of more fundamental diffraction images, the so-called section topographs, obtained with extremely narrow X-ray beams and considering the "translation" images a a continuous sum of overlapping section images. Experimental section images of crystals, where low amplitude SAW are propagating, were recorded and compared to simulations. We have observed that the section topographs are much more complex than the translation topographs and that they contain much more information about the SAW. The Bragg section images of low amplitude SAW give, in a simple manner, information about the depth dependence of the normal displacement but only the most intense contrasts produced by the displacement gradients existing near the surface, are dominant in the summation leading to the translation images. These gradients are proportional to this displacement. The translation images are thus essentially, at a phase factor, a representation of the value near the surface, of the component of the displacement situated along the diffraction vector.
Using the Laue geometry and diffraction vectors close to the propagation direction or to the normal to the sagital plane, the in-plane components of the SAW can be observed and their spatial variations estimated using simulations. Small velocity (phase) variations most probably induced by the dislocations existing in the synthetic quartz crystals, were observed in the sections images.
The Bragg section images of large amplitude SAW propagating on YZ LNB display features that allow a simple determination of the emission diagram of the apodized transducers. This results of a kinematical diffraction mechanism [5-18] which appears at large strains and is mostly sensitive to the local rotations of the diffracting lattice plane and thus to the local amplitude.
Acknowledgment
The authors acknowledge the contribution of Alain Jeanne-Michaud of our laboratory, to the the processing of the many topographs presented in this paper. Most of the X-Ray
topography experiments have been performed at ESRF (beam lines ID19 and BM05). The staff assistance is acknowledged.
REFERENCES
[1] B. Capelle, J. Detaint,Y. Epelboin. Crystalline quality of the trigonal piezoelectric materials and effects of the extended defects IEEE Trans. UFFC v. 59 n°5 pp. 1013-1022 (2012).
[2] B. Capelle, Y. Epelboin, A. Soyer, J. Détaint. Observation of surface acoustic waves using synchrotron radiation X-ray topography. Proc. 2012 IEEE Intl. Freq. Control Symposium pp. 1-6 (2012).
[3] R. W. Whatmore, P. A. Goddard, B. K. Tanner, G. F. Clark. "Direct imaging of traveling Rayleigh waves by stroboscopic x-ray topography". Nature. v. 299, pp. 44-46 (1982).
[4] A.Zarka, B. Capelle, M. Pilard, J. Schwartzel, J. Detaint & M. Solal. " An Analysis of the S.A.W. Displacements in Quartz and Lithium Niobate by X-ray Topography". Proc. 1994 IEEE Int. Freq. Control Symposium. pp. 315-322. (1994).
[5] A. Authier. Dynamical theory of X-ray diffraction. IUCR-Oxford Science Publication. Revised Edition 2004.
[6] S. Takagi. A Dynamical Theory of Diffraction for a Distorted Crystal, Journal of the Physical Society of Japan, v. 26, pp. 1239-1253 (1969). [7] D. Taupin, Bulletin de la Société de Cristallographie de France, v. 57,
pp. 469-511 (1964).
[8] A.R. Lang. The projection topograph: a new method in X-ray diffraction microradiography. Acta Cryst. v. 12 n° 3 p.249-250 (1959)
[9] A.R. Lang. A method for the examination of crystal sections using penetrating characteristic X radiation. Acta Met. v. 5 n° 7 p.358-364 (1957)
[10] M. Feldmann and J. Henaff. Traitement du signal par ondes elastiques de surface. Edition Masson. Paris. (1986).
[11] C. Maerfeld. Multistrip Couplers. Wave Electronic. v. 2, pp. 82-110. (1976).
[12] D. Royer, E. Dieulesaint. Ondes Elastiques dans les Solides (tomes I et II). Edition Elsevier-Masson; Paris 1999.
[13] J. J. Campbell, W. R. Jones. A Method for Estimating Optimal Crystal Cuts and Propagation Directions for Excitation of Piezoelectric Surface Waves. IEEE Trans. Sonics Ultrasonics v. SU15, n° 4, pp. 209-217 (1968)
[14] Y.Epelboin. Simulation of X-ray topographs. Materials Science and Engineering. v. 73. pp. 1–43. (1985)
[15] V. Mocella and Y. Epelboin; "White-beam topography of Rayleigh waves: a numerical study". Appl. Cryst. v. 32, p. 154-159. (1999). [16] C. Malgrange, J.Gronkowski. Fraunhofer Diffraction of X-Ray Beams at
Bragg Incidence in Distorted Crystals. J. Phys. Stat. Sol. (a) v. 85 n° 1. pp. 389-397. '(1984)
[17] C. Malgrange, J. Gronkowski. Propagation of X-ray beams in distorted crystals (Bragg case). I. The case of weak deformations. Acta Cryst. v. A40, pp. 507-514. (1984).
[18] B. Capelle, J. Detaint, Y. Epelboin. New contrasts of piezoelectric devices using synchrotron stroboscopic section topography at ESRF. J. Appl. Cryst. v. 34, n° 5 p. 625-629 (2001).
![Figure 8. Image of a similar SAW filter obtained with a smaller incidence angle [Same type of filter, same reflection, θ=15°; F=34.084148 MHz]](https://thumb-eu.123doks.com/thumbv2/123doknet/15015447.680902/5.918.70.438.81.575/figure-image-similar-filter-obtained-smaller-incidence-reflection.webp)
![Figure 26. Parts of section images computed with various u 3 peak amplitudes [(a)=10Å, (b)= 20Å, (c)= 50Å; F=9.507840MHz]](https://thumb-eu.123doks.com/thumbv2/123doknet/15015447.680902/10.918.77.423.815.1034/figure-parts-section-images-computed-various-peak-amplitudes.webp)
