HAL Id: hal-02180072
https://hal.sorbonne-universite.fr/hal-02180072
Submitted on 11 Jul 2019
HAL is a multi-disciplinary open access
archive for the deposit and dissemination of sci-entific research documents, whether they are pub-lished or not. The documents may come from teaching and research institutions in France or abroad, or from public or private research centers.
L’archive ouverte pluridisciplinaire HAL, est destinée au dépôt et à la diffusion de documents scientifiques de niveau recherche, publiés ou non, émanant des établissements d’enseignement et de recherche français ou étrangers, des laboratoires publics ou privés.
High frequency stimulation of normal and blind mouse
retinas using TiO2 nanotubes
Carole Ronzani, Thomas Cottineau, Irene Gonzalez-Valls, Valérie Keller,
Serge Picaud, Nicolas Keller, Michel Joseph Roux
To cite this version:
Carole Ronzani, Thomas Cottineau, Irene Gonzalez-Valls, Valérie Keller, Serge Picaud, et al.. High frequency stimulation of normal and blind mouse retinas using TiO2 nanotubes. Advanced Functional Materials, Wiley, 2018, 28 (50), pp.1804639. �10.1002/adfm.201804639�. �hal-02180072�
High frequency stimulation of normal and blind mouse retinas using TiO2 nanotubes
Carole Ronzani, Thomas Cottineau, Irene Gonzalez-Valls, Valérie Keller, Serge Picaud,
Nicolas Keller, Michel Joseph Roux*
Dr. C. Ronzani 1#, Dr. T. Cottineau 2, Dr. I. Gonzalez-Valls 2§, Dr. V. Keller 2, Dr. S. Picaud 3, Dr. N. Keller 2, Dr. M. J. Roux 1
1 Institut de Génétique et de Biologie Moléculaire et Cellulaire, Centre National de la
Recherche Scientifique, UMR7104, Institut National de la Santé et de la Recherche Médicale, U1258, Université de Strasbourg, 67404 Illkirch, France
E-mail: mjroux@igbmc.fr
2 Institut de Chimie et Procédés pour l'Énergie, l'Environnement et la Santé (ICPEES), UMR 7515, CNRS, Université de Strasbourg, Strasbourg, France
3 Sorbonne Université, INSERM, CNRS, Institut de la Vision, 17 rue Moreau, F-75012 Paris, France
# Present address: Laboratoire de Conception et Application de Molécules Bioactives, UMR7199, Faculté de Pharmacie, 67404 Illkirch, France
§ Present address: FUELIUM, campus Universitat Autonoma de Barcelona (UAB), 08193 Bellaterra (Barcelona), Spain
Keywords: Artificial Retina; Photoactive materials; TiO2 nanotubes; Light Sensor; Neuronal
With three models in commercial use, artificial retinas are the most concrete hope to restore sight to blind patients, notably those affected with retinitis pigmentosa. However, present architectures are costly to produce, while the restored visual acuity remains below the legal threshold for blindness.Furthermore, the complexity of current systems with tethered application-specific integrated circuits (asics) requires complex surgeries, with risks of complications and failures. In our search for new nanomaterials, we demonstrate that, when placed in contact with photoreceptors (control mouse retinas) or directly with bipolar cells (rhodopsinP23H mouse retinas, a model of retinitis pigmentosa), films of vertically aligned anatase titanium dioxide (TiO2) nanotubes can drive the activity of the retinal network for
stimulation frequencies up to the video rate (25 Hz), in response to short (5-20 ms), small (50-100 µm) light spots. Acting as continuous arrays of electrodes, these films should allow a fine tuning of prosthetic stimulations, through modulation of the spot size, duration and precise localization over the implant surface.
1. Introduction
Retinitis pigmentosa (RP) and age-related macular degeneration (AMD) are retinal
degenerative diseases affecting photoreceptors and leading to blindness for more than 15 million people worldwide. Various therapeutic strategies have emerged in the last decade. The development of efficient vectors has opened the possibility of gene therapy in early stages of Leber Congenital Amaurosis, when photoreceptors are still alive.[1] Some mutation-independent approaches,based on protective factors or optogenetics, are at the preclinical level or in early clinical trials.[2] Cell therapy is also a promising field, with successful incorporation
of stem cell-derived photoreceptors in mouse retinas.[3]
Compared to these emerging therapies, the retinal prosthesis approach, despite its science-fiction human/machine interface flavor, has a long standing use in clinics. It is based on the
electrical stimulation of inner retinal neurons, which remain functional for decades after the loss of vision, i.e. after photoreceptor degeneration in patients. Since the implantation of pioneer prototypes in the early 2000’s,[4] three models have obtained FDA and/or CE approval for
commercial implantation.[5] They all rely on discrete architectures, composed of either large
metal electrodes (Argus® II, IRIS® II), or small silicon-based photodiodes (alpha AMS, Stanford / Pixium PRIMA® model) connected to metal electrodes.[5b, 5e, 6] Clinical trials have demonstrated the lack of serious adverse effects following surgery and the long-term stability of the restored vision; however the regained visual acuity remains below the legal definition of blindness, with a perception insufficient for motion autonomy, face recognition and reading ability.[5a, 5c, 7]
Compared to discrete architectures, continuous films that can act both as photon collectors and electrodes present the advantages of maximizing the surface dedicated to light gathering, together with a flexible adaptation of the electrode array to the local responsiveness of the retinal network, as the electrode distribution and size are not fixed by the initial design, but can be tuned through the stimulation patterns. Such films based on either metal nanoparticles (HgTe, PbSe-Si),[8] carbon nanotubes,[9] TiO2 rutile nanowires [10] or organic photosensitive polymers
(poly(3-hexylthiophene), P3HT)[11] have been tested in vitro, ex vivo and even in vivo for the two latter.The use of Hg- or Pb-containing nanoparticles would be problematic in vivo due to the toxicity of these metals. While P3HT could efficiently be used to stimulate isolated neurons up to 10 Hz in response to green light, responses on ex vivo retinas were obtained after a rather long delay (70-100 ms) and lasted for hundreds of ms following a single 10 ms flash, characteristics which would prevent the use of stimulations at frequency higher than 1 Hz.[11b] The implantation of a TiO2 rutile nanowire film restored the pupillary light reflex in the mouse
stimulations.[10] So, while promising, it is not clear yet if these approaches can offer the spatiotemporal resolution required for an efficient retinal prosthesis.
Titanium dioxide (TiO2) is one of the most frequently investigated oxide semi-conductors for
solar to chemical energy conversion and photocatalytic reactions owing to its inherent physico-chemical properties, such as good charge carrier mobility and a band gap of 3.1 eV, that allows the use of the UV part of the solar spectrum ( < 400 nm). In addition, TiO2 has a low synthesis
cost and possesses an excellent (photo-)chemical stability in a large range of pH under working conditions. Recent advances in the nanostructuration of TiO2 materials and thin films have
broadened the field of applications,[12] among which solar cells, water-splitting, air and water environmental remediation or self-decontaminating surfaces.[13] TiO
2 is also used as a coating
for bone and dental implants thanks to its good biocompatibility and improved osteogenesis compared to other surface materials.[14]
Whatever the field of application, given that the solar photoconversion efficiency of TiO2 is
classically defined by the density of the photogenerated charge carriers (electron and holes), that usually exhibit relatively fast recombination rates, efforts have been devoted to the extension of the life time of the generated charge carriers. Among the numerous approaches investigated, the modification of the nanomaterial shape, and especially the development of one-dimensional materials is highly promising. Notably, vertically aligned TiO2 nanotube thin
films have attracted a considerable interest for solar cells and other photoconversion applications, due to their unique morphology/architecture compared to non-oriented granular structures.[13g, 15] They take advantage of: i) enhanced light absorption rates due to reduced screening effect and light diffusion ; ii) lower recombination rates due to the nanotube wall thickness being smaller than the minority charge carrier (holes) mean free path (Ldh+ ≈ 10 nm
path than in particle films, and to less grain boundaries acting as recombination centers ; and iii) good diffusion of the liquid phase, due to the absence of any microporosity in the film.[16] Here we demonstrate that micrometer-size thin films of vertically aligned anatase TiO2
nanotubes (NT) concentrate within a single oxide material layer both photosensitivity and neuronal stimulation. This bi-functionality would allow the sole implantation of a photosensitive matrix within the eyeball, with no external energy supply besides light.
We have characterized the photoresponse of TiO2-NTs, and how they can drive retinal activity,
either on control mouse retinas or on those of rhodopsinP23H mice, a model of retinitis
pigmentosa. Short (5-20 ms), small (50-100 µm diameter) UV-A flashes reproducibly elicit
ganglion cell activity over a large frequency range (0.1–25 Hz) in both types of retinas, the response latency decreasing and the mean number of action potentials increasing with higher flash energy. Pharmacology indicated that in most cases recruitment of ganglion cells was indirect, as expected for a subretinal array.
2. Results and Discussion
2.1. Synthesis and characterization of TiO2-NTs array films
Titanium dioxide nanotubes (TiO2-NTs) were synthesized either on conductive glass (NT/FTO)
or on metallic titanium (NT/Ti) according to an electrochemical anodization method optimized in order to obtain the maximal photocurrent under solar irradiation, as described in previous work.[17] In summary, an anodic potential is applied to the titanium in an electrolyte containing fluoride ions and the growth of the nanotubes results from an equilibrium between electrochemical TiO2 formation and its dissolution by fluoride ions according to Equation 1 and 2:
TiO2 + 6 F- + 4 H+ → [TiF6]2- + 2 H2O (2)
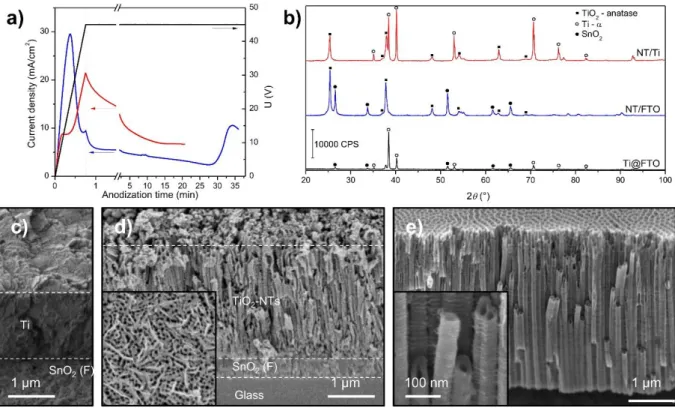
For NT/Ti, the titanium source is the Ti foil itself, for NT/FTO we first deposited a layer of Ti by magnetron sputtering on the FTO. Typical anodization curve of the two kind of support is reported in Figure 1a. It can be observed that the current is increasing at the beginning of the experiment when the electrode is polarized to 45 V. The peak (shoulder in the case of NT/Ti) appearing at approximately 30 s corresponds to the electrical formation of a dense TiO2 layer
that slows down the reaction before the etching by F- starts to be significant enough to make new metallic Ti available for oxidation. The difference between the two curves can be explained by the different composition of the electrolyte used to take into account the specificity of each substrate (see details in the Experimental Section). When the potential is stabilized at 45 V, the current slightly decreases and tends to a plateau. For NT/Ti samples the anodization is stopped when the charge transferred reaches 5 C.cm-2, corresponding to a nanotube length of 4 μm. This length was chosen since it was reported to give the optimal efficiency for photocatalytic degradation and photoelectrochemical application.[18] For NT/FTO, the anodization is stopped
when all the deposited titanium is oxidized and the electrode becomes transparent. This corresponds to the current increase visible at the end of the experiment (Figure 1a).
The X-ray diffractograms of NT/Ti, NT/FTO and Ti sputtered on FTO glass (Ti@FTO) are shown in Figure 1b. For NT/Ti and Ti@FTO, the patterns reveal the presence of titanium α-phase, strongly oriented along the [00l] direction. The peaks characteristic of SnO2 are detected
for both NT/FTO and Ti@FTO. After anodization, the NT/FTO sample no longer exhibits the peaks of Ti-α, suggesting its total consumption during the anodization process. Instead, after thermal annealing, the characteristic diffractogram of anatase TiO2 can be observed. For NT/Ti
samples, the peaks of anatase are also visible after anodization and annealing along with the peaks of Ti-α from the metallic foil. In both cases, none of the peaks associated to the rutile phase is observed.
Scanning Electron Microscopy (SEM) images were taken on a side of the samples at an angle of 45°. As illustrated in Figure 1c, the Ti deposited on FTO consists of a film of 2.0 ± 0.1 μm thickness. After anodization, the nanotubes grown on FTO have a length of 3.4 ± 0.2 μm. As observed from a top view (inset in Figure 1d), NTs have an internal diameter of 52 ± 7 nm. The nanotubes synthesized from a Ti foil present a more defined morphology and a length of 4.0 ± 0.2 μm (Figure 1e). This difference can be explained by the better compactness of the Ti in a foil compared to a film deposit on FTO.
2.2. Light-Induced TiO2-NT polarization
The films of vertically aligned TiO2-NTs were first characterized in an acellular context, to
determine the kinetics and amplitudes of the light-evoked changes in surface potential, as well as their reproducibility / stability depending on the stimulus frequency. TiO2-NT films were
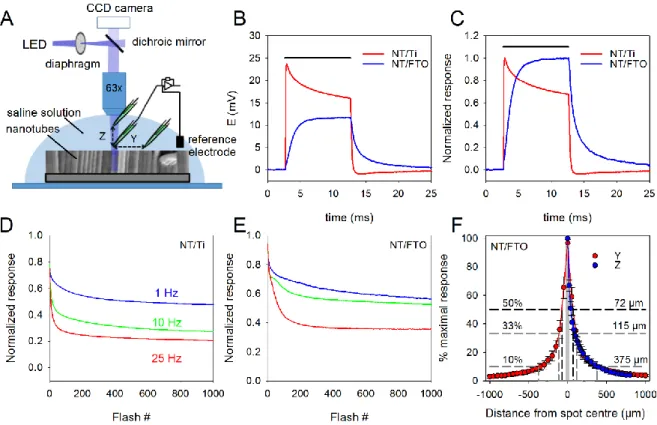
placed in the recording chamber of a patch-clamp setup filled with a phosphate-buffered saline solution (PBS), as schematized in Figure 2A. A patch pipette was then placed next to the
surface, visualized classically through transmitted light for the NT/FTO transparent films, or through reflected light for NT/Ti opaque films, thanks to a 50/50 dichroic filter. Light flashes (10 ms duration, 50 µm diameter) were delivered, focused through a 63x water-immersion lens onto the surface of the NTs. Despite their difference in synthesis and in surface morphology, both type of TiO2-NTs films responded to light with similar depolarization amplitudes (Figure
2A, 365 nm light, 33 mW/mm2), with however a difference in kinetics: NT/Ti presented a fast rising depolarization, with a peak reached ~0.5 ms after flash onset followed by a two-exponential decay (time constants of 0.7 and 6 ms), while NT/FTO had a much slower response, barely peaking before the end of a 10 ms flash (9.4 ms). The repolarization time-course differed also significantly between the two types of NTs: NT/Ti presented a fast decay (time constant: 0.18 ms) with a slight overshoot followed by slow stabilization toward baseline (time constant:
8.2 ms), while NT/FTO had a two-exponential decay (time constants of 0.81 and 5.7 ms, accounting respectively for 74 and 26% of the total amplitude). Raw and normalized representative traces for both types of NTs are shown in Figure 2B-C. Such dissimilarities in kinetics may be attributed to different defects at the surface of the TiO2 and/or to the different
electronic contact at the substrate/TiO2 interface. It also suggested that the two materials may
differ in their responses to trains of flashes, especially at high frequencies. We thus delivered trains of 1000 flashes at 1, 10 or 25 Hz. The recorded depolarizations progressively decreased in amplitude with flash repetition for both NT/Ti and NT/FTO (Figure 2D-E). The decrease was however not as marked for NT/FTO than for NT/Ti, especially at 10 and 25 Hz. This led us to use NT/FTO for further experiments involving mouse retinas. Another important aspect to consider was the spatial distribution of the light-induced depolarization. The recording pipette was moved either horizontally away from the spot center or vertically away from the focal plane. For both NT/Ti and NT/FTO, the depolarization amplitude was constant in the illuminated area, and dropped sharply when the pipette exited the light spot, with superimposable curves for movements along the Y and Z axis (Figure 2F for NT/FTO). This suggests that the depolarization occurred only in the illuminated area and did not propagate in neighboring, non-lit NTs, but dissipated in the conductive saline solution. Thus, TiO2-NT films
act as flexible stimulation arrays, with position and size of the electrodes determined by the illumination pattern.
2.3. TiO2-NT mediated ganglion cell activity in control retinas and in a model of retinitis
pigmentosa
We then tested the capacity of NT/FTO to stimulate the retinal network in response to light. We used either wild-type (WT) retinas from C57Bl/6J mice, or those from rhodopsinP23H knock-in
both cases, the outer face of the retina was placed in contact with the NTs: photoreceptors for WT retinas and bipolar cells for P23H retinas, in which most of the photoreceptors have degenerated in the age-range considered here (Figure 3). The firing pattern of ganglion cells was monitored using the loose-patch configuration, in which an extracellular electrode is placed in contact with the cell membrane. This allows the stable detection of action potentials over time with a minimal disturbance of the recorded neuron. Light flashes, centered on the targeted ganglion cell, were then delivered, at frequencies ranging from 0.1 to 25 Hz, durations ranging from 5 to 20 ms, and energies ranging from 0.8 to 90 mW/mm2. As the retinas were prepared in ambient light (see Experimental Section), and that the electrophysiology setup was not blinded, we were expecting to have no natural light response, due to photobleaching. Accordingly, flashes delivered with a white LED evoked no change in the TiO2-NT surface
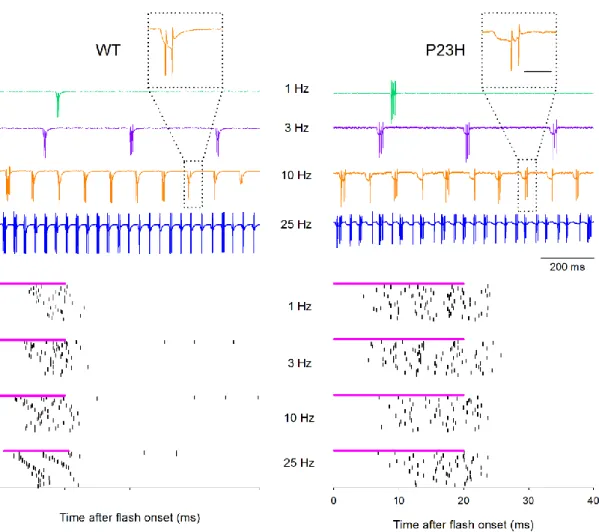
potential and had no effect on the ganglion cell activity. On the other hand, UV-A (365 nm) flashes reproducibly evoked ganglion cell activity in both genotypes, as shown in Figure 4 for bursts of 30 flashes delivered at the frequencies of 1, 3, 10 and 25 Hz. The evoked firing patterns were comparable in WT and P23H retinas. However, evoking a reproducible response in ganglion cells generally required larger (100 µm vs. 50 µm diameter) and longer (20 ms vs. 10 ms) light flashes in P23H compared to WT retinas. Moreover, the energy required to evoke stable responses increased with the stimulus frequency for both genotypes (data not shown). While most ganglion cells from WT retinas responded with a single burst of action potentials, the response profile could differ in the burst duration and in the spike number per burst (Figure 5A, a and b). For 1 Hz stimulations, the mean response latency for WT ganglion cells was 21.6 ± 9.9 ms (n = 59). Among these cells, 28 were stimulated with 10 ms flashes, responding with a latency ranging from 8.7 to 61.8 ms, and with a firing ranging from a single action potential to 87.2 ms bursts, averaging up to 10.5 spikes. 31 other cells, stimulated with 20 ms flashes,
responded within a similar latency range, from 10.6 to 48.3 ms, and with a firing ranging from a single action potential to 108.9 ms bursts, averaging up to 7.4 spikes.
A fraction of cells responded with two bursts of action potentials (Figure 5Ac). The latency of the first burst (18.2 ± 6.3 ms, n = 11) was comparable to the one of single burst cells, while the second burst occurred at a much longer delay (130.2 ± 46.9 ms, n = 8, 20 ms flashes). A fast and a delayed response types could not be separated. We rather observed a continuous distribution of both the burst latency and duration (Figure 5C), possibly due to the variability in the flash intensity required to get a systematic response from cell to cell, that can be attributed to a difference in the retina/TiO2 contact.
Ganglion cells from P23H retinas also responded with either a single burst (12/14 cells) or two distinct bursts (2/14 cells) (Figure 5B). The single burst latency (12.8 ± 5.2 ms, n = 12, ranging from 4.1 to 22.9 ms) was shorter (p = 0.002) than for WT ganglion cells, with no evident separation between fast and delayed cells (Figure 5D). The mean burst duration was 36.4 ± 52.4 ms (n = 12, from 1.2 to 187 ms) for 20 ms flashes, with 5.1 ± 4.5 spikes/burst (from 1 to 14.2 action potentials).
In both genotypes, we performed a dose-response for some cells, increasing the flash energy from 0.8 to 33 mW/mm2. For both WT (n = 14) and P23H (n = 16) ganglion cells, there was a tendency to have a higher number of action potentials and a shorter latency for the first spike as the flash energy was increased (Figure 5E-H).
2.4. Network-mediated vs. direct activation of ganglion cells
Placement of a retinal prosthesis in the subretinal space is expected to result in the recruitment of bipolar cells, rather than a direct activation of ganglion cells, thus evoking more natural patterns of activity. If the peak of the light-evoked change in NT/FTO surface potential is reached around 10 ms after light onset, the 20-80% rise time for this material is around 1.5 ms.
As described above, most of the recorded cells responded with a latency around or superior to 20 ms in WT retinas and 13 ms in P23H retinas. This suggests that cells responded through activation of the retinal network upstream of the ganglion cells, possibly at the photoreceptor level in WT retinas and bipolar cells in P23H retinas. However, as can be seen in both the WT
and P23H panels of Figure 4 (insets), the light-evoked change in potential generated at the NT/FTO could be detected in some cases by the loose-patch electrode contacting the ganglion cell soma, indicating a direct impact on the cell membrane potential that could be sufficient to bring it to its firing threshold.
We thus could not exclude a direct activation of the ganglion cell by the TiO2-generated change
in extracellular potential. To verify if such activation was occurring, we applied CNQX, an AMPA/kainate receptor antagonist, to block excitatory inputs to ganglion cells. Out of 17 WT ganglion cells for which 50 µM CNQX was applied, 14 had their responses fully blocked (Figure 6A), while 3 had only the late part of the response blocked (Figure 6C). Similarly, most P23H ganglion cells (9/10) had their response fully blocked by CNQX (Figure 6B), one presenting a CNQX resistant component (Figure 6D). This component had a short latency (between 6.0 ± 3.0 and 9.3 ± 2.6 ms for the 3 WT cells, 4.8 ± 1.1 ms for the P23H cell). Thus, while some cellular responses resulted from a direct effect on the recorded cell, the majority of the ganglion cells responded as expected via the upstream activation of the retinal network. To estimate how the amplitude of the potential change evolved from the NT/FTO surface to the ganglion cell layer, we dipped a patch electrode at various depths (Figure 7A) in WT (n = 4) and P23H (n = 4) retinas, and compared the responses to the one obtained from the material alone. Counterintuitively, the potential in the photoreceptor layer of a WT retina (170 µm below the inner retinal surface) was ~9 times higher than the potential recorded at the surface of the material or in the inner nuclear layer of a P23H retina (90 µm below the inner retinal surface) over a large range of flash intensities (Figure 7B-C). The photoreceptor layer, with tightly
packed somas and an array of flexible segments in contact with the NT/FTO surface, may be expected to have a higher electrical resistance than the inner nuclear layer. The difference may even be higher compared to a P23H inner nuclear layer, due to partial bipolar cell degeneration, and possible increased damage during retinal harvesting.
2.5. Discussion
Present implementation of artificial retinas have a discrete geometry, composed of either large metal electrodes (Argus® II, IRIS® II), or small photodiodes (alpha AMS, Stanford / Pixium PRIMA® model) connected to metal electrodes, that reduce the surface that can be dedicated to light gathering, together with the associated asics. This prevents an optimal electrode placement compared to ganglion cells, and local adaptations depending on the state of the underlying retinal network, that may differ depending on the exact implant position, and from patient to patient. To circumvent these limitations, continuous materials that can act both as photoreceptors and electrodes have been explored, as films of mercury and tellurium nanoparticles,[8] which use would be problematic in vivo due to the toxicity of their components, or organic films of poly(3-hexylthiophene), that were efficient to stimulate isolated neurons in response to green light, but that evoked sustained activity with a rather long delay (70-100 ms) and for hundreds of ms following a single 10 ms flash, which would prevent the use of stimulations at frequency higher than 1 Hz.[11b] Very promising results were recently published
with the implantation of TiO2 rutile nanowire films, restoring the pupillary light reflex, but with
a stimulation frequency not higher than 0.5 Hz, too low for an efficient prosthesis.[10]
Anatase TiO2 nanotube filmsimprove on these previous approaches, combining a continuous
architecture with the capacity to evoke ganglion cell activity through the recruitment of the inner retinal network, at frequencies up to 25 Hz, both on WT mouse retinas and on those of a
murine model of retinitis pigmentosa, carrying the rhodopsin P23H mutation, in response to short (5-20 ms) and small (50-100 µm diameter) light spots.
While TiO2 has a long standing use in cosmetics, implants and as a food coloring, its
innocuousness in the form of nanoparticles, that could interact cellular organelles, is somewhat contested.[20] In TiO2-NT films, nanotubes have a micrometric length and are not independent,
but attached both to their neighbors and to the titanium support from which they were synthesized, limiting the risks associated to nanoparticles diffusing in the whole body. This is also an advantage compared to TiO2 nanowires obtained through hydrothermal synthesis, which
are not as regularly packed as nanotubes, and thus should be less resistant to mechanical stress, increasing the risk of nanoparticle detachment from an implant. It should be noted that an intense part of the research on TiO2-NTs is devoted to their use as a coating film on titanium
bone implants, as they enhance osseointegration compared to a non-structured TiO2 layer.[21]
The mechanical constraints to which an orthopedic implant must resist are well above those faced by a retinal prosthesis – the conditions in the eye are tightly regulated, with an intraocular pressure of 12-22 mm Hg (1.6-3 kPa) in the general population, well below the reported hardness of nanotubes.[22] Robustness of TiO2-NT films is also indicated by the fact that in the
present experiments, some of them were extensively used over periods of up to one year, with repeated contacts with retinas and platinum harps and subsequent cleaning, without noticeable decrease in stimulation efficacy.
The continuous architecture combined to the fact that TiO2 is conducting only when lit, are the
basis for a flexible prosthesis geometry, that can be customized after implantation, as neither the electrode size nor position are fixed. For instance, in the present experiments, each light spot could be centered on the recorded ganglion cells; for P23H retinas, which were less responsive than their WT counterparts, we could decide to increase the spot size from 50 to 100 µm, rather than increasing the light intensity. Similarly, implantation of a TiO2-NT based
prosthesis should be followed by an exploration of the stimulation patterns, sizes and intensities that are the most effective over the implant surface for a given patient. Together with clear advantages, this comes with an inherent drawback: the projection system to which such a prosthesis must be coupled cannot be a large screen on which the implant is sampling depending on gaze direction. To preserve the link between eye orientation and vision, the projected image will have to be constantly refreshed to match the optimal stimulation geometry of the retina / implant couple.
The two types of TiO2-NT films used in this study have clear limitations preventing their direct
use in patients: 1) they are only sensitive to the UV part of the light spectrum and 2) the decrease of the response amplitude with repeated or long stimulations, especially at high frequencies (Figure 2D-E), as also observed for poly(3-hexylthiophene) films and TiO2 rutile nanowires.[10, 11b] Both of these limitations should be overcome by future improvements in the synthesis of
light-responsive films, that is a fast-developing and stimulating research field linked to the search for higher yield solar cells and more globally for higher efficiency solar energy conversion materials.[23] Controlled physico-chemical modification of TiO2-NT films by
visible-light responsive material has allowed to obtain depolarizations of a few millivolts in response to white light, without diminishing the responsiveness to UV-A. Other improvements could come through deposition of metal nanoparticles such as silver or gold at the nanotubes surface, in order to improve the potential shift at the surface through a better charge separation in the semiconducting nanostructure, as used by Tang et al.[10] It will be important to determine the origins of the differences in rising and decaying time of the responses of TiO2-NT films
synthetized from a titanium foil or from sputtered titanium. A material combining the fast rising time of the first to the better stability of the second would allow for prolonged stimulations at the video rate.
Subretinal implantation is often presented as allowing a more natural processing than the epiretinal approach, as information is fed upstream in the retinal network. This point is however mostly theoretical, as present electrode size precludes a selective targeting of bipolar cells, thus sending the same message to distinct sub-networks, which may be confusing for the downstream processing steps. We have also observed that the change in potential generated at the surface of the “electrodes” does not only affect the neurons directly in contact (Figure 7). Even when the photoactive material is placed next to the photoreceptors, a fraction of the potential change reaches the ganglion cell layer, and thus also all the cell bodies and neurites in between. Thus the resulting response from a ganglion cell cannot be considered as equivalent to a natural response corresponding to the stimulation of a group of photoreceptors in WT retinas, or of bipolar cells in P23H retinas. It is rather a compound response, integrating this natural response with the stimulation and/or the facilitation of downstream elements, up to possibly a direct activation of the ganglion cell (Figure 6C-D). The flash intensity required to obtain a response with a success rate > 90% was quite variable from cell to cell and from retina to retina, ranging from 2.4 to 58 mW/mm2. Direct activation of ganglion cells (demonstrated by its resistance to CNQX, or deducted by the short response latency) was essentially observed at higher energies. Part of this variability can tentatively be attributed to differences between ganglion cell types, retinal eccentricity, and in possible local damage to the retinal network during dissection. However, as the retina was simply put onto the TiO2-NT film and maintained
in position with a platinum/nylon harp, a major source of variability could be the contact quality between the retina and the film. The lower energy thresholds for ganglion cell stimulation obtained with TiO2 rutile nanowires may indeed be due to their rougher, irregular surface
favoring a tighter retina/material interfacing, compared to the anatase TiO2 nanotube films used
in our study.[10] The material / neuron interaction can be influenced by the surface
nm, following our optimization of the synthesis parameters to maximize the photocurrent while preserving a good adherence of the NTs to the substrate.[18] In vivo implantation of arrays of NTs with various diameters, and subsequent characterization of the bipolar cell / NT interface, would help precise the optimal NT diameter, in the range of those that can be obtained while preserving large photocurrents and material robustness. Texturing the film surface, by either mechanical or laser ablation should allow getting a more uniform /improved contact both in
vitro and in vivo, without being detrimental to the nanotube attachment to the substrate. By
lowering the required flash energy, it would benefit both to the safety of the device and to the generation of more local stimulations, both in the retinal plan and along the Z axis, key elements for an artificial retina.[25]
3. Conclusion
Vertically aligned anatase TiO2 nanotube films have a fast response to light, with surface
depolarization sufficient to drive the activity of the retinal network, both in normal and blind mouse models, with stimulations up to a 25 Hz video frequency, much higher than those reported for other continuous films. Such architecture allows the use of flexible stimulation patterns that can be adapted to the local responsiveness of the degenerated retina after implantation. Further improvements should be achieved by i) texturing the film surface for a tighter neuronal / material interfacing and ii) physico-chemical modification of TiO2-NT films
by visible-light responsive material, to shift the sensitivity from UV-A to visible light. Given their low cost, the simplicity of their production and their (photo)chemical stability, we believe that vertically aligned anatase TiO2 nanotube films constitute a promising alternative for
artificial retina applications.
4. Experimental Section
The vertically aligned TiO2-NT thin films were synthesized either on Fluorine-doped Tin Oxide
(FTO) slides (6-8 , 2.2 mm thick glass, Solems) by a two-step process or on metallic titanium foils (MatecK GmbH, 99.9% Ti). Both type of synthesis have been separately investigated for establishing optimized synthesis parameters.[17] Briefly, for NT/Ti, the 125 µm thick metallic pieces were first cleaned by ultrasonication in acetone, ethanol and water for 5 minutes and then dried under N2 flow. The anodization was conducted in a two electrode cell using a Biologic
SP-300 potentiostat with a 48 V booster module. The counter and working electrodes were a platinum foil and the cleaned Ti foil, respectively. The electrolyte used for anodization was composed of ethylene glycol (99.5% Sigma-Aldrich) containing NH4F (0.3% w/w, from a 98%
solution, Sigma-Aldrich) and ultrapure water (1% v/v). The electrolyte temperature was maintained constant at 25°C during the synthesis. The anodization potential was raised to 45 V with a ramp of 1 V.s-1, it was then kept at 45 V until the charge transferred reached 5 C.cm-2 to obtain a reproducible nanotube length of 4 μm.
In the case of NT/FTO, a layer of metallic titanium with reduced porosity was deposited at 50°C by Physical Vapor Deposition (PVD) on FTO using a DC magnetron sputtering evaporator (Alliance concept DP650), operating at a pressure of 5.10-6 bar and a power density of 4.8 W.cm-2 with a metallic titanium target (Neyco, Ti 99.99%). Before titanium deposition, the
FTO slides were cleaned with soap, water, and ethanol, then dried under a N2 flow, and further
in-situ etched through Ar plasma for 30 s inside the 10-8 Torr vacuum-pumped PVD chamber. The sputtering conditions, corresponding to a deposition rate of 2.65 Å.s-1 were monitored to elaborate a 1 µm thick metallic Ti film. The second step of the synthesis consisted in the electrochemical anodization of the Ti layer for obtaining a vertically aligned TiO2 nanotube
thin film on the FTO slides.[12b] The anodization was conducted at 25°C and 45 V with the same electrochemical cell than for NT/Ti but using the FTO covered by the 1 µm thick Ti film as a working electrode. The ethylene glycol based electrolyte was slightly modified (3% v/v H2O
and 0.5% w/w NH4F). The potential was applied until the Ti top-layer was fully oxidized and
the substrate turned to be transparent again.
The TiO2 in both the NT/Ti and NT/FTO was amorphous; it was finally crystallized into anatase
via annealing at 450°C for 6 h under air flow.
Physico-chemical characterization of the vertically aligned TiO2 nanotube thin films.
The morphological analysis of the TiO2-NTs was conducted employing a Scanning
Electron Microscope (FEG-SEM, JEOL 6700F). SEM images were taken on a side of the samples at an angle of 45°. Dimensions were evaluated using the ImageJ software taking the mean value for the diameters and lengths of 10 NTs of each sample.
X-Ray Diffraction patterns were measured in a θ/θ configuration using a Bruker D8 equipped with a LynxEye PSD detector (Cu Kα λ = 0.15418 nm), in the 20 to 100° 2θ range.
Monitoring of light-response of TiO2-NTs films
TiO2-NTs films were placed in the recording chamber of a Leica DMLFSA microscope, filled
with Phosphate Buffer Saline (PBS, composed of (in mM): NaCl 154, NaH2PO4 2.5 and
Na2HPO4 56, pH 7.4). Light-flashes were delivered using 365 nm or UHP-white LEDs
(Prizmatix, Israel) placed on the fluorescence port of the microscope. The diameter of the spot was set at 50 or 100 µm with the fluorescence diaphragm, with a 63x NA 0.90 water immersion lens. The light energy in the focal plane was measured with a PM100USB energy meter coupled to a S170C photodiode (Thorlabs, France). Patch-clamp electrodes (5-10 M) were pulled from borosilicate glass (Harvard Apparatus, France) using a DMZ universal puller (Zeitz, Germany), and filled with PBS. Changes in TiO2-NT surface potential were monitored by placing the tip
of the electrode close (≤ 2 µm) to the film, at the center of the light spot. Stimulus parameters and voltage recordings were controlled through a Digidata 1322A interface and a MultiClamp 700B amplifier, commanded through the pClamp 9 software (Molecular Devices, USA);
electrode position was set using a LN-25 micromanipulator controlled through an SM-5 interface (Luis & Neumann, Germany)
Loose-patch recording of ganglion cell activity
Procedures involving animals and their care were conducted in agreement with the ARVO statement for the use of animals in vision research, the French Ministry of Agriculture and the European Community Council Directive no. 86/609/EEC, OJL 358, 18 December 1986, and by the IGBMC Ethical committee. Wild-type C57Bl/6J mice (Charles River, Saint-Germain-Nuelles, France) and rhodopsinP23H knock-in mice (Jackson Laboratory, USA) were maintained in a room with controlled temperature (21–22 °C) under a 12–12 light-dark cycle with ad libitum access to food (standard rodent chow D04, UAR, France) and water. Light-adapted mice (2-6 month-old) were killed by cervical dislocation. All following steps were performed in normal lab lighting conditions (200-400 lux on the lab bench). The eyes were enucleated and immediately put in bicarbonate-buffered saline (BBS, composed of in mM: NaCl 126, KCl 2.5, CaCl2 2.4, MgCl2 1.2, NaH2PO4 1.2, NaHCO3 18, glucose 11) previously bubbled with 95% O2
/ 5% CO2. The cornea, lens and vitreous were removed; the retina was detached from the
pigmented epithelium and incubated with collagenase type I (720 µg/ml) and hyaluronidase (2 mg/ml) (Worthington, USA) for 15 minutes to help remove vitreous remains. The retina was then placed with its outer face in contact with the TiO2-NTs, and held with a platinum / nylon
“harp”. To limit retinal damage by the nylon threads, the retina was surrounded by a square cut in either a nitrocellulose membrane (AAWP02500, Millipore, France) or a nylon net (NY6H02500, Millipore, France), which thickness was close to those of WT or photoreceptor-less retinas, respectively. Room-temperature BBS was continuously perfused at 2 ml/min. The light level in the empty recording chamber was approximately 20 lux. The retina was visualized using the white LED (2.5 mW/mm2) with a full-field illumination, with the 5x and 63x lens.
smallest spot (50 µm diameter), and the ganglion cell positioned at the center of the stimulated zone. To record ganglion cell activity, the inner limiting membrane was first punctured with a glass electrode, through which BBS was pressure-ejected. A clean patch electrode was then brought into contact with one of the exposed ganglion cell somas, to form a seal of resistance ≥ 100 M. The retina was then stimulated with one of the two LEDs.
The competitive AMPA/kainate receptor antagonist CNQX (6-cyano-7-nitroquinoxaline-2,3-dione) was purchased from Abcam (Cambridge, UK) .
Acknowledgements
This work was supported by grants from the Conseil Régional d’Alsace Oseo (A1005007 AFM/A1005007A), CNRS, the Agence Nationale de la Recherche (ANR-12-BS10-017) to M.J.R. and N.K., Neurex to M.J.R., and by the grant ANR-10-LABX-0030-INRT, a French State fund managed by the Agence Nationale de la Recherche under the frame program Investissements d’Avenir ANR-10-IDEX-0002-02. CR performed the ex vivo electrophysiology experiments and analyzed the data, TC and IGV performed synthesis and physical characterization of NT films, NK, VK, SP and MJR conceived the project, MJR analyzed the data and wrote the manuscript.
Conflict of Interest
TC, VK, SP, NK and MJR are inventors of the patent “Artificial retina that includes a photovoltaic material layer including a titanium dioxide semiconductor” (N. Keller, P. Bernhardt, M. Roux, A. Robé, M.V. Shankar, S. Picaud, M.J. Ledoux, V. Keller-Spitzer, T. Cottineau, CNRS/Université de Strasbourg), under references US2013023986A1; EP2509551A1; WO2011070288A1; FR2953394A1.
The table of contents entry :
When put in contact with retinas, films of vertically aligned anatase titanium dioxide
(TiO2) nanotubes can drive the retinal network activity in a large range of frequencies
(up to 25 Hz), using small (50-100 µm), short (5-20 ms) light pulses. They could thus become the base of an efficient, low-cost retinal prosthesis.
Keywords: Artificial Retina, Photoactive materials, TiO2 nanotubes, Light Sensor, Neuronal
stimulation
C. Ronzani, T. Cottineau, I. Gonzalez-Valls, V. Keller, S. Picaud, N. Keller, M. J. Roux*
Title High frequency stimulation of normal and blind mouse retinas using TiO2 nanotubes
ToC figure ((Please choose one size: 55 mm broad × 50 mm high or 110 mm broad × 20 mm high. Please do not use any other dimensions))
BIBLIOGRAPHY
[1] a) A. M. Maguire, K. A. High, A. Auricchio, J. F. Wright, E. A. Pierce, F. Testa, F. Mingozzi, J. L. Bennicelli, G. S. Ying, S. Rossi, A. Fulton, K. A. Marshall, S. Banfi, D. C. Chung, J. I. Morgan, B. Hauck, O. Zelenaia, X. Zhu, L. Raffini, F. Coppieters, E. De Baere, K. S. Shindler, N. J. Volpe, E. M. Surace, C. Acerra, A. Lyubarsky, T. M. Redmond, E. Stone, J. Sun, J. W. McDonnell, B. P. Leroy, F. Simonelli, J. Bennett, Lancet 2009, 374, 1597; b) F. Testa, A. M. Maguire, S. Rossi, E. A. Pierce, P. Melillo, K. Marshall, S. Banfi, E. M. Surace, J. Sun, C. Acerra, J. F. Wright, J. Wellman, K. A. High, A. Auricchio, J. Bennett, F. Simonelli, Ophthalmology 2013, 120, 1283.
[2] a) V. Busskamp, J. Duebel, D. Balya, M. Fradot, T. J. Viney, S. Siegert, A. C. Groner, E. Cabuy, V. Forster, M. Seeliger, M. Biel, P. Humphries, M. Paques, S. Mohand-Said, D. Trono, K. Deisseroth, J. A. Sahel, S. Picaud, B. Roska, Science 2010, 329, 413; b) L. C. Byrne, D. Dalkara, G. Luna, S. K. Fisher, E. Clerin, J. A. Sahel, T. Leveillard, J. G. Flannery, J Clin Invest 2015, 125, 105; c) D. Dalkara, J. Duebel, J. A. Sahel, Curr Opin Neurol 2015, 28, 51; d) E. Macé, R. Caplette, O. Marre, A.
Sengupta, A. Chaffiol, P. Barbe, M. Desrosiers, E. Bamberg, J. A. Sahel, S. Picaud, J. Duebel, D. Dalkara, Mol Ther 2015, 23, 7.
[3] J. Assawachananont, M. Mandai, S. Okamoto, C. Yamada, M. Eiraku, S. Yonemura, Y. Sasai, M. Takahashi, Stem Cell Reports 2014, 2, 662.
[4] a) A. Y. Chow, V. Y. Chow, K. H. Packo, J. S. Pollack, G. A. Peyman, R. Schuchard,
Arch Ophthalmol 2004, 122, 460; b) M. S. Humayun, J. D. Weiland, G. Y. Fujii, R.
Greenberg, R. Williamson, J. Little, B. Mech, V. Cimmarusti, G. Van Boemel, G. Dagnelie, E. de Juan, Vision Res 2003, 43, 2573.
[5] a) A. C. Ho, M. S. Humayun, J. D. Dorn, L. da Cruz, G. Dagnelie, J. Handa, P. O. Barale, J. A. Sahel, P. E. Stanga, F. Hafezi, A. B. Safran, J. Salzmann, A. Santos, D. Birch, R. Spencer, A. V. Cideciyan, E. de Juan, J. L. Duncan, D. Eliott, A. Fawzi, L. C. Olmos de Koo, G. C. Brown, J. A. Haller, C. D. Regillo, L. V. Del Priore, A. Arditi, D. R. Geruschat, R. J. Greenberg, I. I. S. G. Argus, Ophthalmology 2015, 122, 1547; b) R. Hornig, M. Dapper, E. L. Joliff, R. Hill, K. Ishaque, C. Posch, R.
Benosman, Y. LeMer, J.-A. Sahel, S. Picaud, in Artificial Vision (Ed: P. Gabel), Springer 2017, p. 99; c) K. Stingl, R. Schippert, K. U. Bartz-Schmidt, D. Besch, C. L. Cottriall, T. L. Edwards, F. Gekeler, U. Greppmaier, K. Kiel, A. Koitschev, L.
Kuhlewein, R. E. MacLaren, J. D. Ramsden, J. Roider, A. Rothermel, H. Sachs, G. S. Schroder, J. Tode, N. Troelenberg, E. Zrenner, Front Neurosci 2017, 11, 445; d) D. Yanai, J. D. Weiland, M. Mahadevappa, R. J. Greenberg, I. Fine, M. S. Humayun, Am
J Ophthalmol 2007, 143, 820; e) E. Zrenner, K. U. Bartz-Schmidt, H. Benav, D.
Besch, A. Bruckmann, V. P. Gabel, F. Gekeler, U. Greppmaier, A. Harscher, S. Kibbel, J. Koch, A. Kusnyerik, T. Peters, K. Stingl, H. Sachs, A. Stett, P. Szurman, B. Wilhelm, R. Wilke, Proc Biol Sci 2011, 278, 1489.
[6] a) M. S. Humayun, J. D. Dorn, A. K. Ahuja, A. Caspi, E. Filley, G. Dagnelie, J. Salzmann, A. Santos, J. Duncan, L. daCruz, S. Mohand-Said, D. Eliott, M. J.
McMahon, R. J. Greenberg, Conf Proc IEEE Eng Med Biol Soc 2009, 2009, 4566; b) H. Lorach, G. Goetz, R. Smith, X. Lei, Y. Mandel, T. Kamins, K. Mathieson, P. Huie, J. Harris, A. Sher, D. Palanker, Nat Med 2015, 21, 476.
[7] a) L. da Cruz, B. F. Coley, J. Dorn, F. Merlini, E. Filley, P. Christopher, F. K. Chen, V. Wuyyuru, J. Sahel, P. Stanga, M. Humayun, R. J. Greenberg, G. Dagnelie, Br J
Ophthalmol 2013, DOI: 10.1136/bjophthalmol-2012-301525; b) L. da Cruz, J. D.
Cideciyan, E. de Juan, J. L. Duncan, D. Eliott, A. Fawzi, L. C. Olmos de Koo, A. C. Ho, G. Brown, J. Haller, C. Regillo, L. V. Del Priore, A. Arditi, R. J. Greenberg,
Ophthalmology 2016, 123, 2248.
[8] T. C. Pappas, W. M. Wickramanyake, E. Jan, M. Motamedi, M. Brodwick, N. A. Kotov, Nano Lett 2007, 7, 513.
[9] L. Bareket, N. Waiskopf, D. Rand, G. Lubin, M. David-Pur, J. Ben-Dov, S. Roy, C. Eleftheriou, E. Sernagor, O. Cheshnovsky, U. Banin, Y. Hanein, Nano Lett 2014, 14, 6685.
[10] J. Tang, N. Qin, Y. Chong, Y. Diao, Yiliguma, Z. Wang, T. Xue, M. Jiang, J. Zhang, G. Zheng, Nature Communications 2018, 9, 786.
[11] a) V. Gautam, D. Rand, Y. Hanein, K. S. Narayan, Adv Mater 2014, 26, 1751; b) D. Ghezzi, M. R. Antognazza, R. Maccarone, S. Bellani, E. Lanzarini, N. Martino, M. Mete, G. Pertile, S. Bisti, G. Lanzani, F. Benfenati, Nat Photonics 2013, 7, 400; c) J. F. Maya-Vetencourt, D. Ghezzi, M. R. Antognazza, E. Colombo, M. Mete, P. Feyen, A. Desii, A. Buschiazzo, M. Di Paolo, S. Di Marco, F. Ticconi, L. Emionite, D. Shmal, C. Marini, I. Donelli, G. Freddi, R. Maccarone, S. Bisti, G. Sambuceti, G. Pertile, G. Lanzani, F. Benfenati, Nat Mater 2017, 16, 681.
[12] a) Nanostructured Photocatalysts: Advanced Functional Materials, Springer International Publishing, 2016; b) K. Lee, A. Mazare, P. Schmuki, Chem Rev 2014, 114, 9385.
[13] a) D. M. Blake, P.-C. Maness, Z. Huang, E. J. Wolfrum, J. Huang, W. A. Jacoby,
Separation and Purification Methods 1999, 28, 1; b) G. Carré, L. Garnier, J.
Moeller-Siegert, J.-P. Gies, V. Keller, P. André, N. Keller, Rsc Adv 2015, 5, 38859; c) A. Fujishima, K. Honda, Nature 1972, 238, 37; d) M. Grätzel, Nature 2001, 414, 338; e) K. Nakata, A. Fujishima, Journal of Photochemistry and Photobiology C:
Photochemistry Reviews 2012, 13, 169; f) B. O'Regan, M. Grätzel, Nature 1991, 353,
737; g) P. Roy, S. Berger, P. Schmuki, Angew Chem Int Ed Engl 2011, 50, 2904. [14] N. K. Awad, S. L. Edwards, Y. S. Morsi, Materials science & engineering. C,
Materials for biological applications 2017, 76, 1401.
[15] a) M. Z. Ge, C. Y. Cao, S. H. Li, Y. X. Tang, L. N. Wang, N. Qi, J. Y. Huang, K. Q. Zhang, S. S. Al-Deyab, Y. K. Lai, Nanoscale 2016, 8, 5226; b) D. Gong, C. A. Grimes, O. K. Varghese, W. Hu, R. S. Singh, Z. Chen, E. C. Dickey, Journal of
Materials Research 2001, 16, 3331; c) C. A. Grimes, G. K. Mor, TiO2 Nanotube Arrays: Synthesis, Properties, and Applications, Springer US, 2009; d) M. Paulose, H.
E. Prakasam, O. K. Varghese, L. Peng, K. C. Popat, G. K. Mor, T. A. Desai, C. A. Grimes, J. Phys. Chem. C 2007, 111, 14992.
[16] G. K. Mor, O. K. Varghese, M. Paulose, K. Shankar, C. A. Grimes, Solar Energy
Materials and Solar Cells 2006, 90, 2011.
[17] a) T. Cottineau, H. Cachet, V. Keller, E. M. M. Sutter, Phys Chem Chem Phys 2017, 19, 31469; b) I. Gonzalez-Valls, A. Mirloup, T. Le Bahers, N. Keller, T. Cottineau, P. Sautet, V. Keller, Rsc Adv 2016, 6, 91529.
[18] a) C. B. D. Marien, T. Cottineau, D. Robert, P. Drogui, Applied Catalysis B:
Environmental 2016, 194, 1; b) X. Zhang, K. Huo, L. Hu, Z. Wu, P. K. Chu, Journal of the American Ceramic Society 2010, 93, 2771.
[19] S. Sakami, T. Maeda, G. Bereta, K. Okano, M. Golczak, A. Sumaroka, A. J. Roman, A. V. Cideciyan, S. G. Jacobson, K. Palczewski, J Biol Chem 2011, 286, 10551. [20] B. Sha, W. Gao, X. Cui, L. Wang, F. Xu, J Appl Toxicol 2015, 35, 1086.
[21] T. Li, K. Gulati, N. Wang, Z. Zhang, S. Ivanovski, Materials science & engineering.
[22] a) F. Schmidt-Stein, S. Thiemann, S. Berger, R. Hahn, P. Schmuki, Acta Mater 2010, 58, 6317; b) Y. N. Xu, M. N. Liu, M. C. Wang, A. Oloyede, J. M. Bell, C. Yan, J Appl
Phys 2015, 118.
[23] C. S. Ponseca, Jr., P. Chabera, J. Uhlig, P. Persson, V. Sundstrom, Chem Rev 2017, 117, 10940.
[24] a) H. Kim, I. Kim, H. J. Choi, S. Y. Kim, E. G. Yang, Nanoscale 2015, 7, 17131; b) M. Kulkarni, A. Mazare, E. Gongadze, S. Perutkova, V. Kralj-Iglic, I. Milosev, P. Schmuki, A. Iglic, M. Mozetic, Nanotechnology 2015, 26, 062002; c) L. E.
McNamara, R. J. McMurray, M. J. Biggs, F. Kantawong, R. O. Oreffo, M. J. Dalby, J
Tissue Eng 2010, 2010, 120623.
[25] A. Bendali, L. Rousseau, G. Lissorgues, E. Scorsone, M. Djilas, J. Degardin, E. Dubus, S. Fouquet, R. Benosman, P. Bergonzo, J. A. Sahel, S. Picaud, Biomaterials 2015, 67, 73.
Figure 1. a) Current density and applied potential during anodization of NT/Ti (red) and NT/FTO (blue) b) X-ray diffractogram of the Ti film deposited on FTO, the TiO2-NTs obtained
on FTO and the TiO2-NTs on Ti foils. The main diffraction peaks of TiO2, SnO2 from FTO and
metallic Ti are reported in the figure. SEM images obtained at 45° of electrode for c) deposited titanium film of FTO, d) NT/FTO (inset is a top view of the same sample) and e) NT/ Ti.
Figure 2. Characterization of TiO2 nanotube films in acellular conditions. (A) Schematics
of the experimental setup: on a fixed-stage upright microscope, the light of a LED is focused on the films using a 63x water-immersion lens. The spot size is adjusted using the fluorescence diaphragm. The recording chamber is filled with phosphate-buffered saline, as the recording pipette, which is brought close (~2 µm) to the film surface, at the center of the spot, using a micromanipulator (10 nm steps) with position indication. The reference electrode of the patch-clamp amplifier is an Ag/AgCl pellet placed in the vicinity of the NT film. (B) Potential changes evoked at the surface of either a NT film synthetized from a Ti foil (NT/Ti, red trace) or from Ti sputtered on the surface of FTO glass (NT/FTO, blue trace), in response to a 10 ms, 50 µm diameter spot of UV-A light (365 nm, 33 mW/mm2). (C) Same traces as in B, scaled to the maximum of the response. (D-E) Evolution of the response amplitude to 1000 consecutive flashes, same characteristics as in B, delivered at 1, 10 or 25 Hz (blue, green and red traces, respectively), on either a NT/Ti (D) or a NT/FTO (E) film. (F) Response amplitude to an equivalent flash, as a function of the distance from the spot center, when moving the electrode
Figure 3. Positioning of WT (left) or RhoP23H retinas (right) on the NT films for activity
recording.
Top: The NTs are placed in contact with the outer part of the retina – photoreceptors for WT retinas, bipolar cells for RhoP23H retinas. In both cases, ganglion cells are easily accessible for
loose-patch recording (images adapted from Webvision, http://webvision.med.utah.edu/). Bottom: optical coherence tomography images of WT (left) and RhoP23H retinas, at the age of recording. Horizontal and vertical scale bars represent 250 and 100 µm, respectively.
Figure 4. NT/FTO-evoked activity in ganglion cells from WT and P23H retinas. In response to short light pulses (10 ms on a WT retina, left, 20 ms on a P23H retina, right, 100 µm diameter), bursts of action potentials could be recorded from ganglion cells using the loose-patch configuration. For stimulation frequencies up to 25 Hz, each flash evoked a similar burst, as can be seen in raw traces (top), or in raster plots (bottom), showing the responses to 30 consecutive flashes at the indicated frequency (each vertical bar represents an action potential). For both genotypes, the traces and raster plots were obtained from the same ganglion cell. For the frequencies of 1, 3, 10 and 25 Hz, the respective flash energies were here of 33, 47, 63 and 68 mW/mm2 for the WT, and 15, 15, 15 and 42 mW/mm2 for the P23H ganglion cell, illustrating the fact that in most cases the flash energy had to be increased with the flash frequency to obtain
a stable response. The magenta bar represents the flash duration. Insets: detail of the indicated bursts, to illustrate the deflection preceding action potential firing. Scale bar 25 ms.
I II II II I I I I I I I I I I I I I I I I I I I I I I I I I I I I I I I I I I I I I I II II I II I II I I I I I I I I I I I I I I I I I II I II I II I I I I I t (ms) -50 0 50 100 150 200 s pi k es / 5 m s bi n 0 5 10 15 20 25 30 I II I II I I I I IIIIIIIIIIIIIIIIIIII I I I I II I II I I I I I I I III I I I I I I I I II I I I III IIII I I II I I I I I I I I II I I I I I I I I IIII I I I I I I II I I I I I II I I I II I II IIIIIIIIIIIIIII I I I I I I I I I I I I I I I III I II I I I I I II I I II I I I II I I II I I I I I I I I I I I I I I I I I I I I I I I I I I I I I I I III II I I I I III I I I I I II III I I I I I I II II I I I I I I II I II I I I III I I I I I I I I I I I I I I I I II I I I I I I I II II I I I I I I I I I II I I I I I II I I I IIIIIIIII I I t (ms) -50 0 50 100 150 200 I I I I I I I I III I I II I I I I I I I I I II II I I III I I II I I I II I I I I I II I I II I I I I I I I I I I I I I I III I I I I I I I I I I II I III I III I I I I I I II I I I I I I I I I I I I II I I I I I I I I I I II I I I I I I I I I I I I I I I I I I I I I I I I I I I I I I I I I I I I I I I I I I I I I I I I I I I I I I II t (ms) -50 0 50 100 150 200 I I I I I I I I I I I I I I I I I I II I I I I I I I I II I I I I I I I I II I I I I I I I I I I I II I I I I I I II I I I I I I I I I I I I II I II I I I I II I I I I I I I I I I I I I I I I II I II I I I I I I I I t (ms) -50 0 50 100 150 200 s pi k es / 5 m s bi n 0 10 20 30 40 II I I II I II II II I I I I I I I I I I I I I I I I I I II I I I II I I I I I I I I I I I I III I I I I I I I I I I I I II I I I III I I I II I I II I I I II I I I I I II I II I I I I I II I I I I I II I I I I I I I I I I II I I I I I II I I II I I I II I I I I I I I I I I I I I I III I I I III I I I I III III I I I II I I I II I I I I II I I I I I I I I I I I II I I I II I I II I I II I II I I II I I I II I I II I I I II I I II IIII I I III I I II I I II I I II I I I II I I II I I I I II I I III I I I I I II I I III I I I I I I II I I IIII I I I I II I I I I I I I I I II I I III I I I I II I I II I II I I I III I I I I I I I II I I II I I I I II I I II I I I I t (ms) -50 0 50 100 150 200 I I I I I I I II I I I I I IIII I I I I I I I I I II I I I I I I I I II I I I I I II I II I I I III II II II I I I I I I I I I I I I I I I I I II I I I I I I I I I I I I I I I I I I I I I I I I I I I I I I I I I I I I I I I I I I I I I I I I II I II I II I III I I I I I I I I I I t (ms) -50 0 50 100 150 200 WT P23H Latency (ms) 0 10 20 30 40 50 60 70 B urs t du rat ion (m s ) 0 50 100 150 200 WT 20 ms WT 10 ms P23H, 20 ms Latency (ms) 0 10 20 30 40 50 60 70 S pi k es / bu rs t 0 2 4 6 8 10 12 14 16
A
B
C
D
E
F
G
H
Power (mW/mm2) 0 5 10 15 20 25 30 35 M ea n s pi k e nu m be r 0 2 4 6 8 10 WT 0 5 10 15 20 25 30 35 M ea n s pi k e nu m be r 0 2 4 6 8 10 12 14 P23H a b c a b c 0 5 10 15 20 25 30 35 La ten c y t o fi rs t s pi k e (m s ) 0 20 40 60 80 100 P23H Power (mW/mm2) 0 10 20 30 La ten c y t o fi rs t s pi k e (m s ) 0 20 40 60 80 100 WTFigure 5. Diversity of evoked-responses from WT and P23H ganglion cells. (A): raster plots and post-stimulus time histograms (5 ms bins) from three wild-type ganglion cells, responding either with a single short burst of action potentials (a), a longer burst (b) or two successive bursts (c) to 30 consecutive 50 µm light spots flashes delivered at 1 Hz. Flashes duration and intensity were 20 ms and 33 mW/mm2 in a and c, 10 ms and 15 mW/mm2 in b. (B) Similar types of responses recorded from P23H ganglion cells. All stimulations had a diameter of 100 µm, duration of 20 ms and intensity of 33 mW/mm2. (C) Relationship between response latency and the burst duration for 59 WT and 12 P23H ganglion cells responding with a single burst, in response to 10 ms (WT, blue) or 20 ms (WT, cyan and P23H, purple) flashes. (D) Relationship between the response latency and number of action potentials per burst, for the same cells as in C. (E-F) Relationship between the flash power and the mean spike number per burst (E) or the latency to first spike (F) for 13 WT ganglion cells, for 20 ms, 50 µm diameter stimulations delivered at 1 Hz. A given cell is represented in the same color in E and F. (G-H) Relationship between the flash power and the mean spike number per burst (G) or the latency to first spike (H) for 15 P23H ganglion cells, for 20 ms, 100 µm diameter stimulations delivered at 1 Hz. A given cell is represented in the same color in G and H.
Figure 6. Indirect or direct ganglion cell recruitment. (A-B): Raster plots and post-stimulus time histograms (5 ms bins) of a WT (A) and a P23H ganglion cell (B), for which the response was fully blocked by the bath application of 50 µM CNQX. (C-D): Raster plots and post-stimulus time histograms (5 ms bins) of a WT (C) and a P23H ganglion cell (D), for which only the late part of the response was blocked by the bath application of 50 µM CNQX. The timing of the flash is represented by the horizontal magenta bar, 10 ms for WT and 20 ms for P23H ganglion cells. The post-stimulus time histograms (PSTH) represent the timing of action potentials following stimulations in control conditions (black) and for the same number of stimulations following CNQX application (green). The total duration of CNQX application is indicated by the vertical orange bar.
Figure 7. Change in extracellular potential depending on the retinal depth. (A) Images showing the recording pipette in the photoreceptor layer, 170 µm from the vitreous surface (top), in the inner retina at the estimated position of bipolar cells, 90 µm from the vitreous surface (middle) and in the ganglion cell layer (bottom). Scale bar: 40 µm. (B) Depolarization evoked by a 50 µm diameter, 20 ms duration flash of 365 nm light of the indicated power, close to the material surface in the absence of retina (cyan diamonds, mean of 5 zones), in the photoreceptor layer (black circles), at the level of bipolar cell somas (magenta symbols) or in the ganglion cell layer (green symbols). Circles represent values obtained from WT retinas (7 zones from 4 retinas), triangles those from P23H retinas (14 zones from 4 retinas). (C) Same as in B, without the photoreceptor curve. (D) Evolution of the depolarization amplitude as a function of the distance from the spot center in absence of retina (cyan diamonds), at the level of the photoreceptor segments (black circles), bipolar cells (magenta symbols) or ganglion cells (green symbols). Circles represent values obtained from WT retinas (7 zones from 4 retinas), triangles those from P23H retinas (14 zones from 4 retinas), for 50 µm diameter, 20 ms duration flashes
of 365 nm light, with a power of 15 mW/mm2. (E) Same as in D, after normalization to the maximal response amplitude. Dashed lines indicates the distances for which the response is 50, 33 or 10% of the maximal response amplitude.