HAL Id: hal-01161949
https://hal-brgm.archives-ouvertes.fr/hal-01161949
Submitted on 9 Jun 2015
HAL is a multi-disciplinary open access
archive for the deposit and dissemination of sci-entific research documents, whether they are pub-lished or not. The documents may come from teaching and research institutions in France or abroad, or from public or private research centers.
L’archive ouverte pluridisciplinaire HAL, est destinée au dépôt et à la diffusion de documents scientifiques de niveau recherche, publiés ou non, émanant des établissements d’enseignement et de recherche français ou étrangers, des laboratoires publics ou privés.
Origins and processes of groundwater salinization in the
urban coastal aquifers of Recife (Pernambuco, Brazil): a
multi-isotope approach
Lise Cary, Emmanuelle Petelet-Giraud, Guillaume Bertrand, Wolfram
Kloppmann, Luc Aquilina, Veridiana Martins, Ricardo Hirata, Suzana Maria
Gico Lima Montenegro, Hélène Pauwels, Eliot Chatton, et al.
To cite this version:
Lise Cary, Emmanuelle Petelet-Giraud, Guillaume Bertrand, Wolfram Kloppmann, Luc Aquilina, et al.. Origins and processes of groundwater salinization in the urban coastal aquifers of Recife (Pernambuco, Brazil): a multi-isotope approach. Science of the Total Environment, Elsevier, 2015, 530-531, pp.411-429. �10.1016/j.scitotenv.2015.05.015�. �hal-01161949�
1
Origins and processes of groundwater salinization in the urban coastal aquifers of Recife (Pernambuco, Brazil): a multi-isotope approach
Lise Carya*, Emmanuelle Petelet-Girauda, Guillaume Bertrandb, Wolfram Kloppmanna, Luc Aquilinac, Veridiana Martinsb, Ricardo Hiratab, Suzana Montenegrod, Hélène Pauwelsa, Eliot Chattonc, Melissa Franzene, Axel Aurouetf and the Team1
1Team list
Eric Lasseura, Géraldine Picota, Catherine Guerrota Christine Fléhoca, Thierry Labasquec, Jeane G. Santosb, Anderson Paivad, Gilles Braibanta, Daniel Pierref
a BRGM French Geological Survey, 3 Avenue Claude Guillemin, 45060 Orléans Cedex 2,
France
b Institute of Geosciences, University of São Paulo, Rua do Lago, 562 Butantã, 05508-080
Sao Paulo, Brazil
c OSUR-Géosciences Rennes, Université Rennes 1 - CNRS, 35000 Rennes, France
d
Civil Engineering Department, Federal University of Pernambuco, 50740 Recife PE, Brazil
e CPRM, Brazilian Geologic Survey, Avenida Sul 2291, Recife PE, Brazil f Géo-Hyd, 101 rue Jacques Charles, 45160 Olivet, France
*Corresponding author: l.cary@brgm.fr
Abstract
In the coastal multilayer aquifer system of a highly urbanized southern city (Recife, Brazil), where groundwaters are affected by salinization, a multi-isotope approach (Sr, B, O, H) was used to investigate the sources and processes of salinization. The high diversity of the geological bodies, built since the Atlantic opening during the Cretaceous, highly constrains the heterogeneity of the groundwater chemistry, e.g. Sr isotope ratios, and needs to be integrated to explain the salinization processes and groundwater pathways. A palaeoseawater intrusion, most probably the 120 ky B.P. Pleistocene marine transgression, and cationic exchange are clearly evidenced in the most salinized parts of the Cabo and Beberibe aquifers. All 87Sr/86Sr values are above the past and present-day seawater signatures, meaning that the Sr isotopic signature is altered due to additional Sr inputs from dilution with different freshwaters, and water-rock interactions. Only the Cabo aquifer presents a well-delimitated area of Na-HCO3 water typical of a freshening process. The two
2 deep aquifers also display a broad range of B concentrations and B isotope ratios with values among the highest known to date (63-68.5‰). This suggests multiple sources and processes affecting B behaviour, among which mixing with saline water, B sorption on clays and mixing with wastewater. The highly fractionated B isotopic values were explained by infiltration of relatively salty water with B interacting with clays, pointing out the major role played by (palaeo)-channels for the deep Beberibe aquifer recharge. Based on an increase of salinity at end of the dry season, a present-day seawater intrusion is identified in the surficial Boa Viagem aquifer. Our conceptual model presents a comprehensive understanding of the major groundwater salinization pathways and processes, and should be of benefit for other southern Atlantic coastal aquifers to better address groundwater management issues.
1. Introduction
Groundwater resources in coastal areas are particularly vulnerable to social and economic development, leading to an increasing water demand for drinking water, agriculture and industry. In addition, climate change is expected to modify groundwater recharge and to induce sea level variations. The joint effects of socio-economic and climatic changes in urbanized coastal “hot spots” may worsen groundwater overexploitation associated with groundwater quality deterioration, especially by salinization.
Groundwater salinization can be explained by several processes such as modern seawater intrusion due to intense aquifer exploitation (Andersen et al., 2005; Bianchini et al., 2005; Cary et al., 2013; Custodio, 1997; de Montety et al., 2008; Kim et al., 2003; Pulido-Leboeuf, 2004; Werner et al., 2013), contributions of deep saline palaeowaters, i.e. marine or estuarine water recharged during past transgressions, which have usually evolved through mixing with freshwater, water-rock interaction or after evaporation in lagoons (Aquilina et al., 2002; Aquilina et al., 2013; Armandine Les Landes et al., 2014; Duriez et al., 2008; Edmunds and Milne, 2001; Han et al., 2011; Khaska et al., 2013; Négrel and Casanova, 2005; Sola et al., 2014; Vengosh et al., 2005; Vengosh et al., 1999). Other sources of salinity are dissolution of evaporites with or without further water-rock interactions (Cendón et al., 2008; Kloppmann et al., 2001; Lucas et al., 2010; Merchán et al., 2015; Mongelli et al., 2013), evaporation of freshwater, notably when used for irrigation, pollution by untreated wastewater (Cary et al., 2013; Giménez Forcada and Morell Evangelista, 2008), and return flow (Cruz-Fuentes et al., 2014; Perrin et al., 2011). As these processes are not necessarily exclusive,
3 defining the origin of salinization might thus remain highly complex (Chaudhuri and Ale, 2014).
Environmental tracers are combined with benefit to identify the origins and processes of salinization (Cartwright et al., 2007; Werner et al., 2013). The 87Sr/86Sr ratio is classically used in hydrochemistry as a tracer of water-rock interaction (Blum et al., 1994; Cary et al., 2014; Négrel et al., 2001; Petelet-Giraud and Négrel, 2007; Petelet-Giraud et al., 2003), or of the origins of salinity in a coastal environment (Jorgensen and Heinemeier, 2008; Khaska et al., 2013; Pennisi et al., 2006; Vengosh et al., 2002). Generally, the dissolved boron concentration in groundwater is controlled by the chemical weathering of evaporites and silicates, mixing with seawater (Morell et al., 2008), seawater-derived or continental brines, or with wastewater. The preferential 10B adsorption occurs on a variety of exchange phases such as clay minerals, metal (hydr)oxides and organic matter (Goldberg et al., 1993; Lemarchand et al., 2007; Palmer et al., 1987; Tabelin et al., 2014; Williams et al., 2001), and leads to increasing δ11
B values. B concentration and isotopes are a good tracer of domestic wastewater because of the presence of Na- and Ca-perborates in washing powders with a well-defined B isotope signature (0-15 ‰) and high B concentrations commonly exceeding 0.1 mmol.L-1 (Barth, 1998; Cary et al., 2013; Vengosh et al., 1994). The sustainable management of coastal water resources is a global issue and requires an adequate knowledge of the distribution of fresh and saline groundwater and a thorough assessment of the sources and vectors of salinization.
Due to observed trend of declining precipitation, the Recife Metropolitan Region (RMR) in the Pernambuco State, and, to a larger extent, the dry North-East of Brazil, are identified as a “global hot spot” for climate change and its effects on hydrological services (Bates et al., 2008; IPCC, 2013). Like many southern cities, the RMR (3.9 M inhabitants) faces a set of serious structural problems: a precarious access to public water, water rationing, a 100-year-old water supply network, in conjunction with a low coverage of the public sanitary sewer system with only 40% of wastewaters collected (Trata Brasil, 2011). Thus, with an increasing demographic pressure and remarkable changes of water and land uses over the last decades (Melo, 2013), the RMR currently suffers from water crisis. The first water crisis after the 1998-1999 drought led to water rationing, and was followed by a large and uncontrolled groundwater abstraction through, in Recife, more than 13,000 mostly illegal private wells (Costa, 2002). Since then, strategies are still developed to cope with the irregular and insufficient water supply of the public network, which is currently denied by the public authorities (Cary et al., 2015). This evolution gave rise to numerous environmental consequences, such as the dramatic decline of piezometric levels. It induces abandonment
4 of shallow wells in the shallow aquifers and new drillings in the deep aquifers with a profound alteration of the flow patterns concomitantly with local groundwater salinization, contamination by untreated wastewaters and industrial effluents (Costa Filho et al., 1998b; Costa, 2002; Montenegro et al., 2003).
Large knowledge gaps persist in the assessment of the salinization mechanisms in the RMR and several hypotheses were advanced in previous studies, pointing out the geographical heterogeneity of the water chemistry. The salinization process was supposed to be related to salts dissolution and contamination from palaeomangrove waters, with groundwater recharge by fresh waters, old evaporated groundwater, and saline waters of various age and origins (Costa Filho, 1997). Finally, seawater intrusion and sewage were identified as potential sources of salinity (Montenegro et al., 2010b). The RMR thus presents a typical situation of the complexity of water management in such coastal “hot spots”. Indeed, water management implies dealing with i) surface processes and various surface water sources and pollution on the one hand, and ii) complex salinization processes in the underlying aquifers, both surface and ground aspect having to be considered together.
The aim of the present study is to understand the interactions between the different water bodies and to assess the origins of salinity and the processes affecting the surficial and deep aquifers in a highly exploited coastal aquifer. The temporal and spatial heterogeneities of the groundwater chemistry have been documented through three sampling campaigns. Major, minor, and trace-elements analyses are combined with multi-isotopic fingerprinting of water (O, H isotopes) and of dissolved compounds (isotopes of Sr, B). The objectives are (1) to understand the spatial disparities of salinity in the main aquifers and also more locally at well scale, and (2) to investigate the anthropogenic and lithological influences on groundwater chemistry. This work provides the first global assessment of the salinity sources and of the salinization processes in the RMR aquifers and leads to a better understanding of the functioning of a coastal multi-aquifer system in areas subjected to high anthropogenic pressures.
2. Study area: the Recife Metropolitan Region
2.1 Geographic and climatic context
The RMR is located in the coastal area of the Pernambuco State in the Northeast of Brazil. The total area of the RMR is 2,769 km². Recife was built in the estuarine area of the Capibaribe River and smaller rivers (Beberibe, Tejipio, Jordão and Jiquia), with a network of
5 secondary waterways. The tide penetrating into the estuary favors mangrove ecosystems, threatened by urban planification (Melo, 2013).
The RMR has a hot and humid tropical monsoon climate. Temperatures have low seasonal variations, with a mean of 25°C. Under the influence of the Southern Oscillation (El Nino in 2005 and 2010, La Nina in 2000) and the Atlantic Dipole (Intertropical Convergence Zone), the average rainfall is 2000 mm/year and with two marked seasons: a rainy season (March-August, > 250 mm/month), and a dry season (September-February, < 100 mm/month). Rainfall is also spatially highly irregular with decreasing rainfall west of the city. 1998-1999 and 2012-2013 are considered as extremely dry years, and are known as the Recife most important droughts. The 2012-2013 average levels of precipitation reached 1770 mm which was 11% inferior to the 1961-1990 mean. Excepted for May 2013, each month of 2012-2013 was between 15 and 90 % dryer in comparison to the 1961-1990 monthly averages (APAC, 2015; Costa, 2002).
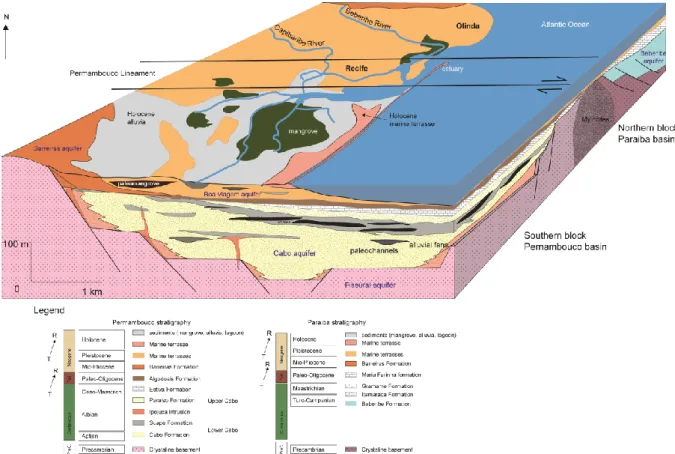
Figure 1: Schematic cross section of the geological study area (the vertical scheme has been modified from Maia et al., 2012).
6
2.2 Geological settings
The Recife coastal plain is located on the Pernambuco and Paraíba sedimentary basins, separated by the transverse structure of the Pernambuco Lineament (Fig. 1 and Fig.1 in Supporting Information). The lineament opposed to the gradual opening of the Atlantic Ocean and delayed the formation of the northern Beberibe sedimentary basin compared to the southern Cabo basin (Mabesoone and Alheiros, 1988).
The basement of the Cabo-Pernambuco, south of the lineament, has a graben structure (Lima Filho et al., 2006) and is constituted by a gneiss–granite complex. (Lima Filho et al., 2006). The crystalline basement is a gneiss-granite complex. Presenting a large diversity, the sedimentation of the deep Cabo Formation started in during the Aptian and Albian and is mainly of continental origin (Lima Filho, 1998; Pfaltzgraff, 2003) (Fig. 1). A recent stratigraphic review has pointed out three specific units, called Cabo, Suape and Paraíso Formations (Barbosa et al., 2014; Maia et al., 2012). The Lower Cabo is constituted by alluvial fans with predominant conglomeratic facies. The distal region of the alluvial plains was marked by continental sabkhas. The mineralogy of the Cabo Formation mainly presents quartz, K-feldpar and plagioclase. The presence of a small horst at 3-4 km off shore (Maia et al., 2012) may have favored the development of endorheic conditions for the Cabo Formation sedimentation (Fig. 1). The Lower Cabo Formation is topped by fluvial-deltaic-lacustrine sediments with a thick layer of arkosean sandstone alternating with discontinuous clay layers with anoxic shales interbedded with thick silty levels (or new Suape Formation) (Maia et al., 2012). This formation is contemporaneous to vulcanoclastics deposits of magmatic Ipojuca Suite (102 Ma) (Lima Filho et al., 2006; Nascimento, 2003). It was followed by the sandy Upper Cabo (or Paraiso Formation). Then a first marine transgression over the basin led to the limestone deposition of the Estiva Formation during the upper Cretaceous.
The Paraíba sedimentary basin is located in the northern part of the RMR (Lima Filho et al., 2006). Its Precambrian crystalline basement comprises highly fractured granites, gneisses, schists and migmatites. After subsidence of the northern block, the filling of the basin started with the Beberibe Formation (Santonian-Campanian at 89-83 Ma) of fluvial and lacustrine origin with continental sandstones and argillaceous components, with an average thickness of 200 m (Beurlen, 1967). The upper Itamaracá Formation is a transitional unit with estuarine and lagoonal deposits of Campanian-Maastrichtian age (~83-70 Ma) (Barbosa et al., 2003). Then, the Gramame Formation displays a transgressive carbonate succession with limestones containing phosphates and thin interbedded clays (Barbosa et al., 2003). A new
7 marine transgression occurred during the Palaeocene and Eocene (~65-34 Ma) resulting in the limestone deposits of the Maria Farinha Formation (Mabesoone et al., 1968).
The Barreiras Formation (Plio-Pleistocene) covers indistinctly the two basins, and is made of fluvial deposits with varying thickness. It constitutes small hills that bound the central “amphitheatre” of Recife in the north, west and south with heights up to 100 m. Finally, the quaternary sediments of the Boa Viagem Formation cover the whole central plain, which is flat and low with heights ranging from 1 m to 10 m above sea level (Costa, 1998). Their average thickness is 40 m with a maximum of around 80 m. The Penultimate transgression of the upper Pleistocene high sea-level (123,000 yr BP) and three major high sea levels recorded during the Holocene at 5,100, 3,600 and 2,500 yr BP led to the construction of three marine terraces of Pleistocene (120 ka BP, 7-10 m a.s.l. (m above sea level), sand with cement of Fe2O3 with humic acids, and interbedded organic clays), and Holocene (5,100 yr
BP, 1-3 m a.s.l, sands with shell fragments), tidal lagoon deposits (5,140-6,030 years BP), sandstone and reefs with ages from 1,830 to 5,170 years BP, and Holocene alluvial, freshwater swamp and mangroves (fine sands, silts and organic clays with associated vegetation) (Dominguez et al., 1990; Martin et al., 1996). Locally, palaeochannels can interfere with the rather horizontal sedimentation (Costa, 1998). The outcrops of the Cabo, Beberibe and Barreiras Formations are topped with podzolic soils.
2.3 Hydrogeological context
The geological settings described above support the occurrence of five main aquifers: the semi-confined Beberibe and confined Lower Cabo (hereafter named Cabo) aquifers, respectively north and south of Recife and the Barreiras and Boa Viagem surficial unconfined aquifers, which are directly exposed to pollution, since they are connected to mangroves, rivers, estuaries and urbanized areas (Leal, 1994). Little information is available about the hydraulic connections between the aquifers but previous studies have suggested that exchanges may occur and may be modified by intense exploitation (Costa Filho et al., 1998a) especially between the Cabo and Boa Viagem aquifers (Lima et al., 2000). With some outcrops in the western part of the study area, the two crystalline basements of the two basins constitute low storage capacity aquifers. Whether north or south, the fractured basement aquifers are called “Fissural” (Batista, 1984). Their weathering profile, up to 30 m thick, is manly constituted by clays, thus not favorable to aquifer recharge.
Considering the lithological description of the wells, a major hydrodynamic role is played by the numerous clay levels of varying thickness and depth that can be found at the top of the
8 Cabo and Beberibe formations (Fig. 1). These clay levels constitute aquicludes that favor the presence of locally perched aquifers and locally induce semi- confinement and confinement of the two main deep aquifers. Locally, the Cabo and Beberibe formations are overlaid by recent permeable sandy material instead of clays and thus unconfined. The carbonated formations are locally karstified.
In Recife, the two main deep aquifers are being exploited well beyond the limits of natural recharge (Monteiro, 2000). The public water supply, which relies mainly on surface waters and dams, provides on total only 5.6 m3.s-1, 5.2 m3.s-1 coming from surface waters and 0.4 m3.s-1 from groundwater, whereas the Recife city water demand is estimated to be 6.1 m3.s-1 for a population of 1.49 million inhabitants.
3. Material and methods
The sampling strategy at RMR scale was based on the pre-existing knowledge derived from the HIDROREC database (Costa, 2002; Costa et al., 1998). Typologies of groundwater sampling points were defined based on statistical analysis of existing data, in order to address a large range of salinities, and to focus on the more salinized areas. A total of 59 wells were selected and sampled in the 5 different aquifers of the RMR hereafter identified as Cabo: Cab; Beberibe: Beb; basement: Fis; Barreiras: Bar; Boa Viagem: Bov (Fig. 2). Note that a large number of highly salinized wells, mainly in the Boa Viagem aquifer, were abandoned and sometimes definitively filled in, thus inducing a sampling bias as the most salinized parts of the aquifers are no longer accessible.
Ten surface water samples were taken upstream and downstream in the Capibaribe and Beberibe Rivers, in the COMPESA (Pernambuco State Water and Sanitation Agency) drinking water treatment plants, i.e. Alto do Ceu (ETA0), Castello Branco (ETA1) and Pirapama (ETA2) (raw fresh water before treatment) and in the central mangrove (Fig. 2). All samples were analyzed for chemistry and isotopes. Local rain water was also sampled monthly from 05/2012 to 12/2014 in a rain collector at Recife near a meteorological station according to IAEA protocol (IAEA, 2002).
The first and second campaigns took place in September 2012 after the (weakly) rainy season, and in March 2013 after the dry season respectively. A third campaign, in March 2014, aimed at investigating the vertical stratification of salinity in a selection of multi-screened wells with a combination of flow direction measurements, performed with Heat
9 Pulse Flow Meter (Robertson Geologging), and hydrochemical characterization at various depths (Tem Tudo in the Cabo aquifer, Almirantina in the Beberibe aquifer, Fig. 2).
Measurements of the physical and chemical parameters (temperature, electrical conductivity (EC), pH, Eh, and dissolved oxygen) were made in situ. The groundwater samples were filtered in the field at 0.45 µm for major, minor, and trace element analyses and acidified for cations and 87Sr/86Sr analysis to pH=2 with ultrapure HNO3. Analyses of major- and trace-
elements were carried out by ICP-AES and ICP-MS (Ultima-2 model, Jobin Yvon) for cations, and by ion chromatography (model DX120, Dionex) for anions in the USP Cepas and BRGM laboratories respectively. The accuracy of both techniques was around 5-10% depending upon the concentration. Alkalinity was determined by HCl titration and Gran’s method in laboratory.
Chemical separation of Sr was done using an ion-exchange column (Sr-Spec), with a total blank of 0.5 ng for the entire chemical procedure. After chemical separation, 1/5 of the sample was loaded onto a tungsten filament and analyzed with a Finnigan MAT 262 multiple collector mass spectrometer. The 87Sr/86Sr ratios were normalized to an 86Sr/88Sr ratio of 0.1194. An average internal precision better than 1·10-5 (2m) was obtained during this study;
reproducibility of the 87Sr/86Sr ratio measurements was tested through replicate analyses of
the NBS 987 standard and the mean value was 0.710249 ± 11·10-6 (2σ, N=89). The stable
2H and 18O isotopes of the water molecule were measured on raw water using a Picarro
Laser spectrometer L2130i at USP and reported on the usual δ-scale in ‰ relative to V-SMOW standard, according to the equation δsample (‰)=(Rsample/Rstandard)*1000, where R is the 2H/1H and 18O/16O atomic ratios. The uncertainty is ±0.1 ‰ for δ18O and ± 0.9‰ for δ2H. All
the measurements were obtained and post-processed according to IAEA procedure (IAEA and USGS, 2013).
Boron isotopic compositions were determined using the positive-TIMS Cs2BO2 technique.
The values were plotted on the δ scale (expressed in ‰) relative to the NBS951 boric acid standard. The 11B/10B of replicates analysis of the NBS951 boric acid standard after oxygen correction was 4.05385 ± 0.00123 (2σ, n = 107) during this period. The reproducibility of δ11B
determination was ± 0.3‰ (2σ) and the internal uncertainty better than 0.2 ‰ (2σm). The
accuracy and reproducibility of the procedure were verified by repeated measurements of the IAEA-B1 seawater standard for which the mean δ11B value obtained over a long period is
10 Figure 2: Geology, sampling locations and conductivity classes (EC) in the five main aquifers of the RMR (September 2012).
4. Results and discussion
The concentrations of the major and trace elements are given in Table 1 and the δ2H, δ18O,
87
Sr/86Sr, and δ11B values measured in the surface water and the groundwater are given in Table 2. Considering the geochemical heterogeneities, the discussion addresses each hydrogeological system separately and is based on chemical major groups which composition can evolve, and also on a detailed analysis of some special wells when needed, such as those of the basement aquifer.
11 During the two sampling campaigns, the highest EC values were measured in the Cabo aquifer (162-7 546 µS.cm-1, n=40, mean=1 246 µS.cm-1) and in the Boa Viagem aquifer (102-10 057 µS.cm-1, n=30, mean=1 091 µS.cm-1) (Table 1). The Beberibe aquifer displayed lower EC (115-1 368 µS.cm-1, n=22), so as the Barreiras (5-119 µS.cm-1, n=11) and the Fissural aquifer (172-1 486 µS.cm-1, n=5). EC values do not follow a normal distribution which suggests, in a first approximation, different origins and/or processes of mineralization in the different aquifers and within the same aquifer.
The groundwater chemical variability of the five main aquifers is illustrated in the Piper diagram (Fig. 3) and in the binary diagrams (Fig. 4) where major groups of samples were distinguished according to their geological origins and chemical types. In the binary diagrams, elements are normalized to Cl to facilitate comparison with the marine ratio. The large variations of concentrations and hydrochemical facies can result from mixing processes and/or water-rock interactions with the various drained lithologies and secondary processes like cation exchange. Given the complexity of the study site, only the major processes will be described and referred to here, knowing that the dots groups are likely to evolve according to the considered element or isotope.
In the context of seawater intrusion and aquifer salinization, ion exchange is the principal mechanism by which the fine fraction of the sedimentary aquifer matrix, with a large specific surface area and a high cation-exchange capacity, is able to influence the ion proportions in groundwater.
The groundwaters over the two campaigns were generally enriched in Ca, SO4, HCO3, K, B,
and Sr, compared with a simple mixing between RB1 or ETA0 (upstream Beberibe River), considered as the local recharge and seawater. On the northern Paraíba basin, three main groups can be identified in the Beberibe aquifer. Group B1 includes Wells Beb51-59-60 and surface water (ETA1) and presents a NaCl-type. Its Na/Cl ratio is close to the marine ratio, and the group is slightly enriched in Sr and B, enriched in Ca, and depleted in SO4 relatively
to marine ratio. Group B2 is constituted by wells Beb47-52-132 and ETA0. Although this group has a Na/Cl ratio close to the marine one, it is enriched in Sr, B, SO4. Finally, Group
B3 comprises Wells Beb36-57-62 that plot parallel to the Ca+Mg vs. Na+K axis in the Piper diagram, with relatively high conductivities and a NaCl-type facies. This group is slightly depleted in Na, but enriched in Ca, Sr, B, SO4 relatively to an ideal mixing with seawater and
recharge waters (except in Sr for Beb57) that may be related to cation exchange (Appelo and Postma, 1993).
12 In the southern Pernambuco basin, two main groups can be distinguished (Fig. 4). They correspond accurately to the chemical facies of 200 Cabo groundwater samples (Costa, 2002; Costa et al., 1998). Group C1 of the Cabo aquifer comprises Wells Cab5-13-17-23-24 presenting a CaCl-type plotting parallel to the Ca+Mg vs. Na+K axis in the marine intrusion area, plus the sampling at depth in Well Tem Tudo. Based on the Cl content, Cab24 present a mixing with a maximum of 8 % of seawater. C1 presents the highest conductivities, depletion in Na and B together with enrichment in Ca and Sr, with a SO4/Cl ratio close to the
marine one. The Ca, Mg, and Sr excess counterbalanced by a Na deficit relative to the ideal mixing with seawater may be related to cation exchange triggered by past or present salinity in the aquifer (palaeoseawater or salt water intrusion through the mangrove). In the saline intrusion stage, NaCl-type waters (e.g. seawater) displace the freshwater with which the aquifer had been in equilibrium and bivalent cations initially fixed onto the cation exchangers are partly replaced by Na giving rise to Ca-Na-Cl or Ca-Cl type groundwaters. Group C1 shows a B depletion most probably due to B adsorption on clays, metal oxides, or organic matter (Goldberg and Forster, 1991; Majidi et al., 2010).
Group C2 is constituted by Wells Cab1-3-11-12-20-22-27-102, Bar121 and Fis123-125, with a Na-HCO3-Cl-type, and displays low contents of Ca+Mg with an average Ca and Mg
content of 0.18 and 0.36 meq.L-1 respectively, and rather high Na contents (average of 1.43 meq.L-1) indicating a gain of Na. It also displays a gain of Ca, Sr, and SO4, compared to the
marine ratio, and a B content on the mixing line between ETA0 and seawater (Fig. 4). The relatively low concentrations of Ca, Mg and Sr compared to Na suggests that freshening takes place with fresh water flushing the salt water of the aquifer leading to Ca and Sr adsorption and release of Na from exchange sites to form Na-HCO3-Cl-type fresh water. Na
in this case is being inherited from a former palaeoseawater intrusion. In complement, high Na/Cl ratios (>1) of C2 samples may also be attributed to feldspar weathering as Na-source leading to Na-excess without Ca-loss (Appelo and Postma, 2005; Coetsiers and Walraevens, 2006; Han et al., 2011).
Finally, various sequences of cation exchange at different stages can be described in the Cabo aquifer. The Pleistocene and Holocene transgression/regression phases induced recharge with sea water whereas the wet Lateglacial period (15-11.8 ky) (Behling et al., 2000) and pluvial Holocene (ending 5,000 y BP) are supposed to have enhanced fresh water recharge and freshening. This alternation may not have allowed complete salinization or freshening (with a complete flush of all salinization-induced dissolved excess Na and sorbed Na-X from the pore volume). It has to be noted that the Beberibe aquifer even though presenting lower EC than the Cabo does not show evidence of such a freshening process
13 probably because of insufficient exchangeable phases but also of different geological conditions (e.g. Holocene marine sediments are absent from the northern part of the plain). For the Tertiary-Quaternary formations (Barreiras and Boa Viagem aquifers), two groups can be evidenced (Fig. 4). Group T-Q1 includes Wells Bov14-19-30-33-43-46-100-110-111-112-113 with a CaHCO3 to NaCl water type. This group is not depleted in Na nor in B, and
displays rather high Cl contents. This group displays the highest HCO3 content. Group T-Q2
(Bar64-68B-120-122-124) presents a NaCl type with low EC. It is located parallel to the Ca+Mg axis in the marine intrusion area in the Piper diagram.
In this complex system, the major and trace chemical concentrations have allowed to identify: (i) a recharge component (RB1 and ETA0), (ii) mixing with seawater and cationic exchange (C1, B3, T-Q2) with a maximum of 8 % in C1, and mixing with salty water (basement), and (iii) freshening (C2). Further insights with isotopic studies are now necessary to better explain the major processes and end-member mixings affecting the groundwaters.
14 Figure 3: Piper diagram with groundwater data. Groups of dots are indicated according to their geochemical proprieties. Bx refers to Beberibe aquifer, Cx refers to the Cabo aquifer and T-Qx to the Tertiary-Quaternary deposits of the Boa Viagem and Barreiras aquifers.
15 Figure 4: Diagrams showing element concentrations normalised to Cl (meq.L-1) in the groundwater and surface water of the study area from the first and second sampling campaigns with major chemical group.
16
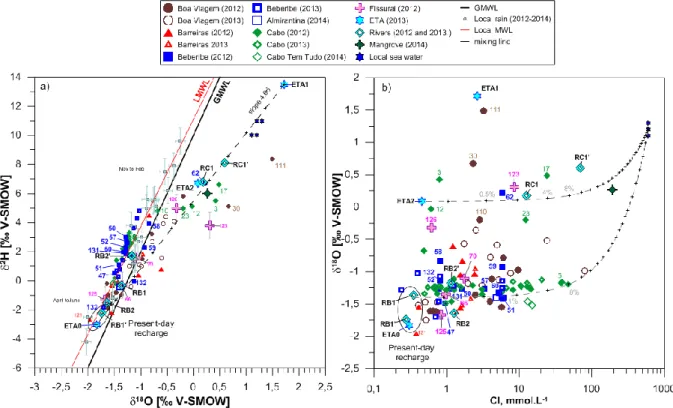
4.2 δ18O/δ2H of water: aquifers recharge and surface water/groundwater interactions
Local rain waters were collected in Recife between January 2013 and December 2014. The stable isotopes showed a narrow range of variations from -2.03 ‰ to 2.41 ‰ for δ18O and from -4.2 ‰ to 13 ‰ for δ2H (Fig. 5a). The lowest values in δ18O and δ2H were measured in
June during the rainy season (March-August). The local meteoric water line (LMWL) for Recife can be defined on an hydrogeological cycle (03/13 to 02/14), according to:
(Eq 1) δ2H = 7.38* δ18O +11.1
The stable isotopes of the surface waters also displayed a narrow range of values, ranging from -1.74‰ to 0.6‰ for δ18O and from -2.2‰ to 8.1‰ for δ2H. RB1 and ETA0 present the
same signature that rain water during the rainy season, thus confirming the recharge end-member (Fig. 5a). The other ETA waters, sampled in water stored in dams, clearly present a shifted signature that can be explained by an evaporation process with a 4.6 slope starting from the recharge. The mangrove (sampled at the junction with the Capibaribe River) but also the local seawater (Lima et al., 2003) are located on this evaporation line, making it impossible to distinguish the evaporation process on this δ18O-δ2H diagram from seawater
dilution by local freshwater. The values for the Capibaribe River downstream (RC1 and RC1’) are particularly enriched in δ2H and δ18O compared to the other surface samples from the
Beberibe River. They originate from upstream surface water reservoirs submitted to evaporation. Using chloride as an independent salinity tracer, we identify a seawater contribution related to the tide penetration into the estuary in the Capibaribe River downstream (RC1, RC1’, Fig. 5b).
Most of the surficial groundwaters plot along the LMWL and in the domain defined for the local recharge in Fig. 5. Some of the Boa Viagem groundwater samples significantly shift from the LMWL more likely due to evaporation rather than mixing with saline water given their low Cl content.
In the deep groundwaters, the δ18O and δ2H from two sampling campaigns fell respectively in
the range of -1.97 ‰ to -1.49 ‰ and -2.7 ‰ to -8.4 ‰ (Fig. 5a). Most of the Cabo and Beberibe samples plot along the LMWL but are clearly distinct from the Boa Viagem groundwaters. Some Cabo samples from C1 and C2 groups (Cab3, 17, 23, 12) shift from the LMWL and are enriched in the heavy isotope with two ranges of Cl contents (Fig. 5b). Firstly, Cab3 and Cab12 (group C2) present low Cl contents (< 1 mmol.L-1) similar to the recharge
17 and their δ18O argue in favour of an evaporated water contribution. They are indeed similar to
the evaporated ETA2 surface reservoir water both for chloride and stable isotope data. Secondly, Cab17 and Cab23 (group C1) present higher Cl contents (> 10 mmol.L-1), and considering their location, could receive water contribution from the mangrove. It needs to be underlined that the mangrove-water signature is probably highly variable in space and time as it results from variable mixing rates between freshwater and seawater and is evaporated to various degrees.
Located upstream in the basement outcrops area, Fis66 and 125 can also constitute the recharge pool of the system. This is also validated by the fact that the western basement outcrops are hydrogeologically considered as the recharge areas of the Cabo aquifer. For the southern part, out of reach for present-day seawater intrusion, the Cl content of Fis123 could be explained, in the light of the stable isotope data (Fig. 5b), by the presence of a palaeoseawater dating from the Pleistocene transgression (123,000 yr BP) mixed with evaporated recharge water. The superposition of the evaporation line and the mixing line with the mangrove and local seawater does not allow distinguishing between the various origins of salinity. Other tracers will be investigated to go further in the understanding of the different groundwater systems and the role of seawater intrusion.
Figure 5: a) δ2H and δ18O isotopes of the water molecule with the LMWL, and b) δ18O vs. Cl
18 surface waters, and groundwaters of the RMR in 2012, 2013 and 2014. Dashed lines are mixing lines between seawater and ETAs according to Faure (Faure, 1986).
4.3 Groundwater flow patterns and temporal variations
In the RMR, uncontrolled water abstraction leads to important modifications of vertical groundwater flows. Through the flow-meter investigations in inland parts of Cabo and Beberibe aquifers, upward flows consistent with aquifer confinement were evidenced. In Well Tem Tudo in the Cabo aquifer (Fig. 1), the flow was directed upwards with EC of 1 952 and 1 724 µS.cm-1 at 94 and 110 m depth respectively. Similarly, in Well Almirantina of the Beberibe aquifer, the flow is upward and EC is similar at around 1 200 µS.cm-1 at the two different sampled depths (65 and 78 m). On the contrary, wells around the mangrove and in the Boa Viagem neighbourhood display downward fluxes For instance, Cab6 presents a downward flow with a temporal variability of the chemical composition and EC (612 µS.cm-1 in September 2012 and 1 452 µS.cm-1 in March 2013 at the end of the dry season). Leakage from the surface, most surely influenced by the mangrove waters, is highly suspected. The same phenomenon can be involved for Cab5 (EC of 4 510 µS.cm-1 and 5 063 µS.cm-1). In both cases, the δ18O-δ2H signature does not present modifications in these two different
campaigns. These areas correspond to sectors where groundwater is heavily pumped and where the natural groundwater flux is altered (Costa, 2002). Hence, the Cabo aquifer that was previously confined has now become highly vulnerable to contamination by surface water, sewage and by the groundwater of the surficial aquifers.
The temporal variability of the Cl content in some wells of the Boa Viagem aquifer between the two sampling campaigns allows to hypothesize that seawater can intrude directly through the Boa Viagem formation and possibly through the reef in front of the present beach. Indeed, along the Boa Viagem avenue, two wells tapping the surficial Boa Viagem aquifer (Bov112, Bov113) display a large EC increase between September 2012 and March 2013 (1 141 and 10 057 µS.cm-1 and 1 010 to 3 560 µS.cm-1 respectively) with a Na/Cl ratio similar to that of seawater, with a very high Cl content (24 mmol/L in Bov113 and 80 mmol/L in Bov112, Fig. 4). These variations can be explained by direct intrusion of seawater in the Boa Viagem Formation favoured by the fact that the second sampling was done at the end of the exceptionally dry season in March 2013. On the contrary, most of the Cabo wells do not show any significant variation of salinity with time, except Cab10 which presents a huge increase of EC in March 2013 (162 to 1 290 µS.cm-1, Table 1). Here, the most likely
19 mechanism is infiltration of salty groundwater from the surficial Boa Viagem aquifer along improperly sealed deep wells. Beb62 is the only point on the Beberibe aquifer showing a decrease of its mineralization between September 2012 and March 2013 (EC varying from 1 368 to 239 µS.cm-1.
4.4 Lithological control of groundwater chemistry: Strontium isotope constraints
At first sight, the 87Sr/86Sr ratios of dissolved Sr present large variations between the 5 main aquifers (0.70924 to 0.72332) and also within a single aquifer. It first suggests that the strontium isotope composition of the groundwater reflects the distinct types and origins of the rocks forming the Precambrian basements and of the basement derived sediments of the Cabo, Beberibe and Barreiras Formations (Fig. 6 and Table 2). Secondly, all values are above the past and present-day seawater signatures (Koepnick et al., 1990). It appears that even for the most saline samples that are suspected to be impacted by seawater, the marine Sr isotopic signature is altered due to additional Sr inputs from dilution with different freshwaters containing radiogenic Sr, and water-rock interactions.
4.4.1 The northern Paraíba Basin
In the study area, the aquifers of the northern Paraíba basin present very high 87Sr/86Sr, both in the basement aquifer (Fis126: 0.71378) and in the Beberibe aquifer (Fig. 6). These values can be explained by interactions with the aquifer matrix constituted by the erosion products of the Paraíba Precambrian crystalline rocks, initially presenting high 87Rb contents leading over time to highly radiogenic 87Sr/86Sr ratios, e.g. for the regional Precambrian gneisses and the lineament mylonites with 87Sr/86Sr of 0.721 to 0.755 (Brito Neves, 1975; Sinha et al., 1988).
The range of variations of the 87Sr/86Sr of the public water supply can typically represent the influence of the two main lithologies of the Paraíba basement. ETA1 is a surface water (from Tapacura dam before treatment) draining the outcropping northern basement, while ETA0 (Alto do Ceu station) is a mixing of the Beberibe river (RB1) and groundwater (Beb132 located upstream in the hills). From Sr isotopes, it appears that the river water proportion is highly dominant in ETA0, at least at the sampling date. The Beberibe River sampled downstream (RB2) displays a higher Cl and Sr content (1.26 mmol.L-1 and 0.58 µmol.L-1 respectively) than upstream and a lower 87Sr/86Sr ratio (0.71318) and typically reflects the
20 tide penetration into the estuary (Paiva, 2004). Therefore, in complement to RB1-ETA0, ETA1 and Beb132 can be considered as recharge end-members.
Group B1 (Beb51-59-60) presents very high 87Sr/86Sr (0.71958-0.72069) compatible with the signatures of gneiss and of even more radiogenic mylonites. They also present some of the highest Sr concentrations (1.73-3.67 µmol.L-1), high Rb contents (0.14-0.8 µmol.L-1) and the highest Cl contents of the Beberibe aquifer. In the Almirantina well, the 87Sr/86Sr signature at 73 m depth is 0.71425 with a Sr content of 6.46 µmol.L-1 suggesting a mixing between Group B1 (similar to recharge ETA1) and a small contribution of seawater (1-2%) from Pleistocene intrusions.
Except for Beb132, Group B2 displays slightly lower 87Sr/86Sr than group B1 but is more depleted in Sr (0.25-0.33 µmol.L-1) than group B1.
Group B3 presents lower 87Sr/86Sr values (Beb36: 0.71096, Beb62: 0.71021, Beb58: 0.71183) which plot on mixing lines between seawater and all the northern ETA samples from storage dams and Beb132 and, accordingly to their position in the Piper diagram, may represent a water body affected by marine intrusion. The marine hospital (Beb62), located in front of the sea, displays a high conductivity (1,368 µS.cm-1) and a high Cl concentration (5.83 mmol.L-1) with a rather low Sr content (1.58 µmol.L-1) associated with a relatively low strontium isotopic ratio (0.71021), close to the present marine ratio (0.70917) in September 2012). It plots along the mixing line between the recharge (ETA0-RB1) and seawater in the
87Sr/86Sr vs 1/Sr diagram (Fig. 6) and along the mixing or evaporation line between the same
end-members (in the δ2H-δ18
O diagram Fig. 5). Beb62 could thus be the result of a binary mixing between the recharge (ETA0 and RB1) and a slight contribution of seawater calculated around 1-2% based on EC, Cl contents, and in agreement with the stable isotope signature that seems to additionally imply the contribution of an evaporated seawater (>2%) possibly from the former palaeomangrove. Beb62 evolved with time with a lower EC and Cl content (0.8 mmol.L-1) in March 2013, and a higher strontium isotopic ratio (0.71435), still indicating a mixing between seawater and the recharge. To end with, Beb62 is drilled through the Gramame formation (72 m) which is frequently found above the Beberibe formation. Its carbonates may represent another source of Sr with 87Sr/86Sr between 0.7080 and 0.7082 (Nascimento-Silva et al., 2011), although this formation does not constitute an important aquifer (Costa et al., 2002). It is worth noting that Well Beb57, previously identified as part of group B3 presents high 87Sr/86Sr (0.71880) and has lost Sr (Sr/Cl < seawater ratio). Located in the lineament shear zone, the high 87Sr/86Sr could result from mixing with the basement water that may also have interact with mylonites.
21
4.4.2 The southern Pernambuco basin
The Cabo aquifer presents high 87Sr/86Sr values (0.7097-0.7141, mean of 0.7120) compared to that of present-day seawater, even if they are lower and less variable than that of Beberibe (Fig. 6). The 87Sr/86Sr ratios of groups C1 and C2 are clearly over the Albian seawater ratio (0.7072 and 0.7076) or the Turonian seawater (0.7073-0.7075) (Koepnick et al., 1985). The higher 87Sr/86Sr ratios of the Cabo groundwater can therefore result from (1) water-rock interactions with the Cabo Formation mainly constituted by deltaic sedimentation from sediments of the southern crystalline basement including 87Rb and 87Sr rich K-feldspar and plagioclase, sands and numerous clay layers, and also (2) by recharge with a radiogenic component from the basement aquifer close to the lineament area where it is at a shallow depth.
Based on the 87Sr/86Sr signature of the groundwater basement and the ETA water, we point out that the 87Sr/86Sr signatures of the Paraíba and Pernambuco basements are clearly distinct. Indeed, the 87Sr/86Sr ratios of the Pernambuco basement aquifer (i.e. Fis123: 0.71248; Fis70: 0.71035; Fis125: 0.71056 together with Sr concentrations between 2.1 and 7.9 µmol.L-1) are less radiogenic than the one of the Paraíba basement aquifer represented by Fis126 (0.71379). Moreover, the water plant ETA2 receives surface water which 87Sr/86Sr (0.71179) similar to that of the Cabo aquifer (mean value of 0.71196) and of the Pernambuco basement aquifer (0.71112). Outcropping west of the RMR, the Cabo Formation and the Pernambuco basement logically constitute the recharge areas of the Cabo aquifer (Costa, 2002). Interestingly, Fis70, located more than 10 km inland is the most saline basement sample, it may indicate the presence of remnant seawater inherited from the large Pleistocene transgression which seawater 87Sr/86Sr ratio was close to the present-day one (0.70914-0.70917, (Farrell et al., 1995).
Group C2 was previously evidenced to be impacted by freshening that causes Ca and Sr adsorption. When Sr is adsorbed onto clays, the 87Sr/86Sr of the water remains the same, so that Group C2 can represent the non-modified Cabo groundwater signature. The 87Sr/86Sr signatures of Group C2 are relatively homogeneous (~0.7125).
As previously evidenced by major elements, the Group C1 chemistry is dominated by high Cl content and is modified by cationic exchange due to saline water intrusion. When Sr, like Ca, is desorbed from clays into the solution, the strontium isotopic signature of the water can be significantly modified according to the 87Sr/86Sr of the desorbed Sr. We note that the two samples with the highest Sr concentrations (Cab5 and Cab17) present the lowest 87Sr/86Sr
22 ratios close to that of present-day seawater. Nevertheless, Cab24 which presents the highest Cl concentration (47.2 mmol.L-1), has a 87Sr/86Sr = 0.71168, far from the expected marine signature, and probably gained radiogenic Sr by Sr desorption. Similarly, the groundwater of well Tem tudo sampled at various depth displays similar 87Sr/86Sr ratios (0.71005) with a lower Cl content (14 mmol.L-1). Based on major elements, Well Cab17 and Cab24 display respectively a 4% and 6-7 % mixing with seawater.
One should then consider the succession of different sequences of gains and losses of Sr linked with the alternation of marine transgression and wet periods of recharge. This phenomenon can be enhanced by anthropic reversing of the natural upward flow favouring fresh water recharge. The various clay levels found at depth obstruct the downward infiltration, alternatively of freshwater and seawater and enhance cationic exchange.
4.4.3 T-Q and surface waters: continental vs. marine origins
The Barreiras formation results from the erosion of the northern basement and formations (Barbosa et al., 2003) and is mainly located north of the RMR, with residual reliefs in the southern RMR. Lying indistinctly above the two basins, the Barreiras aquifer (Group T-Q2) presents rather high 87Sr/86Sr values (0.71396 - 0.71861) (Fig. 6). Logically, the range of the
87Sr/86Sr ratio is close to the 87Sr/86Sr of the northern block groundwaters. Its chemistry is
characterized by low Cl contents but is modified by cationic exchange due to saline water intrusion (Fig. 4). According to the mixing lines in Fig. 6, the groundwater of this surficial aquifer (e.g. Bar64, 0.71396) can be diluted by recharge waters such as ETA1 or ETA0. The Boa Viagem aquifer (Group T-Q1) displays a narrow range of strontium isotopic ratios (0.70925-0.72189) slightly superior to the marine one (Fig. 6). These waters are only moderately affected by Cl (max Cl = 9.67 mmol.L-1) and enriched in HCO3. The high HCO3
concentrations and the good correlation between HCO3 and Sr concentrations (R2=0.73)
suggest that the calcareous formations (Estiva, Gramame and Maria Farinha) can imprint the chemical signature of the Boa Viagem aquifer. In addition, the low strontium isotopic signature of the T-Q1 group can be explained by the carbonate dissolution of the Boa Viagem sediments, where the CaCO3 contents increase towards the seashore (Alheiros et
al., 1995), or the carbonated formations, by release of strontium presenting an isotopic signature close to that of the sea during the last Pleistocene and Holocene transgressions. In
23 this case, no clear distinction of marine intrusion and carbonate dissolution is possible on the basis of 87Sr/86Sr.
Figure 6: a) 1/Sr (L.mol-1) vs. strontium isotopes in a) the Beberibe, b) Cabo, c) Barreiras and Boa Viagem aquifers, and d) Cl concentrations vs. strontium isotopes in the sampled groundwater of the study area. Data from rock samples, i.e. from the basement of the Paraíba basin (Brito Neves, 1975) and from the Gramame formation (Nascimento-Silva et al., 2011) are also indicated. Errors are within the point. Dashed lines represent mixing of seawater with surface waters considered as recharge (ETAs).
24
4.5 Boron origins, mixing and processes using B isotopes
The RMR groundwaters display a remarkably broad range of δ11B values (6.7 to 68.5 ‰) and
B concentrations (2 to 56 mmol.L-1) suggesting that multiple sources and processes affect boron behaviour. Except for the Beberibe River, the surface water network displays δ11B
values similar or slightly superior to the marine one (δ11B = 39.1‰; e.g. (Vengosh et al., 1994)) : the Capibaribe River (δ11B = 39.5 ‰ and B = 0.16 mmol.L-1), ETA2 (40.3‰), ETA0
(42 ‰), and ETA1 (45.5 ‰) (Fig. 7). Although we did not directly measure the δ11B in local
rain, the ETA samples (ETA0 and ETA2 of respectively 40.3 and 42 ‰), which are considered as representative for recharge, display nearly unaltered seawater signatures, likely to be inherited from coastal rain, without any significant boron input from interaction with silicate minerals (Millot et al., 2010; Négrel et al., 2002). In other words, water-rock interaction does not release B in solution, probably because the regional basements and their associated weathering profiles lack of easily leachable boron-bearing mineral phases. Downstream, the low boron signature collected in the city in the Capibaribe and Beberibe Rivers and especially the low δ11B of RB2 (6.7 ‰) that can be well attributed to a contribution
of sewage (Fig. 7). Indeed, the estuary receives wastewater from all sewage drains and wastewater treatment plants, seawater and fresh water.
4.5.1 The RMR northern block of the Paraíba basin
Water interacting with silicate rocks generally has low δ11B values (−10 to +10 ‰) including
some Precambrian granites (-3.2 to +6.8‰) as shown by numerous studies (Aggarwal et al., 2000; Barth, 2000; Lemarchand and Gaillardet, 2006; Négrel et al., 2002; Pennisi et al., 2000; Spivack and Edmond, 1987; Vengosh et al., 1995). All the groundwater samples from the Beberibe aquifer present quite homogeneous δ11B signatures (36.8-42.5 ‰) close to the
marine value (39.1 ‰) except for group B1. The main range is thus clearly higher than expected for water interacting with basement rocks (granitoids, orthogneiss).
Group B2 presents the lowest B concentrations and similar δ11B signatures to that of the surface water draining the two basements. As the ETA samples most probably have an unmodified recharge signature, all the dissolved boron in B2 groundwater samples is supposed to come from the recharge. At higher boron concentrations in group B3 samples, the δ11B is still close to that of seawater, thus indicating mixing with (palaeo-) seawater,
25 imprint its δ11B signature on Group B3. As the Beberibe and its upper formations were
covered by the sea during the Pleistocene transgression, the scheme is realistic. For instance, based on δ11B and B concentration, we calculated that Beb62 is impacted by a contribution of 1% of seawater (or mangrove water), which is well consistent with the previous calculations based on other tracers (Cl and the couple 87Sr/86Sr vs. Sr content). Nevertheless, this scenario cannot explain the isotopic and chemical characteristics of Group B1 (Beb51-59-60) that displays B contents between 7 and 10.5 µmol.L-1 with a B/Cl ratio higher than that of seawater (0.8·10-3 eq.eq-1) ranging from 1.36 to 1.72·10-3 eq.eq-1 and, to our knowledge, one of the highest δ11B signatures recorded in groundwater to date (63.7 to
68.5 ‰). The highest measured values up to now were recorded by (Hogan and Blum, 2003) in a coastal aquifer. Such ratios cannot be explained only by water-rock interaction and a strong fractionating process is required. High 11B-enrichment was first evidenced in the hypersaline Dead Sea brines (δ11B~57 ‰) and explained by evaporation of seawater,
precipitation of salts, and, conjointly, preferential adsorption of 10B onto clay minerals (Vengosh et al., 1991). High δ11B values also reflect salinization of groundwater by mixing
with marine brines (39-60 ‰; (Vengosh et al., 1994), production of treated water by reverse osmosis in desalination plant (δ11B=58.7±2 ‰; (Kloppmann et al., 2008), and 10B-depletion
through sorption before infiltration of industrial brine through settling points into the alluvial Rhine aquifer (maximum 11B values of 57.1 ‰) (Elsass et al., 2001). Finally, δ11B superior to 55 ‰ were evidenced in a Mediterranean coastal aquifer impacted by salty water intrusion (Petelet-Giraud et al., 2013).
First of all, when the mangrove covered almost the whole plain, the mangrove water (seawater mixed with a variable amount of fresh water) may have interacted with clay particles, iron oxides and organic matter, leading to fractionated δ11B. This water can then intrude the aquifer. This scenario should generate a fractionated signature in most of the Beberibe wells, which is not the case, meaning that this hypothesis is probably not relevant. Therefore, another scenario has to be proposed. Considering that boron fractionation leading to high 11B values results from 10B absorption, i.e. a decrease of the boron content in solution, the measured values in Group B1 should originate from a relatively B-rich water, in any case more concentrated than the identified present day recharge. Yet, group B1 is located very close to the sampling point of RC1 in the Capibaribe River. RC1 is relatively salty because of the tide influence as shown by Paiva (2004) who also evidenced infiltration from the Capibaribe River through the banks. Thus RC1 water (or even more salty water) can infiltrate through the river banks, and interact with clays, iron oxides, and organic matter
26 present in the palaeo-Capibaribe channel between 10 and 90 m depth during infiltration. It would thus result in a fractionated B signature due to 10B adsorption (Goldberg and Suarez, 2012) for which a Rayleigh distillation model can be applied. Boron fractionation through a Rayleigh distillation of RC1 water, considering a boron isotope enrichment factor ε of -30 ‰ at 30°C between dissolved and adsorbed boron, can explain the measured highly fractionated values in group B1 (Fig. 7). This enrichment factor corresponds to fractionation factor α of 0.969 (Palmer et al., 1987).
4.5.2 The RMR southern block of the Pernambuco basin.
In the Cabo aquifer, δ11B signatures vary between 25.5 ‰ and 49.9 ‰, with B concentrations
between 2.5 and 25 µmol.L-1 (Fig. 7). Two groups can be distinguished in the δ11B vs. B/Cl diagram, in agreement with previous observations solely based on major and trace elements. Group C1 presents a B/Cl ratio lower than that of seawater together with the highest Cl concentration of the sampling campaigns, with δ11B varying between 39 and 50 ‰. Cl being
a conservative element, the low B/Cl reflects a loss of B related to preferential 10B adsorption, a process commonly observed in the context of aquifer salinization. This phenomenon is particularly well illustrated in a δ11B vs. B/Cl diagram (Fig. 7), where group C1 plots within the
domain of seawater intrusion defined by (Vengosh, 2003). As suggested above, it may result from a complex succession of saline intrusion and freshening cycles enhanced in the last decades by the high pumping rates. Note that some samples with a B/Cl lower than the marine ratio (Cab13-114-5) present a δ11
B lower than the marine one.
Except Cab20 (δ11B=25.5‰), the narrow range of δ11B variation (30-34 ‰) in Group C2
cannot be attributed to evaporite dissolution which δ11B usual range is 20-30 ‰ (Vengosh, 2003), as such deposits were not described locally but suggests a relative equilibrium with the mineral phases regarding B within the Cabo aquifer. The freshening process previously evidenced for group C2 is confirmed by the high B/Cl ratio illustrating 10B release from the matrix to the solution, thus implying a δ11B decrease (30-34‰) compared to the original signature equivalent to that of seawater. This phenomenon is particularly well illustrated by Cab20, presenting the most pronounced Na enrichment, and the highest B/Cl ratio together with the lowest δ11B (25.5‰).
A very detailed analysis of the basement groundwater samples is needed to suggest the same scenario for Fis123 and Fis125 presenting a high B/Cl ratio and δ11B of respectively 34
‰ and 25.2 ‰. The basement aquifer in this low land area was previously intruded by seawater that was further flushed by a fresh recharge component. The highest value (Fis70:
27 41.1 ‰) with a moderate salinity could represent a diluted palaeo-seawater with little interaction with the basement matrix and could reflect the signature of the recharge with a δ11B close to the meteoric recharge (Négrel et al., 2002). Moreover, Well Fis70 is located
near a river fed by the Duas Unas dam, and can easily receive a recharge component from the surface water.
4.5.3 Tertiary-Quaternary surficial aquifers: influence of wastewaters
In the Boa Viagem and Barreiras aquifers, the δ11B range (10.5‰ to 44 ‰) and B
concentrations (2 to 26 µmol.L-1) again point out a high variability of groundwater mineralization origins (Fig. 7). Relatively to the δ11B of recharge (40.3 and 42 ‰) and to
B-rich sewage waters with δ11B classically ranging from 0 to 15 ‰ (Cary et al., 2013;
Kloppmann et al., 2009; Vengosh et al., 1994), the surficial groundwater present a varying contribution of wastewater.
The Na-Cl type of Group T-Q2 combined with a low mineralization related to limited water-rock interactions, displays a B content varying from 2 to 3.7 µmol.L-1 with a δ11B from 32.3 to 44 ‰. It could represent the theoretical recharge domain. In T-Q1, the Ca-HCO3 samples
(δ11B ranging from 10.5 and 32.3 ‰ and B contents between 5.7 and 21.5 µmol.L-1) display a
mixing between the recharge and the sewage water while the Na-Cl samples (δ11B between
29.2 and 35.1 ‰; B content varying between 3 and 13.4 µmol.L-1) can be strongly influenced
28 Figure 7: δ11B vs B concentrations and B/Cl (eq.eq-1) in the groundwaters of Recife. Boxes in
grey are from Vengosh (2003). Errors (0.3 ‰) are within the points. The dashed lines are the marine values.
5. Synthesis and conceptual model of aquifer functioning in the RMR: impact on salinity origins and processes
In the context of southern coastal urban aquifers facing climate change, the sustainability of the groundwater resource is a critical issue and water resource management raises as a major concern in Brazil (Araújo et al., 2015). In the driest state of Brazil, the coastal RMR faces strong droughts (1998-99 and 2012-13) in a worrisome context of piezometric levels decrease that imply insufficient recharge rates to equilibrate the water demand (Costa, 2002; Costa et al., 2002; Monteiro, 2000; Montenegro et al., 2010a). In addition to the new program of groundwater level monitoring and quantification of groundwater abstraction for the Water and Climate Pernambuco Agency (APAC), a tri-dimensional approach covering the RMR plain and its five major aquifers, combining chemical and isotopic tracers was needed to pinpoint the main processes of groundwater salinization. Indeed, the initial signature of the infiltrated water of different origins can be overprinted by several processes and water-rock interactions, enhanced by the presence of exchange phases such as clays, iron oxides or organic matter in the geological formations. These modified chemical signatures however reflect the history and pathways of water, and the main processes can be emphasized as follows (Fig. 8 and Table 3).
5.1. Geological constraints on groundwater chemistry and water-rock interactions
The chemical and isotopic results show that the high diversity of the geological bodies typical of estuaries (alluvial fans, palaeomangroves, sandy or clayey sediments…) highly constrains the heterogeneity of the groundwater chemistry and isotopic compositions. Integrating this heterogeneity is necessary to explain the salinization processes and groundwater pathways (Fig. 8). Moreover, the distinct geological origins of the sediments constituting the main RMR aquifers imprint distinct signatures of the groundwater bodies as revealed by strontium isotopes, especially between the Beberibe and Cabo aquifers, in relation with the weathering products of the Paraíba or Pernambuco crystalline basements respectively.
29
5.2 Palaeoseawater intrusion and related processes
Despite the relatively moderate groundwater salinity (mean CE of 979 µS.cm-1, n=102; median of 503 µS.cm-1) measured in the accessible wells during this study, a salty water intrusion and the related cationic exchange are clearly evidenced in the deep Cabo and Beberibe (respectively group C1 and B3) and in the surficial Barreiras aquifers (group T-Q2) based on the major element contents, and the Sr and B isotope signatures. In these groups Figure presenting the highest conductivities, cation exchange triggered by salinity, induces depletion in Na and B together with enrichment in Ca and Sr. Based on group C1, a maximum of 6-8 % of mixing with salty water of seawater type has been evidenced.
Considering the local geological, geomorphological and climate history with the various marine transgression and regression phases that have affected the whole RMR plain, the deep salty groundwater most probably originates from seawater intrusion during the Pleistocene marine transgression (123,000 y BP) and through infiltration from the palaeomangroves covering the lower part of the RMR since Quaternary. In the present-day mangrove, water is a mix of seawater and fresh water (in various proportions in space and time) submitted to evaporation that infiltrates the aquifer as evidenced by δ18O and δ2H for some samples especially located in the vicinity of the residual mangrove area.
5.3 Aquifer freshening and related processes
Surprisingly, Na-HCO3 waters typical of a freshening process, i.e. replacement of salty water
by fresh water leading to Ca and Sr adsorption and release of Na, and also 10B release from the matrix to the solution (group C2), were only identified locally in the Cabo aquifer in the Boa Viagem neighbourhood (Fig. 8). Some Pleistocene and Holocene wet periods, e.g. the wet Lateglacial period, are supposed to have enhanced fresh water recharge of the aquifers. This process is evidenced in the Cabo aquifer where a large palaeochannel at 40-100 m depth made of thick sandy-clayey deposits with a spatial heterogeneity could offer a preferential flowpath for upstream fresh water recharge. It is worth noting that the salinized and freshened parts of the Cabo aquifer in front of the ocean are close neighbouring areas (Fig. 2) reinforcing the idea that the geological settings favour local salinization and local fresh water infiltration. This freshening process has been most certainly enhanced since the last decades where large water abstraction has led to reversing of the natural upward flow. The fresh water intrusion can result of seepage from the upper aquifer due to new hydraulic conditions and/or from leakage along improperly sealed wells.
30
5.4 Infiltration through paleochannels and local processes
The major role played by the palaeochannels and the present-day Capibaribe River channel for the deep Beberibe aquifer recharge has been evidenced by boron isotopes. Indeed, three groundwater samples from the Beberibe aquifer located in the immediate vicinity of the Capibaribe River present high fractionated values for boron isotopes that can only result from infiltration of relatively salty water with B interacting with clays, iron oxides, and organic matter.
5.5 Present-day groundwater salinisation
If no temporal evolution of the groundwater chemical composition has been evidenced in most of the Cabo wells between the two sampling campaigns, it is nevertheless observed in the surficial Boa Viagem aquifer in front of the ocean. An increase of salinity at the end of the dry season can be attributed to present-day direct seawater intrusion. Moreover, the Cabo groundwater also locally shows a temporal increase of salinity with salty water leaking from the surficial aquifer possibly because of downward fluxes favored by pumping. The palaeochannels and estuaries, the present-day estuary and riverbanks are preferential pathways for present-day seawater intrusion in the surficial aquifer. A present-day seawater/mangrove water infiltration in the mangrove area cannot be excluded in its immediate vicinity.