Development of a High Temperature Gas-Cooled Reactor
TRISO-Coated Particle Fuel Chemistry Model
by
Jane T. Diecker
B.S. Nuclear Engineering
University of Missouri-Rolla, 2003
MASSACHUSE-IIS INSTITUTE OF TECHNOLOGY MAR 2 8 2006LIBRARIES
SUBMITTED TO THE DEPARTMENT OF NUCLEAR SCIENCE AND
ENGINEERING IN PARTIAL FULFILLMENT OF THE REQUIREMENTS
FOR THE DEGREE OF
MASTER OF SCIENCE IN NUCLEAR ENGINEERING AT THE
MASSACHUSETTS INSTITUTE OF TECHNOLOGY
June 2005
© 2005 Massachusetts Institute of Technology. All Rights Reserved.
Signature of Author
I
ARCHIVES
Department of Nuclear Science and Engineering
May 6, 2005
Certified by
Ronald G. Ballinger
Professor of Nuclear Science and Engineering
Associate Professor of Materials Science and Engineering
Thesis Supervisor
Accepted by
Accepted by
tsJU
~ ~ ~
- Michael
Driscoll
Professor of Nuclear Science and Engineering
i, h
X?
~
X
Thesis Reader
Jeffrey A. Coderre
Associate Professor of Nuclear Science and Engineering
Chairman, Departmental Committee on Graduate Students
-Development of a High Temperature Gas-Cooled Reactor
TRISO-Coated Particle Fuel Chemistry Model
by
Jane T. Diecker
Submitted to the Department of Nuclear Science and Engineering
on May 6, 2005 in partial fulfillment of the requirements for the degree of Master of
Science in Nuclear Engineering at the Massachusetts Institute of Technology
ABSTRACT
The first portion of this work is a comprehensive analysis of the chemical environment in
a High Temperature Gas-Cooled Reactor TRISO fuel particle. Fission product inventory
versus bumrnup
is calculated. Based on those results a thermodynamic analysis is
performed to determine fission product vapor pressures, oxygen partial pressure, and
carbon monoxide and carbon dioxide gas pressures within the fuel particle.
Using the insight gained from the chemical analysis, a chemical failure model is
incorporated into the MIT fuel performance code, TIMCOAT. Palladium penetration of
the SiC layer is added to the fracture mechanics failure model. Rare-earth fission product
and palladium corrosion of the SiC layer are additionally modeled. The amoeba effect is
added as a new failure mode.
The palladium penetration model has the most significant result on the overall fuel
performance model and increases the number of predicted particle failures. The thinning
of the SiC layer due to fission product corrosion has a slight effect on the overall fuel
performance model. Finally, the amoeba effect model does not lead to any particle
Acknowledgements
First and foremost I would like to thank my Thesis Advisor, Dr. Ballinger. His
guidance and encouragement were invaluable and I was very fortunate to have him as an
advisor.
Next, I would like to thank my labmates, Chaiyod Soontrapa aka Pun and
Jeongyoun Lim for all their help with issues ranging from interpreting FORTRAN 77 to
how to use the photocopier.
In addition, I would like to thank Pavel Hejzlar for all of his assistance with my
ORIGEN input file.
I thank the Nuclear Regulatory Commission for supporting me financially my
first year at MIT with a Research Assistantship and the Department of Energy for the
generous fellowship they have provided over the past academic year.
Thank you to my family for their love and support.
Last, but certainly not least, I would like to thank my labmate Dave Rigual for
introducing me to coffee and for our many coffee breaks.
Table of Contents
Page
Abstract
2
Acknowledgements
3
Table of Contents
4
Chapter 1. Introduction
5
1.1 Description of High Temperature Gas-Cooled Reactors
5
1.2 Description of TRISO-Coated Fuel Particles
7
1.3 Fuel Performance Modeling
8
1.4 Thesis (Objectives
10
Chapter 2. Characterizing the Chemical Environment in TRISO Fuel
11
2.1 Fission Product Inventory Determination (ORIGEN2 Calculation)
11
2.2 SOLGASMIX-PV Calculation
16
2.3 SOLGASMIX-PV Results
22
2.3.1 Chemical Equilibrium
22
2.3.2 Chemical State
27
Chapter 3. Fission Product Attack of SiC
35
3.1 Mechanism of Rare-Earth Fission Product Attack
35
3.2 Mechanism of Palladium Attack
37
3.3 Modeling Fission Product Attack in TIMCOAT v.2
40
3.3.1 Fracture Mechanics Model
41
3.3.2 Pressure Vessel Model
45
Chapter 4. Amoeba Effect
48
4.1 Description
48
4.2 Modeling the Amoeba Effect in TIMCOAT v.2
49
Chapter 5. TIMCOAT v. 2 Results
52
Chapter 6. Conclusions and Future Work
59
Appendix A. ORIGEN2 Cross-Section Library
62
Appendix B. SOLGASMIX-PV Files
120
B. 1 SOLGASMIX-PV Example Input File
120
B.2 SOLGASMIX-PV Example Output File
125
Chapter 1. Introduction
1.1 Description of High Temperature Gas-Cooled
Reactors
Due to their high efficiency and passive safety features, High Temperature
Gas-cooled Reactors (HTGRs) are strong candidates for future electricity and hydrogen
production. [1] Current HTGR designs feature graphite moderated, helium cooled cores,
which utilize ceramic, coated fuel particles dispersed in a graphite matrix. There are two
types of HTGR cores: pebble bed and prismatic. The 120MWe Pebble Bed Modular
Reactor (PBMR) core contains 330,000 fuel pebbles each 6cm in diameter. As illustrated
in Figure 1.1, each pebble contains 15,000 fuel particles embedded in a graphite matrix.
During operation, the pebbles continuously cycle from the top to the bottom of the core.
After passing through the core, each pebble is checked for integrity and accumulated
bumrnup. It is then either removed from the stream or recycled through the core. If a
pebble is removed from the stream, a fresh pebble is added to the top of the core. The
normal operation peak fuel temperature is approximately 1200°C and the fuel maximum
design basis event temperature is 1600°C. [2] The normal operating temperature is
expected to increase in future PBMR designs as higher reactor outlet temperatures are
sought.
el keme!I
fuel pert.icle
Figure 1.1 Pebble Bed Reactor Fuel [3]
Prismatic reactor cores are stationary. A prismatic fuel element can be seen in
Figure 1.2. The fuel particles are embedded in cylindrical fuel compacts, which are then
embedded in graphite blocks. These blocks also contain cooling passages and locations
for absorber and control materials. [1] The General Atomics Gas Turbine-Modular
Helium Reactor (GT-MHR) design is 600MWth and 286MWe. The fuel particles have
the same normal peak operating and design basis event temperatures as those in the
PBMR. [4]
islli "tsee,
A I -1
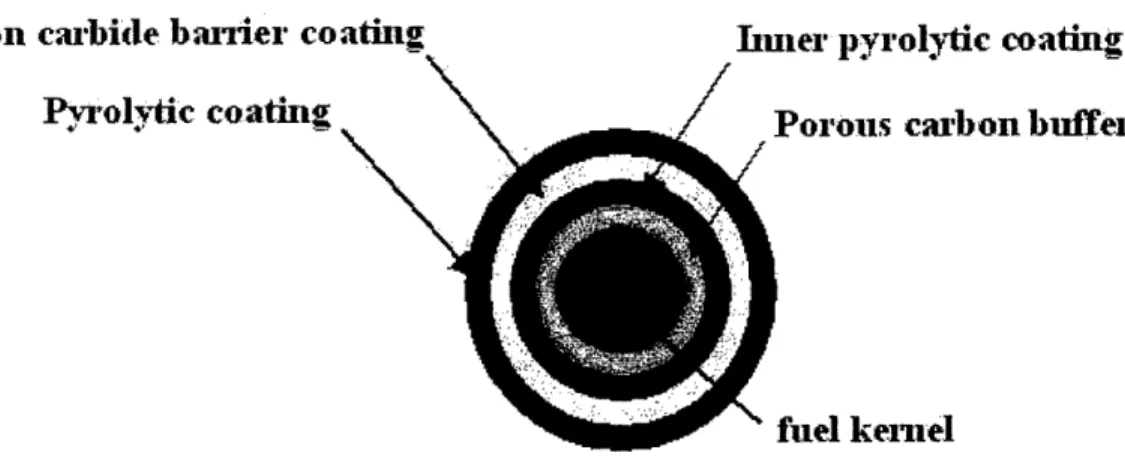
1.2 Description of TRISO-Coated Fuel Particles
Both pebble bed and prismatic type HTGR cores contain coated fuel particles like
the one depicted in Figure 1.3. They consist of a spherical fuel kernel coated with layers
of porous pyrolytic carbon, inner dense pyrolytic carbon (IPyC), silicon carbide (SiC),
and outer dense pyrolytic carbon (OPyC). The fuel kernel is typically UO
2, UCO, or UC
2and 300-600pm in diameter. The nuclear fission process causes the kernel to produces a
mixture of radioactive fission products including gaseous species, which cause stresses in
the coatings and solid metallic species, which chemically interact with the coatings. [1]
The porous PyC or buffer layer is directly in contact with the kernel and provides void
volume for gaseous fission products and and non-fission product gases, including carbon
monoxide. The IPyC layer acts as the first barrier against fission gas pressure from the
fuel kernel and resists migration of actinides and fission products. It effectively contains
krypton, xenon, and iodine. [1 ] The SiC layer is the primary barrier to the diffusion of
metallic fission products out of the particle and acts as the pressure vessel. [3,4] SiC was
initially selected as a fission product retaining barrier due to its small interatomic
spacings, low neutron capture cross section, and good thermal conductivity. It also
reduces the uranium migration during manufacturing, thus minimizing the fuel
contamination of the outermost layer. The integrity of the SiC layers is vital for HTGR
operation. Finally, the OPyC layer protects the SiC layer during the manufacturing
process and mechanically protects the SiC during operation. Under irradiation, the OPyC
layer shrinks, which puts the SiC layer in compression, preventing it from fracturing due
to over-pressurization except at high burnup. [1] These particles are known as
TRISO-coated fuel particles because of the three isotropic (IPyC/SiC/OPyC) structural layers. [1 ]
Silicon carbide barielr coating
Iner pyrolytic coating
P9~~f"nlie ntinVX / _. Ise
orouls caron muier
fuel kernel
Figure 1.3 Schematic of TRISO-Coated Fuel Particle Cross Section [31
1.3 Fuel Performance Modeling
If a TRISO-coated fuel particle fails, fission products are released to the coolant.
Both mechanical and chemical processes can cause fuel failure. The original version of
the integrated performance model for HTGR fuel, TIMCOAT, developed at MIT,
emphasizes mechanically induced failure of the fuel particle layers. The code allows for
both pebble bed and prismatic core configurations. For the pebble bed case, refueling of
pebbles is simulated to account for the non-uniform environment in the reactor core and
history-dependent particle behavior. TIMCOAT marks a significant advancement in
TRISO particle fuel modeling in that it contains a pyrocarbon crack induced fuel failure
model based on a probabilistic fracture mechanics approach. Earlier models used a
simple pressure vessel failure model, in which failure was assumed to be driven by a
circumferential tensile stress in the SiC layer. However, experimental data has shown that
while the stress in the SiC layer is compressive during the early irradiation period,
particle failures have been observed during this time. The failure process during early
irradiation is believed to be driven by cracking of one of the pyrocarbon layers followed
the PyC and the SiC results in a local stress concentration factor, which may cause a
locally high tensile stress even while the net circumferential stress in the layer is
compressive. Thus, a fracture mechanics approach is necessitated. TIMCOAT simulates
the effects of anisotropic irradiation-induced dimensional changes and isotropic
irradiation-induced creep. Furthermore, the fluence dependence of Poisson's ratio in
irradiation creep is taken into account. TIMCOAT has been tested with results
comparable to experimental data. [1]
In addition to mechanically induced failure mechanisms, chemical mechanisms
can contribute to the failure of the TRISO fuel coating. Nuclear reactor fuel chemistry is
characterized by fission product production and oxygen potential. These are in turn
burnup and temperature dependent. The first chemically induced failure mechanism is
fission product attack of the SiC layer. There are two major types of fission product
attack: Pd attack and Rare-earth element attack. The Pd-SiC interaction has been
identified as the most relevant in both oxide and carbide fuels. [6] Pd attack is primarily
temperature dependent. Rare-earth element-SiC (RE-SiC) interactions also occur in
carbide fuel. [6] Rare-earth attack is controlled by the chemical state of the rare-earth
fission products, which is determined by the oxygen partial pressure in the fuel.
The second chemically induced fuel failure mechanism is the thermal migration
of the fuel kernel up the temperature gradient and through the coating layers, known as
the amoeba effect. The fuel kernel migrates from the cold to the hot side by dissolving
carbon. Simultaneously, carbon is rejected as graphite on the cool side. [7] A solid-state
carbon diffusion process controls the migration rate. [8] The process is highly
1.4 Thesis Objectives
The inclusion of a chemistry model would greatly enhance the capability of the
overall TIMCOAT model. Moreover, modeling the chemistry in a TRISO-coated fuel
particle would allow for the inclusion of additional chemistry-related degradation modes
that, while they only operate at the upper range of the normal operating temperature,
would make the overall model more complete. In addition, this would expand the
modeling envelope of the code to include transient and accident simulation capability.
This work focuses on the following objectives:
1. To fully characterize the chemical environment in a TRISO-coated fuel particle.
A. Fission Product Concentrations
B. Gas Pressures
2. To model rare-earth attack of the SiC layer in TIMCOAT.
3. To model palladium attack of the SiC layer in TIMCOAT.
4. To model the amoeba effect in TIMCOAT.
5. To incorporate these models into the overall failure model in TIMCOAT.
To achieve these objectives, the fission product concentrations in a TRISO fuel
particle will be calculated using the ORIGEN2 bumrnup
code. The calculated fission
product concentrations will be input into the thermodynamic code SOLGASMIX-PV to
calculate the gas pressures present in the fuel particle and complete the characterization
fo the fuel particle chemical environment.
Next, the impact of the chemical environment will be discussed and the
TIMCOAT model will be modified accordingly in three distinct ways. The first
modification will simulate crack propogation due to palladium attack of the SiC layer.
third modification will be the addition of the amoeba effect. Finally, each of these
models will be combined in the overall TIMCOAT v.2 failure model.
Chapter 2. Characterizing the Chemical
Environment in TRISO Fuel
2.1 Fission Product Inventory Determination
(ORIGEN2 Calculation)
The exact amounts of fission products present in the fuel at any given time were
calculated with ORIGEN2. ORIGEN2, developed at Oak Ridge National Laboratory, is
an isotope generation and depletion code. It uses a matrix exponential method to solve a
large system of coupled, linear, first-order differential equations with constant
coefficients to find the amount of a nuclide, i, changing as a function of time. The rate at
which the amount of nuclide i changes as a function of time (dXi/dt) is calculated as
follows [101:
dX
_N Nd
-Z
E
1
1
i2jX
+
Zfik
kXk
-(Ai
+ 05-i +
ri)Xi
+ F
(2.1)
dt
j=1
k=1
i= 1,....,N
where
Xi = atom density of nuclide i
N = number of nuclides
lij = fraction of radioactive disintegration by other nuclides, which leads to formation of
species i
fik
fraction of neutron absorption by other nuclides, which leads to formation of species
i
CYk
spectrum averaged neutron absorption cross section of nuclide k
ri = continuous removal rate of nuclide I from the system
F = continuous feed rate of nuclide I
Since N nuclides are being considered, there are N equations of the same form.
Integration of this set of simultaneous differential equations yields the amounts of each
nuclide present at the end of each time step. There are a total of 1700 nuclides in the
ORIGEN2 databases. These nuclides are divided into three segments: actinides, fission
products, and activation products. Data for the nuclides is provided in radioactive decay,
photon production, and cross section libraries. The decay library provides half-lives,
decay modes, recoverable energy, natural abundances, and toxicities. The photon library
supplies the number of photons per decay in an 18 energy group structure. The cross
section library provides the cross sections for (n,y), (n,2n), (n,3n), (n,at), (n,p), and (n,
fission) reactions. While the photon and decay libraries apply for all cases, the cross
section library varies with reactor and fuel type. [10]
An ORIGEN2 input file was created based on the important PBMR fuel
parameters contained in Table 2.1.
Table 2.1 PBMR Fuel Parameters used in ORIGEN2 Calculation [from ESKOM]
Thermal Power
302 MW
Mass of Uranium / Fuel Pebble
9g
Discharge Fuel Bumrnup
80 GWd/MTU
Maximum Fuel Bumrnup
100 GWd/MTU
The specific power was calculated as follows:
9gramsU 1x1O-
6MT
330,000pebbles x
x
=2.97MTU
(2.2)
pebble
gram
302MW
302MW
= 101.7MW I MTU
(2.3)
2.97MTU
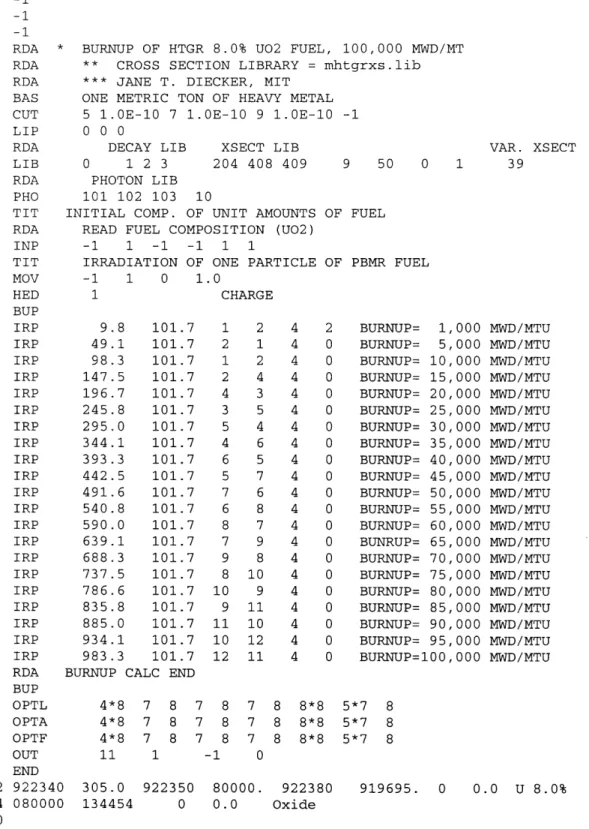
The ORIGEN2 input file used for one ton of
U0
2fuel can be seen in Figure 2.1. For the
purposes of determining the chemical state of the fission products, it is not necessary to
know which particular isotopes are released by fission, but rather which elements are
present at a certain time. Among several other values, the ORIGEN2 output provides the
mass of each fission product element in grams at each specified burnup. Table 2.2
displays the values for the fission products with the highest concentrations and relatively
significant half-lives. The cross section library used for the ORIGEN2 calculation can be
found in Appendix A.
* BURNUP OF HTGR 8.0% U02 FUEL, 100,000 MWD/MT
** CROSS SECTION LIBRARY = mhtgrxs.lib
*** JANE T. DIECKER, MIT
ONE METRIC TON OF HEAVY METAL
5 1.0E-10 7 1.OE-10 9 1.0E-10 -10 0 0
DECAY LIB
XSECT LIB0 1 2 3 204 408 409
PHOTON LIB
101 102 103 10
INITIAL COMP. OF UNIT AMOUNTS
READ FUEL COMPOSITION (U02)
-1 1 -1 -1 1 1IRRADIATION OF ONE PARTICLE
-1 1 9.8 49.1 98.3 147. 5 196.7 245.8 295.0 344.1393.3
442. 5 491.6 540.8 590.0 639. 1 688.3737 .5
786.6 835.8 885.0 934.1 983.3 9 50 0 1 VAR. XSECT39
OF FUELOF PBMR FUEL
1 0 1.0CHARGE
101.7 101.7 101.7 101.7 101.7 101.7 101.7 101.7 101.7 101.7 101.7 101.7 101.7 101.7 101.7 101.7 101.7 101.7 101.7 101.7 101.7 1 2 1 2 4 3 5 4 6 5 7 6 8 7 9 8 10 9 11 10 12 2 4 2 1 4 0 2 4 0 4 4 0 3 4 0 5 4 0 4 4 0 6 4 0 5 4 0 7 4 0 6 4 0 8 4 0 7 4 0 9 4 0 8 4 0 10 4 0 9 4 0 11 4 0 10 4 0 12 4 0 11 4 0BURNUP CALC END
4*8 7 8 4*8 7 8 4*8 7 8 7 8 7 8 8*8 5*7 7 8 7 8 8*8 5*7 7 8 7 8 8*8 5*7 11 1 -1 0 305.0 922350 134454 0 80000. 922380 0.0 Oxide
BURNUP=
BURNUP=
BURNUP=
BURNUP=
BURNUP=
BURNUP=
BURNUP=
BURNUP=
BURNUP=
BURNUP=
BURNUP=
BURNUP=
BURNUP=
BUNRUP=
BURNUP=
BURNUP=
BURNUP=
BURNUP=
BURNUP=
BURNUP=
1,000
5,000
10,000 15,000 20,00025,000
30,000
35,000
40,000 45,00050,000
55,000
60,000
65,00070,000
75,00080, 000
85,000 90, 000 95,000MWD/MTU
MWD/MTU
MWD/MTU
MWD/MTU
MWD/MTU
MWD/MTU
MWD/MTU
MWD/MTU
MWD/MTU
MWD/MTU
MWD/MTU
MWD/MTU
MWD/MTU
MWD/MTU
MWD/MTU
MWD/MTU
MWD/MTU
MWD/MTU
MWD/MTU
MWD/MTU
URNUP=100,000
MWD/MTU
8 8 8 19695. 0 0.0 U 8.0% 0Figure 2.1 Example ORIGEN2 PBMR Input File
-1 -1 -1
RDA
RDA
RDA
BAS CUT LIPRDA
LIBRDA
PHO TITRDA
INP TITMOV
HED
BUP IRP IRP IRP IRP IRP IRP IRP IRP IRP IRP IRP IRP IRP IRP IRP IRP IRP IRP IRP IRP IRPRDA
BUPOPTL
OPTA
OPTF
OUTEND
2 922340 4 080000C- 0
xx
0
mm
0
00
0000mx
I I I I I I I I I I I I I I I I I I I I I I I I I I I I I I I I I000o
00000000O'
mx
0
0
')000
I I I I I I I I I I I I I I I I I00oom0 00 00 00 mm00
I I I I I I I I I I I I0 m0m
I I I I I0
I t III I I I I I I I I I I I I I LO C) OC' L~
OC CA C- C M C -) LO M~ - Q0 t c- CD~0000000x
xx
m000
m00
0 310 0
I I I I I I I I I I I I I I I I I I I cI q CID LO - I I I : I I - I I I : I I IQ00o 00 0 00 C)0')mC)00 C)0
0m0)0
Io C" L -I LO x cI L I 0 Q0 m m x CI - m m t M0 ,t O n x cq (. t cq CD C- C m LoC)C-C'
44H
'
~,
444
l 4C
fsCsL~C cl444
y f I0 I I I I C I I I I I I 0 I I I I 0 I I I C: CD I C) C) C: C: C C) C: C: C: C CD CD C) C q- em,c.}
0
*,,mi r~ ~, mW c r2.2 SOLGASMIX-PV Calculation
The oxygen, carbon monoxide, and carbon dioxide partial pressures, as well as
the vapor pressures and chemical states of the fission products, at a given temperature
and bumrnup
were calculated with the SOLGASMIX-PV computer code developed at Oak
Ridge National Laboratory. [11] SOLGASMIX-PV calculates equilibrium composition
and vapor pressure based on a minimization of the free energy of the system.
SOLGASMIX-PV was chosen over the earlier SOLGAS program because of its ability to
calculate equilibrium for a system of up to 20 elements as opposed to the earlier
program's constraint of 10 elements. Thus, a more complete picture of the
thermochemical state of the fuel could be obtained. The input was based on the fuel in
one UO
2TRISO fuel particle at constant volume. The total Gibbs free energy of a
system can be expressed by
GT
=
ni(G
°
+ RTlnaj)
(2.4)
where
GT =
total Gibbs free energy
ni = moles of species i
Gi
°= standard Gibbs free energy of species i
R = ideal gas constant
T = absolute temperature
ai = activity of species i
Assuming ideal gas phases and condensed phase solutions with unit activities,
T =
n,,,
[(G°o
/RT)pj
+lnP+ln(npi INp)]l
+
npi [(GO RT)pi +ln(npi Np)]
RT
i=l
p=2 i=1 q+s+ mp+ E
n,,,i(G
° RT )Pj
p=q+2 i=1(2.5)
where
mp = number of species in phase p
P = total pressure
Np = moles of phase p
The ideal gas law is used to account for constant volume (variable pressure) calculations:
P NIRT
(2.6)
V
The masses of all elements are conserved:
q+s+l mp
Z
Apij
npi
= b
(2.7)
p=l i=1
where
Api = coefficient on element j of species i in phase p
bj = g-atoms of element j
SOLGASMIX-PV calculates the Gibbs free energy of the system by solving
equations 2.5 -- 2.7 using Lagrange's method of undetermined multipliers and Taylor
expansions about the moles of each species, neglecting terms involving derivatives of
second and higher orders.
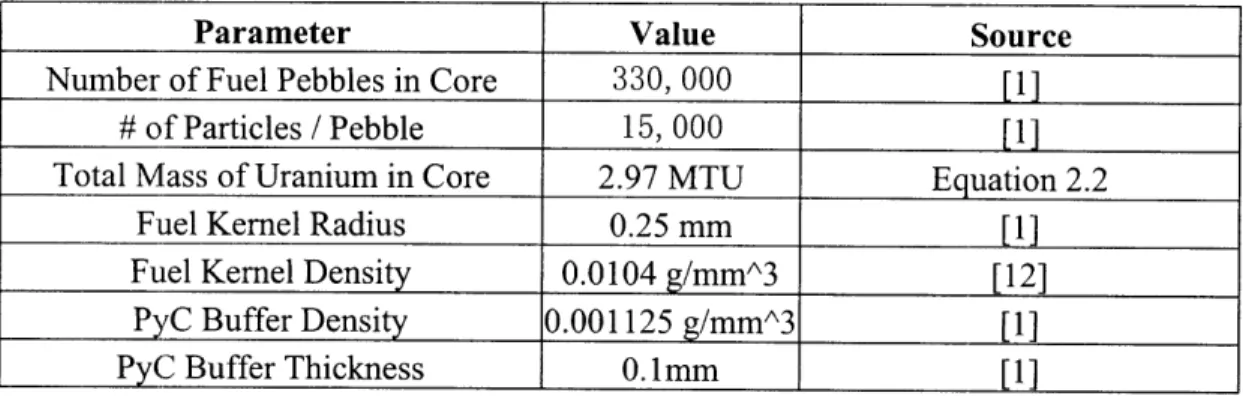
Table 2.2. PBMR Fuel Parameters used in SOLGASMIX-PV Calculation
Parameter
Value
Source
Number of Fuel Pebbles in Core
330, 000
[1]
# of Particles / Pebble
15, 000
[ 1 ]
Total Mass of Uranium in Core
2.97 MTU
Equation 2.2
Fuel Kernel Radius
0.25 mm
[1]
Fuel Kernel Density
0.0104
g/mmA3[12]
PyC
Buffer Density
0.001125
g/mmA3
[1]
Py(
Buffer Thickness
0.1 mm[1]
In TRISO fuel, excess oxygen reacts with the carbon buffer to form carbon
monoxide, which influences the oxygen potential of the fuel. Thus, it is necessary to
include the buffer layer in the calculation. The constant volume for the calculation was
equal to the volume of the fuel kernel plus the volume of the buffer layer.
k+g -x
Vkg3
r x (0.25mm +0. lmm)
3=0.180mm
3(2.8)
Vsystem =
0.180min
3= 1.8E-7 L
(2.9)
The amount of graphite in the buffer layer was calculated as follows:
Vk
=- x r x r = 0.065mm
3(2.10)
Vk3
0.0104g
mol
X106MS
0.065mm x
xg
= 2.52x10
6mols
mm
3270g
(2.11)
Vg = Vk+g- Vk
=0.115mm
3(2.12)
0.115mm
3x 0.00125g
x
m
= 1.07 x
10- 6mols
(2.13)
mm
312g
The input values for the fission product elements were taken from the ORIGEN2
results in Section 2.1 and varied with burnup. Since the ORIGEN2 output gives the
masses of fission products resulting from one ton of uranium, these masses need to be
converted to the amounts found in one TRISO fuel particle. The amount of uranium in
one fuel particle was calculated as follows:
330,00pebbles 15,000particles
10MTUparticle
--
x
'=
6 x 10
/
-MTU
particle
(2.14)
2.97MTU
pebble
The mass of a certain fission product produced from one ton of uranium was converted to
the moles of the fission product per particle by multiplying by the mass of uranium in a
particle and dividing by the atomic weight of the element:
grams 6 0
10°MTU
mol
mols
x--
x
=
(2.15)
1MTU
particle
grams particle
The elemental fission product concentrations in moles were entered as starting materials
into the SOLGASMIX-PV input file. SOLGASMIX-PV can accommodate a system of
up to 20 elements. In addition to the uranium, oxygen, and carbon in the particle, the
fission product elements considered in the starting mix were Kr, Rb, Sr, Y, Zr, Mo, Tc,
Ru, Rh, Pd, Te, I, Xe, Cs, Ba, La, Ce, Pr, Nd, Pm, Sm, and Eu due to their significant
yields and half-lives.
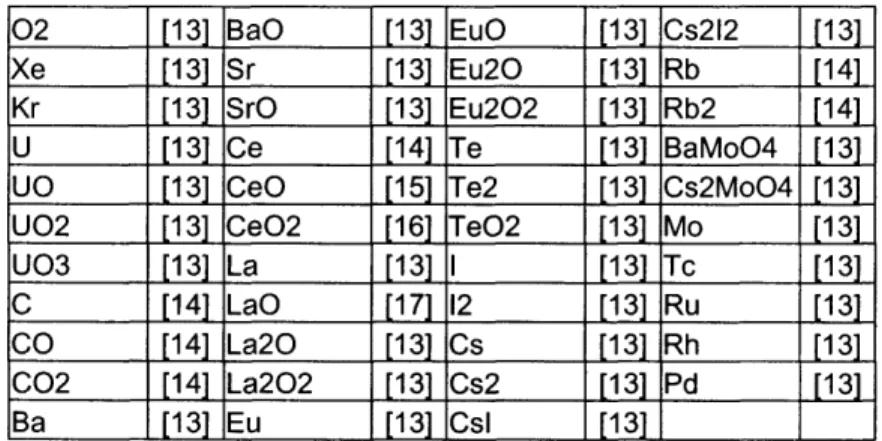
Based on the thermodynamic analysis carried out by Minato et al, there were five
mixtures or types of compounds/elements considered in the analysis. [12] These were the
gas phase, oxides in solid solution with UO
2, oxide precipitates, metallic precipitates, and
carbides. The species considered in each mixture can be seen in Tables 2.3-2.7.
Expressions for AG
Ohad to be entered for each species considered and were of the form
AG
O(J/mol) = b + cT
(2.16)
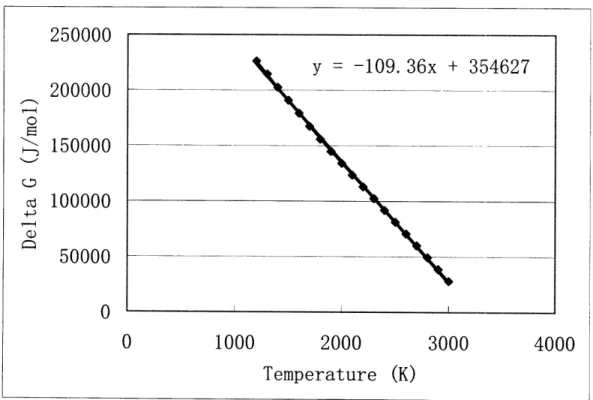
For most of the species, the coefficients for these equations were determined by plotting
the Gibbs Free Energy versus temperature for each species and then using linear
regression to find equations for each line. The sources of thermodynamic data are shown
next to each species in Tables 2.3-2.7. Figure 2.3 is an example of a plot used to
determine a linear relationship between Gibbs Free Energy and temperature. For some
compounds there was not a constant linear relationship between the free energy and
temperature over all temperatures due to a change in phase. In these cases, the equations
in the input file were modified according to the temperature of the system. At
temperatures where no thermodynamic data was available for a specific compound,
available data was extrapolated.
Table 2.3 Mixture 1 - Gas Phase
02 [13] BaO [13] EuO [13] Cs212 [13]
Xe [13] Sr [13] Eu20O [13] Rb [14]
Kr [13] SrO [13] Eu202 [13] Rb2 [14]
U [13] Ce [14] e [13] BaMoO4 [13]
UO [13] CeO [15] Te2 [13] Cs2MoO4 [13] U02 [13] CeO2 [16] TeO2 [13] Mo [13]
U03 [13] La [13] I [13] Tc [13]
C [14] LaO [17] 12 [13] Ru [13]
CO [14] La20 [131 Cs [13] Rh [13]
C02 [14] La202 [13] Cs2 [13] Pd [13] Ba
[3
EuEu
[13
[13 CslI
[13] [13]Table 2.4 Mixture 2
Oxides in Solid Solution with UO2
U02 [13] La203 [13] ZrO2 [13] EuO [13] BaO [13] B-Eu203 [13] SrO [13] C-Eu203 [13] CeO2 [14] MoO2 [13] Ce203 [14]Table 2.5 Mixture 3
- Oxide Precipitates
Cs2ZrO3 [13] SrMoO4 [14] SrZrO3 [13] BaMoO4 [13] BaZrO3 [13] Cs2UO4 [13]Table 2.6 Mixture 4 - Metallic Precipitates
Zr [14] Rh [13]
Mo [13] Pd [13]
Tc [13] Csl [13]
Ru [13]
Table 2.7 Mixture 5 - Carbides
C8Cs [19] C36Cs [19]ClOCs [19] C(graphite) [14] C24Cs [19]
Under low temperature and high cesium pressures, cesium reacts with graphite,
penetrating between the graphitic layers without disrupting the strong carbon-carbon
bonds within the layers. This increases the spacing between the graphite layers from
3.35A to 5.94A. The cesium-graphite reaction creates several distinct compounds. The
known phases are C
8Cs, C
1oCs, C
12-C
12Cs, C
24-C
12Cs, which were included in the
calculation.[ 19]
Figure 2.3 Gibbs Free Energy as a Function of Temperature for Pd(g)
I A f% fn ZoUUUU200000
0
E
'a
150000
cd 1000000
50000
n
v
0
1000
2000
3000
4000
Temperature
(K)
It is important to note that the SOLGASMIX-PV source code had to be modified
to allow for the coefficients for the 20 elements to be placed on the same card in the input
file. This was accomplished by modifying line 50 of the SOLGASMIX-PV source file.
The original line read:
280 FORMAT (16F5.0/16F5.0)
This only allowed for 16 real numbers, allotted 5 spaces each to be read from each card
for the coefficients. However, since there were 20 elements in the system, 20 numbers
needed to be read. Thus, line 50 was changed to:
280 FORMAT (25F5.0/25F5.0)
This allowed for 25 real numbers, allotted 5 spaces each, to be read from each line
containing coefficients.
Input files were created and used for temperatures ranging from 1200K to 2000K
for burnups from 10,000MWd/MTU to 100,000MWd/MTU. Example
SOLGASMIX-PV input and output files can be found in Appendix B.
2.3 SOLGASMIX-PV Results
2.3.1 Chemical Equilibrium
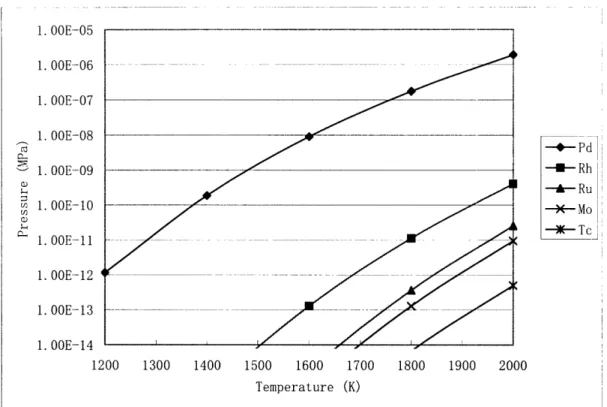
The calculated equilibrium vapor pressures of the metallic precipitates can be
seen in Figure 2.4. The vapor pressure of Pd is much higher than the pressures of the
other metallic precipitates. Pd attack of the SiC layer is a major concern and is addressed
in Chapter 3. Figure 2.4 is also useful as a benchmarking tool. Figure 2.5 shows
Minato's results from a similar SOLGASMIX-PV calculation. [12] The results appear to
agree both qualitatively and quantitatively.
1. OOE-05 1. OOE--06 1. 00E--07 1. OOE-08 1. OOE-09 a) m 1. OOE-10 !j) 1. OOE--11 1. OOE-12 1. OOE-13 1. 00E--14 1200 1300 1400 1500 1600 1700 1800 1900 2000 Temperature (K)
Figure 2.4 Equilibrium Vapor Pressures of Pd, Rh, Ru, Mo, and Tc
Calculated at 5% FIMA
.
- CE V)U,
0-1200
1400
1600
1800
2000
Temperature
(K)
Figure 2.5 Results from Minato for the Equilibrium Vapor Pressures of
--- Pd
---- Rh-- Ru
-X-- Mo -+- Tc . -5As mentioned in Section 1.3, the particle fuel chemistry is highly dependent on
the oxygen potential of the fuel. The oxygen potential determines the chemical state of
the solid fission products. In addition, excess oxygen reacts with the pyrocarbon buffer
layer to form CO(g). The CO contributes significantly to the total internal pressure. If
the IPyC layer is cracked, the CO will attack the SiC, forming SiO(g) as it corrodes the
SiC layer. [20] The chemical potential of oxygen (,o ) for fuel and fission product
equilibria can be calculated by Equation 2.17. [5]
Pu -=
RTlnPO
P,(2.17)
where
R=8.314 J mol
1- KI
T = the temperature in K
Po2 = the oxygen partial pressure in Pascals
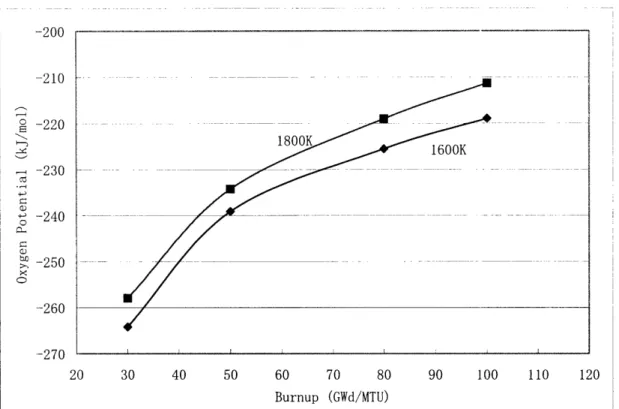
The oxygen partial pressure was calculated using the oxygen partial pressure
values from the SOLGASMIX-PV output. As can be seen in Figure 2.6, the oxygen
potential increases with temperature and burnup.
--zuu --210 E -220 - -230
z
a)*
-240
OC) to -250 -260 --97n. 20 30 40 50 60 70 80 90 100 110 120 Burnup (GWd/MTU)Figure 2.6 Oxygen Potential Calculated from SOLGASMIX-PV as a function of
Temperature and Burnup.
Figure 2.7 shows Minato's results from a similar SOLGASMIX-PV calculation. [12]
The results appear to agree qualitatively, but the oxygen potential resulting from this
calculation is much greater in magnitude. This is likely due to a difference in input
composition. The difference probably lies in the initial oxygen gas concentration input
value. In this work, the O2(g) concentration was calculated using ORIGEN2. Another
source of the different oxygen partial pressure results may be a difference in the oxide
species considered and/or in the concentrations of the fission product elements that form
the oxides.
I-,
--400
o -450
°-
-4
50
0
2
4
6
8
Burnup
(%FIMA)
Figure 2.7 Results from Minato for Oxygen Potential as a Function of
Temperature and Burnup [12]
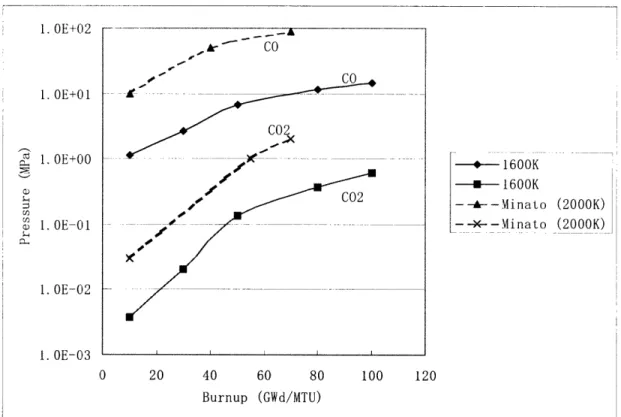
The carbon monoxide, carbon dioxide, and fission gas pressures in the fuel
particle induce a tensile stress on the SiC layer. If the pressure is too high, the vessel wall
will rupture. Therefore, it is important to be able to predict CO and CO
2evolution in the
particle. Figure 2.8 shows the calculated CO and C02 evolution at 1600K compared to
Minato's results at 2000K. [12] As expected, the gas pressures at 2000K are higher than
those at 16000K. The curves for each type of gas follow a similar shape and are
relatively close in value. Also, as can be seen in Figure 2.8, the CO pressure is higher
than the CO
2pressure at a given temperature and thus, the more important parameter to
track.
I I I s = rs __BI I
f
~--~'-- . '. , · · ---- I I I I I1. ULtUZ 1. OE+(01 1. OE+00O cI Cn 01. LOE-CI 1 L 1. OE-02 I flL
L
*- 1600K 1600K-- --- Minato (2000K)
-- x--Minato
(2000K)
0 20 40 60 80 100 120 Burnup (GWd/MTU)Figure 2.8 CO and CO
2Pressure Evolution as Calculated and
Compared to Published Results
2.3.2 Chemical State
In addition to calculating the oxygen, carbon monoxide, and carbon dioxide
fission product pressures, at a given temperature and burnup, SOLGASMIX-PV also
calculates the chemical states of the fission products. Once the oxygen potential at a
given time is determined, the chemical states of the fission product elements can be
calculated based on the input fission product inventory, temperature and thermochemical
data. The chemical state of a fission product is important because it determines its
release behavior. If the fission product forms an oxide, it is retained in the kernel. If it is
present in part as a dicarbide, it will segregate from the kernel and collect at the SiC
interface on the cold side of the particle, react with the SiC, and potentially fail the
,# CO coo~~~~~~c
... i- '"-o
C02-x
C...1_. ! Itl' I F.%coating. The affinity of the fission products for oxygen can be expressed by the
equilibrium oxygen pressure for the reaction:
2 2
-(FP)
+
0
2(g)
-(FP)O,
(2.18)
n
n
where (FP) and (FP)On denote a fission-product element and its oxide. [21] The valence
of the fission-product cation in the oxide form is 2n. If the states of the element and the
oxide are considered pure single substances then they are in their thermodynamic
standard states. The free energy of reaction is equal to the tabulated free energy of
formation. The oxygen pressure at which both the element and the oxide coexist is given
by applying the law of mass action to Equation 2.18, which yields [21]:
Po
=
exp
TGF
(2.19)
where
AGF = the free energy of formation of the fission-product oxide per mole of oxygen at
temperature T.
The stability of the fission product as an element or an oxide in the presence of
the fuel depends on the difference between the free energy of formation for the
fission-product oxide and the oxygen potential of the fuel. If the free energy of formation of the
fission product lies below the fuel oxygen potential, the oxide will be formed. If the
fission-product point is above the fuel oxygen potential, it will be present as an element.
AGF must be negative in order for an oxide to form. [21] Since
A
plot of AGOF versus temperature approximates a straight line, with changes in slope
where new phases form. Such a plot shows the relative thermodynamic stability of the
indicated oxides. This is known as an Ellingham diagram and is shown in Figure 2.9 for
relevant fission products. The lower on the diagram, the more negative the standard free
energy of formation and the more stable the oxide. [22]
TEMPERATURE. IK
Figure 2.9 Standard Free Energies of Formation of High-Yield Fission Products [23]
(Solid Line From Figure 2.10)
Thus, it can be seen that if the free energy of formation is positive or only slightly
energy of formation is strongly negative, then even a small oxygen partial pressure will
cause the oxide to form. Figure 2.10 indicates the predicted oxygen potentials as a
function of temperature and burnup as calculated by SOLGASMIX-PV.
-160 -180 o E -200 C
-220
.,-. a)t
-240
0) -260o
-280 -qA 30 GWd/MTU -U-50 GWd/MTU A -80 GWd/MTU -x-100 GWd/MTU 1000 1500 2000 2500 3000 Temperature (K)Figure 2.10 Calculated Oxygen Potential as a Function of Temperature and Burnup
The line for 50GWd/MTU from Figure 2.10 has been superimposed on Figure 2.9. Thus,
it can be seen that at a temperature of 1600K and burnup of 50GWd/MTU, most of the
fission products will exist as stable oxides. Pd, Rh, Ru, Te, and Tc are predicted to exist
as metallic elements.
--Figure 2.11 indicates the most probable chemical states of the abundant fission
products in oxide fuels and corresponds with the results illustrated in Figure 2.9.
[. I 11., I111n!1 Vl \/11 .1111
N
IM Ilia l',...\"
lI, \ I\ \,'1 II~ II I I<a
ICa
S
Cli
V
I(
r
l
n
Fe
Ru
Os
I I-Ra Ac
Rh1 ItrNi
PCIPt
C( LAu
7.i1Cd
13A\l
In
TI
C
Si
(ie
SnlPb
N
P
As
Sb
Bi
0
S
.se
I1o
F
Cl
I'tr
Al
Nc
Ar
Kr
Xe
R'1
1, 1 11i'I
t-j INpi[
hl
\.
i'"lrFkI(C
I17.I:nrJIomNITdN.
I
Figure 2.11 Probable Chemical States of Fission Products.
Orange denotes volatile fission products, gray denotes metallic precipitates, blue denotes
oxide precipitates, and green indicates products in solid solution. [24]
In
U()2fuels, there is a formation of metallic precipitates consisting of
molybdenum, technetium, ruthenium, rhodium, and palladium. This corresponds with
the results illustrated in Figure 2.4. Barium and strontium exist mainly as oxides
dissolved in oxide fuel, but barium also migrates into the pyrocarbon. [25] BaO and SrO
vapor pressures can be seen in Figure 2.12, which indicates that the vapor pressure of
BaO is much more significant than SrO.
i
Ag
io*
Ic.,\,
(aIlI A.....
xJ . . .. _ _ uS __ s} . L-7--H
o I .---
.-1. OOE-14 1'- ,5-P 1, 7 1. UUL-I 1. OOE-20 1. OOE-23 1. OOE-26 1. OOE-29 C.) C.) 1. OOE-32 1. OCIE-35 1. OOE-38 1. O0E-41 1. O0'E-44 1. O(E-47 1.OOE-50 1. OOE-53 1 MU-rIR, s K e
/~~~~~~~~~
m
+ BaO +BaSr
n R Monn .1 . u1 11 1; to 11 -1400 1500 1600 1700 1800 Temperature (K)Figure 2.12 Calculated Equilibrium Vapor Pressures for Ba and Sr Species at
50,000MWd/MTU
Figure 2.13 shows the calculated vapor pressures of the species containing the
rare-earth elements Ce, La, and Eu. The CeO
2and CeO values are very rough estimates
due to a lack of thermochemical data. Cerium oxide has been observed in the TRISO
fuel coating layers. [12] This corresponds to a high vapor pressure. Furthermore, Figure
2.12 displays the increasing rare-earth oxide equilibrium pressures with increasing
temperature
0 __ -_ __ _ . - --- -,____ I _. ... I )K SrO1450 1500 1550 1600 1650 Temperature + CeO2 -d- Eu -A-CeO -- LaO -- Eu202 --dk r -I -- La - La202
--- EuO
1700 1750 1800Figure 2.13 Calculated Equilibrium Vapor Pressures of Rare-Earth Oxides
at 50,000 MWd/MTU
Figure 2.14 illustrates the calculated equilibrium vapor pressures of species
containing cesium. As indicated, the vapor pressures of CsI, Cs are relatively significant
compared to the vapor pressures of the Ba, Sr, and rare-earth containing species
illustrated in Figures 2.12 and 2.13. Cesium has been observed in the buffer PyC and
[PyC layers. [12]
L. OE+(1 .OE-02 1. OE-05I. OE-08
1. OE-I1 1. OE-14 1. OE-17 0 'a)C = 1. OE-20 1. OE-23 1. OE-26 1. OE-29 1. OE-32 1. OE-35 1 n(--QQ 1. UL, O0 1400 -O I I I L I J .... i ... --# F -s r-- -- -- -- __
-__
-
- - - - - -
-
---
-_i___
1. OOE---09 1. OOE-12 1. OOE---15 1. OOE--18 1. OOE-21 1. OOE--24 1. OOE-27 1. OOE---30
1. OOE--33
._
_ _ 1. OOE--361. OOE--39_
_
_
1. OOE--42 _ 1. OOE--45 1400 1450 1500 1550 1600 1650 Temperature (K)Figure 2.14 Calculated Equilibrium Vapor Pressures of Cs Species at
50,000 MWd/MTU
1700 1750 1800 I ---I i IChapter 3. Fission Product Attack of SiC
3.1 Mechanism of Rare-Earth Fission Product Attack
Rare-earth element-SiC (RE-SiC) interactions occur in carbide fuels. [26]
Carbide fuels readily release rare-earths, enhancing SiC corrosion. An advantage of
UCxOy fuel is that SiC-RE reactions are eliminated if oxygen levels are high enough to
retain the rare earth fission products within the kernels as stable sesquioxides. [26] The
amount of fission-product accumulation increases with the percentage of UC
2present in
the fuel. If the initial UC
2percentage is greater than 70%, the rare-earth elements are
present in part or in total as dicarbides. Then, the rare-earth elements have the highest
possible pressures of rare-earth neutral gases
(PRE)
via the equilibrium reaction in
Equation 3.1. [26]
(RE)C
2-> (RE)g +2C
(3.1)
The decrease in amount of rare-earth elements at the SiC interface with decreasing initial
UC
2amount may result from the stability of the (RE)0
1.
5and the equilibrium
(RE)OI.
5-> (RE)g + 0.7502
(3.2)
As the UO
2content is increased, the oxygen partial pressure, Po, is increased with a
decrease in PRE.
The rare-earth interaction with SiC is corrosion in the usual sense; it results in
actual thinning of the SiC layer and is linear with time. [25] At temperatures exceeding
1300°C, rare-earth fission products concentrate at the inner PyC-SiC interface on the cool
side of the UC
2fuel particle. This can be seen in Figure 3.1. [26]
INNER SURFACE, SC LAYER
LOCAL CONCENTRATION OF FISSION PRODUCTS
/ X KERNEL COOL HOT
/ I1
Figure 3.1 Fission Product Distributions in a TRISO UC
2particle (A) as loaded for
thermal-gradient heating, (B) after a 1-h isothermal anneal at 1800°C, and (C) after
87h at 1690°C under a thermal gradient of 980°C. [26]
Above 1600°C, the fission products and SiC layer may react, decreasing the
thickness of the SiC layer locally and causing increased SiC coating stresses. The
roughness of the SiC/IPyC interface after fission product reactions and the decrease in
thickness of the SiC layer make the brittle SiC layer susceptible to pressure vessel failure.
Two zones of attack are observed in the SiC layer on the cool side of TRISO UC
2. The
first occurs along a broad front. The second zone is in the form of stringers that advance
ahead of the broad front. These more reactive paths appear to be SiC grain boundaries.
[26] The rate of chemical degradation for the SiC layer increases with temperature and
kernel burnup. [27] The rate of change of SiC thickness due to Rare-Earth fission
product corrosion has been established to be an Arrhenius relationship and is further
3.2 Mechanism of Palladium Attack
The interaction of palladium with the SiC layer is one of the key factors
influencing fuel performance and has been observed in both oxide and carbide fuel
particles. ThIe palladium quickly diffuses through the buffer and IPyC layers and then
forms small nodules at the interface to the SiC layer. [25] It then reacts with the SiC and
is thought to move along the SiC grain boundaries. [25] The reaction occurs as follows
[6]:
2Pd + SiC -* Pd
2Si + C
(3.4)
Although Pd has been detected on both the hot and cold sides of the fuel particle, it
locally attacks the SiC on the cool side as can be seen in Figure 3.2. [26]
Figure 3.2 Secondary electron images and Pd-La X-ray displays of the cold and hot
sides of a UO
2TRISO fuel particle [26]
A schematic representation of palladium travel to the SiC layer can be seen in
Figure 3.3 and is represented by a series of steps: (1) birth of palladium in the fuel kernel,
(2) release of palladium from the fuel kernel due to diffusion (3) transport of palladium to
the SiC layer by diffusion through the PyC layers, and (4) reaction of palladium with the
SiC layer. [6]
Figure 3.3 Pd Travel to SiC Layer [6]
Corrosion of the SiC coating has been observed at all levels of palladium from
1.9E15 to 2.0E16 atoms/particle. [28] According to work published by Tiegs, no
threshold amount of palladium per particle is necessary before penetration occurs as long
as some palladium is present and the penetration distances in particles with low
concentrations are comparable to particles with high palladium concentrations. He
concludes that the amount of palladium per particle only affects the number of corrosion
sites and not the penetration distance. [28] However, Minato established a relation
between the theoretical amount of Pd released from the kernel and the experimentally
I i i I i I i i I I
![Figure 1.1 Pebble Bed Reactor Fuel [3]](https://thumb-eu.123doks.com/thumbv2/123doknet/14732454.573321/6.918.207.709.132.457/figure-pebble-bed-reactor-fuel.webp)
![Figure 2.7 Results from Minato for Oxygen Potential as a Function of Temperature and Burnup [12]](https://thumb-eu.123doks.com/thumbv2/123doknet/14732454.573321/26.918.256.663.126.556/figure-results-minato-oxygen-potential-function-temperature-burnup.webp)