Development of Inexpensive Hands-On Mechanics Laboratory Exercises for the
Web and Around the World
by
Rachel C Reed
Submitted to the Department of Mechanical Engineering
in Partial Fulfillment of the Requirements for the Degree of
Bachelor of Science in Mechanical Engineering
at
theMASSACFUS1ETTS
Off ITUTEat the OF TECHNOLOGY
Massachusetts Institute of Technology
JUL
0 8
2016
June 2016
LIBRARIES
ARCHNES
2016 Rachel C Reed. All rights reserved.
The author hereby grants to MIT permission to reproduce and to
distribute publicly paper and electronic copies of this thesis document
in whole or in part in any medium now known or hereafter created.
Signature of Author:
Signature redacted
Department of Mechanical Engineering
May 6, 2016Certified
Signature redacted
Dr. Barbara Hughey
Instructor of Mechanical Engineering
Thesis Supervisor
Signature redacted
Certified by:
Anette (Peko) Hosoi
Professor of Mechanical Engineering
Undergraduate Officer
Development of Inexpensive Hands-On Mechanics Laboratory Exercises for the
Web and Around the World
by
Rachel C Reed
Submitted to the Department of Mechanical Engineering on May 6, 2016 in Partial Fulfillment of the
Requirements for the Degree of
Bachelor of Science in Mechanical Engineering
ABSTRACT
Online education has rapidly expanded in recent years, but offering a true laboratory component to online curricula has been limited by the ability to replicate lab experiments at a low cost. Some online courses offer videos or simulations of lab experiments that can be completed on learner's laptops with little to no physical experimentation. The development and implementation of three hands-on suites of laboratory activities designed for independent learners or for AP physics high school MOOCs on the topics of pendulums, inclined planes, and rubber bands is described, with a focus on the design process of creating low cost labs suitable for a variety of student learners, including single learners, multiple learners, and students with instructor supervision. The goal of these labs is to develop observational, measurement, analysis, and modeling skills that connect to students' experiences in the real world. The aim is to advance experimental insight and develop intuition that connects learners to how physical objects will act in their everyday lives. The experiments have been designed to teach multiple concepts via coordinated sets of hands-on activities, including reducing uncertainty, graphing techniques for clear representation of the functional form of the data, experimental design to minimize systematic errors and comparing different ways of measuring the same physical properties.
Acknowledgments
I would like to express my deepest thanks to those who made this work possible. First of all, many
thanks to Dr. Barbara Hughey for all of her help during my undergraduate time here at MIT. Beyond being my advisor and thesis supervisor, you have been a great mentor, guiding me through MIT and giving me advice for so many things. You have been there with me from the start, always there to lend a helping hand and really helping me strive. Thank you for going above and beyond as an advisor! It has been a pleasure having you as an advisor and thank you so much for all of your help and support; I wouldn't have become the person I am today without your tutelage.
Most importantly, I would like to express the greatest gratitude to Professor Ted Ducas of Wellesley College, who provided the vision and constant guidance for my thesis. Thank you for sharing your work with me and allowing me to become a part of the vision of this project. Your education and physics expertise is tremendous, and it has been a privilege and honor to have been able to work with and learn from you. You consistently allowed this paper to be my own work, but never ceased to steer me in the right direction. Without your guidance, mentoring, and endless patience with my questions, this thesis would not have been possible. I look forward to the day these labs are officially implemented!
I would like to thank Dr. Paul Belony from the MIT Haiti initiative for generously distributing our
Pendulum Laboratory exercises to university professors in Haiti to use in their undergraduate classrooms. We are so excited to start testing these labs with their intended audiences.
Lastly, I would like to thank Professor Analia Barrantes and all of the students in ES.801 for graciously testing our initial Pendulum Laboratory exercises. The feedback received was been invaluable to the design process for these exercises and we are extremely grateful for the opportunity to have tested our project with them.
Table of Contents
Abstract 2 Acknowledgments 3 Table of Contents 4 List of Figures 6 List of Tables 7 1. Introduction 8 1.1 Importance of MOOC's 8 1.2 Limitations of MOOC's 9 1.3 Hands on Learning 101.4 Teaching Critical Thinking 11
2. Pedagogical Goals 12 3. Design of Labs 14 3.1 Pendulum 15 3.1.1 Set-Up 16 3.1.2 Analysis 17 3.1.3 Other Branches 21
4. Implementation of Pendulum Lab 34
4.1 Student Lab Reports 35
4.2 Survey Results 39
5. Conclusions 40
6. Appendix 42
List of Figures
Figure 1: Fulcrum point for pendulum 16
Figure 2a: Expected learner's set-up for pendulum experiment 17
Figure 2b: Traditional laboratory set-up for pendulum experiment 17 Figure 3: Period vs length for a simple pendulum on two different quality se-ups 18 Figure 4: Period vs length for a simple pendulum with included data point of (0, 0) 19 Figure 5: Period2 vs length for a simple pendulum on two different quality set-ups 20
Figure 6: Hand drawn graph period2 vs length for a simple pendulum 21 Figure 7: Log-log plot of period vs length of a simple pendulum 22 Figure 8: One handed set-up configuration for the inclined plane 25
Figure 9: Example of unmeasurable handicap ramp 28
Figure 10: First iteration of home-made inclinometer 29
Figure 11: Home-made inclinometer 30
Figure 12: Different cases for rubber band lab students will test 32
Figure 13: Rubber band set-up using pens to evenly distribute force 33
Figure 14: Change in length vs applied force for single rubber band 34 Figure 15: Change in length vs applied force for rubber bands in series 35 Figure 16: Change in length vs applied force for rubber bands using water 37
List of Tables
Table 1: Laboratory materials needed for lab exercises 15
Table 2: Critical angle for slipping block on various mediums 26 Table 3: Handicap ramp slopes measured using a homemade inclinometer 30 Table 4: Measured and expected K effective for rubber bands in series 36
1. Introduction
The development of three hands-on suites of laboratory activities for AP mechanics high school
MOOCs using pendulums, inclined planes, and rubber bands as the main experimental vehicles is
described with a focus on the design process and implementation of low cost labs that students can run as part of AP physics courses. These activities and modules were developed to be able to be performed by students all over the world, regardless of students' financial resources or ability to access high-tech or expensive equipment. Keeping this in mind, the labs are designed to be completed using nothing more complex than a stopwatch and a ruler as the measurement tools.
Early on, it became evident that these labs had the potential to be useful for a wide range of learners and could be decoupled from AP courses. They could represent an inexpensive and accessible resource for laboratory experiences in a wide variety of learning environments. Three basic learner
situations were considered when developing the lab modules:
1. Single learner with no instructor supervision
2. Multiple learners with no instructor supervision
3. Learners with instructor supervision
The most challenging situation to accommodate is a single learner with no instructor supervision. For this case, lab exercises must require no more than two hands at any given time. This proved difficult when designing labs for the pendulum and inclined plane suites.
Section 1 covers background information on the need for hands-on laboratory experiment exercises. Section 2 presents the pedagogical goals of this work, followed by the details and challenges faced when designing the labs in Section 3. Student feedback and initial observations
of MOOCs is their ability to allow thousands of students all over the world to access courses and
opportunities that were previously unavailable to them. MOOCs are not typically for students who are seeking full-time educational credentials, but rather for students who want to supplement traditional courses.
1.2 Limitations of MOOCs
Despite successfully opening access to courseware, MOOCs still have many limitations. Not only is it difficult to teach complex science topics to students online, it is a significant challenge to include experimental laboratory experiences in these online courses. Unlike their counterpart classes in universities and high schools, very few MOOCs include hands-on laboratory components. Online Advance Placement (AP) physics classes do not currently support a laboratory component, even though the governing body, College Board, requires that all AP science classes devote 25% of course time to "hands-on laboratory work with an emphasis on inquiry-based investigations" [2].
The few courses that do include labs do nothing more than provide videos of others performing experiments, and may include short interactive animations that students are required to watch. These lab videos do not include any of the steps involved with setting up or calibrating the lab equipment [3]. While informative, watching videos or performing labs on the computer do little to introduce hands-on learning and teach critical thinking.
The closest a MOOC has come to providing real hands-on activities is Introductory Physics I with
Laboratory by the Georgia Institute of Technology. The class is held in high enough regard to give
participants who satisfactorily complete the course six (6) Continuing Education Units from the American Association of Physics Teachers. All students are asked to complete five labs as part of the course, each of which requires the students to do the following [4]:
" Record a moving object (using any device that records video) " Analyze the video using the free video analysis package, Tracker
" Create models of motion using computer programs written in Python/VPython " Compare the observations to the models
" Create a five-minute video lab report
" Upload the video to YouTube
" Evaluate video labs submitted by peers
While this course has made strides in providing digital laboratory exercises, it has many shortcomings that need to be addressed. Currently MOOCs require an internet connection and web browser, which means that all students must have access to a computer upon which they can install and use software. Many schools do not allow students to download software on school-owned
computers, preventing students who are using library or school-owned computers from participating in labs. Students are also required to have access to digital cameras or smart phones with good cameras -- expensive tools. A number of students living in countries with poor or restricted access to the web reported difficulties engaging in the course, partially due to limited access to YouTube because it has been banned by their governments [4]. Finally, this particular class exhibits a dramatic drop off in the number of students that complete the course. In 2013 it was reported that out of the 18,829 students registered for the class, in the first week an average of only 26% of students watched all twelve required videos. By the fifth week, only 4% of students were watching lecture videos. Even fewer students submitted laboratories than watched lecture videos. Only 2% of students completed lab 1, while just 1% of students completed lab 2 [4]. This is significantly below the average completion rate of 15% for MOOCs [5].
Well-designed, hands-on laboratory experiences are extremely important in developing problem-solving and critical-thinking skills. While computer-simulated labs and video-based activities can increase student exposure to a variety of topics in physics, they cannot be considered as a substitute
projects engage tactical and kinesthetic learners as one would expect, they also engage visual learners who have the opportunity to see what they are building. Non-auditory learners often struggle with traditional lecture based classrooms, while hands-on projects engage learners of many different types [8].
The most effective hands-on activities are those that enable students to make connections between what they can see and touch, and scientific ideas that come from observations. Making these connections effectively through traditional lecture-based classrooms is difficult, but hands-on activities often make these links more explicit. For example, a study conducted by researchers at Purdue University found that 8th graders who were taught about the human impact on water quality through a hands-on project, instead of the traditional textbook and lecture method, showed significantly greater understanding of the concepts. In every area the researchers tested, the students who participated in the hands-on project learned more and demonstrated a more thorough understanding of the material than did the control group [9].
Scientific concepts can be abstract and complex. Manipulating and examining physical objects can make these abstract concepts more concrete. Through such hands-on experiences, students are able to see physical examples of ideas and observe outcomes produced by changing variables in experiments. Experimental learning is critical to developmental growth in all years and areas of study. Continued engagement in hands-on experiences inspires students and teaches important skills often sought by potential employers.
1.4 Teaching Critical Thinking
One of the central goals of education is arguably to make students begin to think critically about models and data [10]. The ability for students to make decisions based on data and facts is an important skill in today's society. Critical thinking is an analytical and reflective style of thinking, with roots in logic that require learners to ask questions such as:
" What caused this to happen?
" What evidence is there to support your claim?
" Is this a plausible cause?
* Are our results biased or can we back Lip our claims? * What else could cause this result?
Critical thinking is what enables scientists to make discoveries and generate new solutions. It forces students to go beyond describing a situation and think about how it happened. Critical thinking is a skill that must be learned but unlike other subjects cannot be explained to students; for learners to truly be able to understand and apply critical thinking skills, they must practice them first-hand. Experts recommend that scientific reasoning be taught in the context of other subject matter because neither teaching content nor engaging in investigative experience alone will lead to a proficiency in science [10]. By making the critical thinking process explicit to students and having them apply the process through targeted activities with feedback, educators can help
students adopt new, more analytical ways of thinking.
It is possible for students to study a subject in depth and yet finish their studies with misconceptions
about basic concepts. Critical thinking helps students understand potential gaps between theory
and practice, dispelling common misconceptions. Students in lab classes may assume that data they acquire are low quality because experiments are not performed in a "true lab"; alternatively., they might not question the quality because the apparatus is set up by an instructor. These assumptions can lead students to make incorrect conclusions about the quality and value of their data. Scientists avoid such pitfalls by engaging in critical thinking by repeatedly comparing data to models and deciding on valid conclusions based on analytical testing.
In this vein, a primary goal of these lab activities is to help students develop observational, analytical, and modeling skills in a way that connects their experiences to the real world. We aim to promote experimental insight in students and develop intuition that connects them to the physical objects and phenomena they will encounter in their everyday lives. An important aspect of these labs is that they have clear and explicit goals beyond simply demonstrating the validity of theoretical physical models. To accomplish this, experiments were designed to teach multiple concepts via coordinated sets of hands-on activities, such as reducing uncertainty in measurements, graphing techniques for clear representation and analysis of data, and comparing different ways of measuring the same physical properties.
The original plan was to design two sets of experiments; a "low tech" version using nothing more complex than a stopwatch and a ruler as measuring devices, and a "high tech" version using smartphones and free apps. Over time, it became evident that the greater and more valuable challenge would be to design learning activities using extremely limited resources while still emphasizing experimental insight and students' cleverness. There are many additional possibilities within the "high tech" area and they will be included as options for future iterations of this project. We aim to make the benefits associated with hands-on laboratory experiences available to the masses through a suite of low-cost experiments. Critics often condemn the monetary costs associated with hands-on science, saying the results do not always justify the expensive purchases needed to perform the experiments. Each experiment described here costs between 0 to 75 cents per student, depending on the number of household items they have already on hand. By making the entire set of experimental supplies cost under $10 including the basic measuring devices needed (i.e. a stopwatch and a ruler) the cost barrier to entry is dramatically lowered, opening up opportunities for learners in disadvantaged economic situations to perform science experiments all over the globe.
The experiments will work well as independent lab exercises that teachers can implement in their high school AP classrooms, as laboratory components for MOOCs and as supplements to university physics courses as part of blended learning and more active versions of a flipped classroom. This means that they need to be simple to set up and implementable in spaces as small as a dorm room or in the home. Additionally, the ability of the experiments can be detached from MOOC's and work as standalone experiments is extremely beneficial for educators in poorer
communities in this country, as well as in poorer areas throughout the world, where learners often cannot afford or do not have access to traditional science classroom supplies.
3. Design of Labs
Three suites of hands-on laboratory activities were developed. Each suite is built around a specific physical system and has a core set of activities and goals.
1. Pendulums
2. Inclined Planes
3. Rubber Bands
Each suite consists of four primary components. The first is to directly measure a physical property, which allows students to apply measurement skills and learn how to set up labs to minimize errors. Second, the students record data, perform calculations, and extract physical meaning from their data. The third component of the labs is to make observations and predictions throughout the experiment. Finally, students make connections to real world artifacts and phenomena related to their laboratory measurements.
The cost of supplies for performing all three suites of labs is less than $10. This includes all materials needed to run the labs and the measuring tools, a ruler and stopwatch. This is significantly less than the cheapest physics lab sensor on the market, a lab module produced by the University of Illinois that costs $100 [11]. The list of materials needed to run all three suites of lab exercises is given in Table 1.
Table 1: Laboratory materials needed for lab exercises
General Lab 1:
Lab 2: Inclined Plane Lab 3: Rubber Bands
Materials Pendulum Lab
Large flat movable Weights or other small objects like
Plumbob or surface like a textbook or large screws or pieces of candy
Tape other weight piece of wood 12 Rubber bands of the same kind
Ruler
Pencil Small block of wood 4 Pencils
Stopwatch String
Materials from Lab I Plastic Cup
Cardboard box Paper clips or string from Lab 1
The following subsections outline the three suites of lab exercises designed.
3.1 Pendulum
The first suite of labs uses a simple pendulum and connects it to everyday phenomena from wrecking balls on cranes, musical instruments and harmonic oscillators in general. One set of objectives is to determine if and how mass, length and acceleration of gravity affect the period of a simple pendulum. During this section, students also develop better experimental procedures, graphing skills, learn how to extract information from graphs and begin connecting simple pendulums to other more complex systems like physical pendulums.
One goal in designing this initial lab was to make sure that simple systems could be developed that would permit the learners to collect accurate enough data that could be analyzed to extract good values of the period of a simple pendulum. In order to run the experiment, the learner needs to have enough room to be able to set up a system that can swing with as much as 1 meter length of string and a place from which to hang the pendulum. After setting up the experiment, the learner measures the time it takes the pendulum to swing through 10 cycles for different lengths and analyzes that data to extract the relationship between period and pendulum length.
3.1.1 Set-up
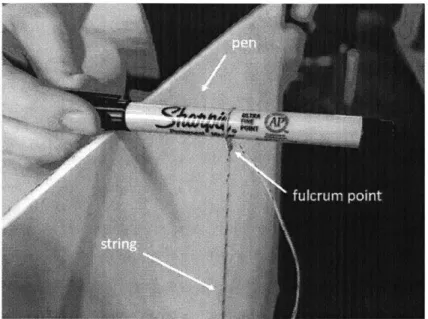
One of the largest challenges associated with setting up this experiment in a non-laboratory setting was finding a suitable location from which to hang the pendulum. Finding enough space from which to hang a I meter object maybe difficult in a confined space such as a dorm room. A pen was used to provide a proper fulcrum point for the pendulum, as shown in Figure 1. This is minimizes any effects from the string wrapping around the fulcrum.
Figure 1: Fulcrum attachment point for pendulum
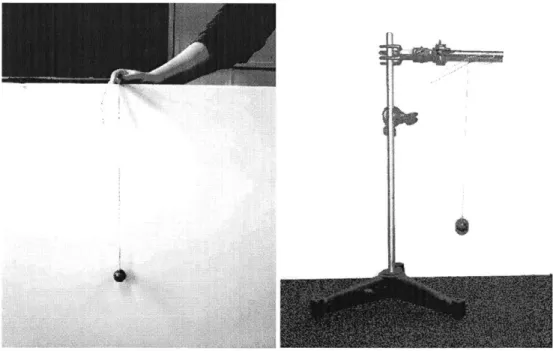
In order to measure the data variability for experiments run on a student made set-up vs. a laboratory set-up, two stands were built, one representing what students might build in their home
Figure 2: (a) Learner's set-up for pendulum experiment. (b) Laboratory set-up for
pendulum experiment.
I
3.1.2 Analysis
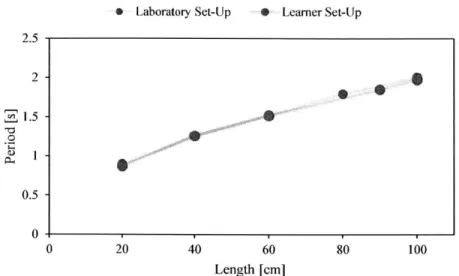
Data taken on both a typical learner's set-up and a traditional laboratory set-up are presented in
Figure 3. The accuracy of the data collected was not dependent on the set-Up. The learner's set-up
and laboratory set-up yielded an average measured value for the acceleration due to gravity of 9.93 + 0.30-) and 9.92 0. 17 , respectively. This shows that low-cost labs can produce comparable
S2 S2
results to those of higher quality systems, so that students will be capable of producing data that are good enough to extract meaningful values and trends.
* Laboratory Set-Up 0 Learner Set-Lip
0.5
0
0 20 40 60 80 100
Length [cm]
Figure 3: Period vs length for a simple pendulum on two different quality set-ups.
The typical learner's set-up and laboratory set-up yielded a value of the acceleration due to gravity of 10.20 g and 9.74 respectively.
From the limited number of data points it is difficult to see that the graph for period vs. length is not in fact linear. Because of this, the origin (0, 0) was included on the graph in order to make the non-linear functional dependence more clear. While including (0,0) along with the actually measured data is not technically correct since the system is non-ideal, it is valuable for emphasizing the visible non-linear trend of this data. When including this in future lab discussions, students will be informed of the appropriate caution they should use when including (0, 0) on their graphs. To remind them that (0, 0) is a unique data point, students will circle it on their graph. The effect of adding a data point at (0, 0) is shown in Figure 4, where it is now apparent that the trend is non-linear.
2.5 S1.5 0.5 0 0 20 40 60 80 100 Length [cm}
Figure 4: Period vs length for a simple pendulum with included data point of (0, 0).
If instead the learners are directed to the graph of period2 vs length, as shown in Figure 5, it
becomes readily apparent that a linear fit could be applied. This supports the equation students will derive for a simple pendulum where T is the period, L is the length of the pendulum, and g is the acceleration due to gravity,
L
T = 2r - (1)
* Laboratory Set-Up 0 Learner Set-Up 4.5 4 3.5 3 15 0.5 -0 0 20 40 60 80 100 Length [cm]
Figure 5: Period2 vs length for a simple pendulum on two different quality set-ups. Both values for gravity extracted from the slopes are within 2% of 9.81 In
S?
The results obtained when determining the slope from a hand drawn graph are comparable to those from the computer graphing program shown in Figure 5.
This technique of choosing the axes so as to linearize the graph is an important feature of this and subsequent labs. Not all students will have access to graphing and fitting programs such as Excel, but students do quite well in determining a good fit for a straight line by eye. Plotting a linear fit and extracting "g" from the slope of the graph of provides a value of 9.75 - for the graphing
S2
program. This is comparable to the "g" of 9.75 - extracted from the slope of a hand drawn linear fit and graph as seen in Figure 6. Both extracted values are within 1% of the true value of 9.81 11.
aJ rk-K
3jE
7Mt
-20 30 / M~ ~0 ~0Figure 6: Hand drawn graph period2 vs
value for the acceleration due to gravity slope of this curve.
30S~~
length for a simple pendulum with a of 9.75 m extracted from the measured
As an optional extension for students with the appropriate math background, this lab can be used to demonstrate the power of log-log plots in determining the relationship between two variables when the exact equation is unknown. Using a log-log plot, one can extract the power of the relationship between period and length for a simple pendulum from the slope of the graph. Shown
in Figure 7, one can see that the slope of the typical learner's set-up and laboratory set-tip were
both 0.49, a value very close to the 0.5 power given in Eq. (1).
Laboratory Set-Lip 0 Learner Set-Up 0.35 0.3 -0.25 -0.152 0 -0.1 Log(Length)
Figure 7: Log-log plot of period vs length of a simple pendulum with slopes of 0.49.
The simple pendulum described above is an ideal system and many pendulums found in the real world, referred to as "physical pendulums", differ significantly from the simple pendulum in their mass distribution. To examine the differences between an ideal pendulum and a physical pendulum learners measured the period of a physical pendulum and compared it to the oscillation period of a simple pendulum of the same length. In order to use a simple object that all users would have access to, a ruler (or meter stick) was selected as the physical pendulum. Users will already be required to have a ruler or meter stick in order to complete the earlier portions of the lab. The period for physical pendulum is:
1
[
I 2T =21T IP i (2)
Statistical analysis of numerous tests of set-ups of differing design found no significant difference in the measured value of the acceleration due to gravity. This means that students will be able to build a pendulum lab set-up at home using typical house hold items that will allow them to make good measurements.
3.1.3 Other Branches
There are various other branches of study using more sophisticated technology that students could pursue at home if they have the available resources. Using smartphones to collect data is one such branch. Currently, there are over 2.1 billion cell phone users globally [12]. This number is expected to grow to 6.1 billion by the year 2020, with 78% of them using Google's open source Android platform [13]. Android based phones are the most common in developing nations due to their lower price. It can be expected then, that the most commonly used smartphone platform by learners would be Android.
One experiment that was explored utilizing smartphone technology was measuring the period of a person using a playground swing modeled as a simple pendulum. Upon investigating this branch, it was discovered that there are not currently any low-cost android phone applications that will allow users to take a video on their phones and analyze data in the app. While users could take video with their cellphones or cameras and then analyze it using free third party software, these applications often have very steep learning curves and it cannot be expected that all learners will have access to computers to which they can download external software. The greater number of steps needed for such measurements can present a barrier to the learners' completing the assignment. This could have been one of the factors in the dramatic drop-off of the completion of
Introductory Physics I with Laboratory by the Georgia Institute of Technology [4].
Another option to collect data for determining the period of a person swinging would be to use a smartphone app that tracks your acceleration since virtually all modern smartphones contain accelerometers. Currently, there are numerous free apps for smartphones that allow users to save and export data on acceleration. This could be used in conjunction with free online software such as Google sheets to analyze the data and in turn extract the period.
3.2 Inclined Plane
The second suite of labs is based on inclined planes. The first experiment builds on the cleverness of Galileo's experiment in using an inclined plane to reduce the effective acceleration due to gravity and make it easier to measure with a stopwatch the resulting accelerated motion of objects rolling down a plane. Other experiments included (i) determining how the angle of incline affects the acceleration of objects and (ii) determining the angle at which a block tips rather than slides. Students will also develop better experimental procedures when measuring systems in non-laboratory conditions, such as determining why data may vary or ways to adjust experimental conditions for more accurate measurements.
After setting up the simple laboratory apparatus, the learner would measure the angle at which an object they placed on their inclined plane slipped. They would then place a block on the plane in an orientation that would cause it to tip before slipping. Slowly raising the slope of the ramp, they would measure the angle at which a block tips. This is a way to determine the coefficient of static friction without having to know the mass of the object. Lastly, they would go out into their surroundings and measure the slope of an actual ramp such as a loading dock or handicap ramp.
3.2.1 Sliding and Tipping Angles
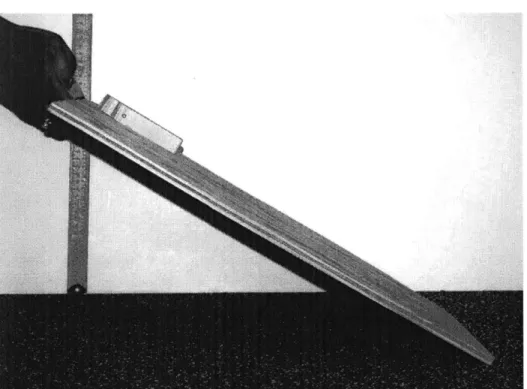
In order to simplify the experimental set-up so that measurements varying the angle can be made by a single learner with no supervision, it is recommended that the learner tape a ruler to the wall
Figure 8: Set-up configuration for the inclined plane that requires only one hand to operate.
One of the greatest challenges that came with designing the inclined plane suite was finding every-day objects that would be suitable for sliding or rolling down the inclined plane. Many objects either had too large coefficients of static friction to easily slide down the inclined plane or were not symmetrical and would not slide evenly down the plane. For the demonstrative set-up a small block of wood was used, but any material could be used as long as it has a flat surface and slides down the plane.
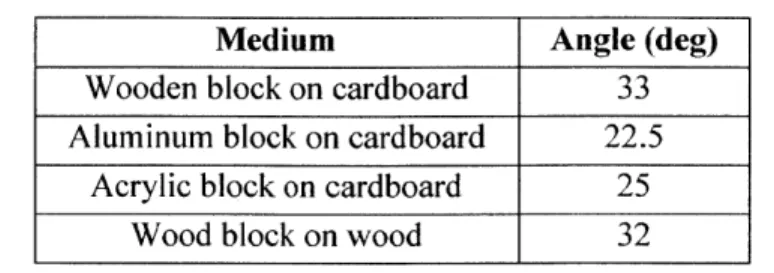
Once the set-Lip has been built, determining the sliding and tipping angles of the block is simple. Using the length of the inclined plane and the height of the plane when the object begins slipping or tipping, one could easily determine the critical angle. Multiple materials were tested in order to determine an optimal material that would most easily demonstrate the desired physical behaviors. Using the measurements in Table 2 and observations noted during the trials, it was decided that one pair of good materials for these observation of slipping were acrylic objects on cardboard. Not only will cardboard be one of the most readily available materials, many household objects such as CD covers are made out of acrylic or other plastics.
Table 2: Critical angle for slipping block on various mediums
Medium Angle (deg)
Wooden block on cardboard 33
Aluminum block on cardboard 22.5
Acrylic block on cardboard 25
Wood block on wood 32
The linear acceleration of an object rolling on an inclined plane is a function of the shape, but is independent of mass and radius. The linear acceleration for a round object rolling down a plane without slipping is
gsin(6)
1 + mr2
(3)
mr
Where m is the mass of the object, r is the radius, g is 9.81 m, 0 is the angle of the ramp, and I is the moment of inertia of the object. The moment of inertia is dependent on the shape of the object, for a solid sphere it is
J = 2 (4)
and for a hollow cylinder it is
I= mr2
(5)
many cases the other objects might have more mass than the chosen hollow cylinder. One pedagogical concern was that learners might interpret the observation that the other shapes would win the races was due to the fact that they had greater mass - even though the acceleration is independent of the mass and only due to the shape. One way to address this concern was to use the hollow cylinders that were clearly more massive than the other objects. This meant that when these hollow cylinders would lose the race, it could not be the mass that determined the acceleration of the objects.
This task proved to be surprisingly difficult. Multiple items like rolls of duct tape and toilet paper rolls were tried, but they did not roll reliably down the ramp. It was found that sections of hollow metal cylinders worked well, but they are not always easy to obtain. For these reasons it was decided to include a video of a sphere and a hollow cylinder rolling down an inclined plane so that learners can observe the effect of moment of inertia on the acceleration. In the video, the weight of the objects will be shown and multiple cases will be demonstrated where (i) the cylinder is heavier than the sphere and (ii) the sphere is heavier than the cylinder. If the learners have access to the needed materials and wish to run the experiment at home they will have the option to do so, but it will not be a required component of the suite.
3.2.2
Inclinometer
We want students to connect their experiences in measurement, analytical, and modeling skills with the real world. Hands-on experiences are key to developing these connections as learners are able to see real life examples of ideas and observe the result of changing variables' values. As a possible branch for the inclined plane suite of exercises, various ways to find examples of inclined planes used in everyday life were explored. One common example of this is handicap ramps. Due to many countries' laws guaranteeing equal access to spaces, regardless of disability, handicap ramps are becoming increasingly common. Originally, physically measuring the length and height of wheelchair ramps was attempted, but discovered that it was often difficult to measure height as the sides of the ramps were located where it was not possible to make a measurement of the height. As shown in Figure 9, many ramps are built in a manner that makes it impossible for students to accurately measure the height. Even if students were easily able to measure the height of the
handicap ramps, it does not mean that the ground itself is level. The important angle of incline is
with respect to the true horizontal - not the ground.
Figure 9: Example of a handicap ramp of which the students are unable to measure the slope because the change in height is essentially impossible to measure.
Because of the difficulty of measuring of handicap ramp heights, students instead will be asked to build a home-made inclinometer. They will use it to measure the construction angle of local handicap ramps, and see if they meet standard ADA requirements of a maximum slope of 1:12 [14]. Students who live in areas where handicap ramps are not available could instead do this
Figure 10: The first iteration of a homemade inclinometer that used a T-square, plumb-bob, and string.
To address the errors due to inconsistencies in the concrete surface angle, an inclinometer was created that used a simple cardboard box, a protractor printed from the internet, and the string and plumb-bob used from the pendulum suite experiments. As seen in Figure 1], the large size of the base of the box allows for a more global measurement of the average slope since the box isn't as easily effected by small defects in the concrete. The large printed protractor allows learners to easily distinguish small changes in angle, diminishing the error found when using the T-square. It is important to note that the thinner the string being used to attach the plumb-bob to the inclinometer, the easier it is to discern the angle of the slope.
Figure 11: Home-made inclinometer used to measure the slope of handicap ram ps.
Data taken of ramps on the MIT campus using the inclinometer in Figure 11 is given in Table 3. The ratios were calculated using the box height of 4.4 inches. The maximum allowable angle of an ADA approved handicap ramp is 4.78 degrees. All values measured meet this requirement for
ADA approval.
Table 3: Handicap ramp slopes measured using a homemade inclinometer
Ramp Angle (degree) ADA Compliant?
1 4 Yes
collected in a "real lab". This project shows students that they're capable of developing very simple tools that can measure real world objects accurately in a non-laboratory setting.
3.3 Rubber Bands
The third suite of labs uses rubber bands to allow students to explore the nature of elastic systems. The primary reason for choosing rubber bands is that they are more accessible than suitable springs to learners outside of a school environment. While rubber bands exhibit the relevant behavior only in tension (rather than in both tension and compression as do springs), the key relevant properties can be explored with rubber bands - making their accessibility a decisive factor in their selection. The basic measurements deal with force vs. extension curves to explore the region of linear relationship (Hooke's Law) and to discover that this represents only a portion of the overall behavior as a wider range of extensions is characterized. In addition to seeing the non-linear part of the force vs. extension curve, the learners can explore the phenomenon of hysteresis: the difference in the curves one can obtain by progressively increasing or decreasing the load on the rubber band.
The objective is to follow a procedure that allows students to investigate the elastic properties of rubber bands. These procedures are similar to those used to determine the elastic constants of springs. Investigating the effective spring constants of rubber bands in parallel and in series provides a nice vehicle for exploring some basics of Newton's laws as well as elastic systems. Once the learners have set up the laboratory experiment, they will measure the stretch of the rubber bands in different configurations for varying loads. The learner will measure the stretch of a rubber band for the following cases, as shown in Figure 12 below:
(A) Single Rubber band
(B) Two rubber bands in series
(C) Three rubber bands in series (D) Four rubber bands in series (E) Doubled rubber bands in series
(G) Quadrupled
A
rubber bands in series
B
C
Figure 12: Different configurations of rubber bands that lab students will test
After measuring the stretch of the rubber bands for 10 points, students will plot their data and extract an effective spring constants for each of the various test cases.
3.3.1 Set-up
To ensure that the force was evenly distributed across the rubber bands, a set-up using pens was devised. Placing the rubber bands around the pens as shown in Figure 13 ensures that the weight is evenly distributed across the bands. Any small cylindrical objects such as pencils, pens, markers, or dowels would accomplish the goal. It is critical that students use a set of identical rubber bands so that when they add rubber bands in series or parallel they are able to collect consistent data.
D
Figure 13: Rubber band set-up with pens Used to evenly distribute force and a
plastic cup to place weights in.
To keep the weight receptacle (cup) from tipping when weights were added to the system, a string was strung through four holes in the plastic cup and attached to the bottom marker using a paper clip.
To make sure that the rubber band is stretched enough for there to be a measurable change in length, it is recommended that students use objects that produce a change of length of at least 0.5 cm per additional mass. Aluminum angle brackets were used as the experimental weights in
Figures 14-17, but any item of substantial weight would work as a unit. Note that the learner
should have a number of identical items of the same weight available. An alternative option for varying the load on the rubber band is to use a measured amount of water because learners can easily determine the weight of their water from simple volume measurements using readily accessible containers of known volume such as water bottles and tablespoons.
3.3.2 Analysis
In the linear region, the force applied to a rubber band removes it from the equilibrium, or un-stretched point, this relationship between force and extension can be expressed by Hooke's Law:
F = kx (6)
Where F is force, k is the spring constant, and x is the distance from equilibrium. As more force is applied, the more the rubber band is stretched, and the greater the force exerted by the rubber band towards its equilibrium length. Rubber bands and springs have an elastic limit. If you pull the rubber band past a certain point, the physical properties of the rubber band change and the spring constant decreases, at which point the function is no longer linear. A rubber band has reached its elastic limit when it has been stretched past the point from which it can return back to its original shape.
To ensure that students would be able to repeatedly produce data that is good enough to extract meaningful values and trends, data for a single rubber band was collected. You can see the linear and elastic regime for this trial in Figure 14. Eq. (6) was used to measure the spring constant of
N
80.4 - in the linear regime.
. 5 0 02.
1-00
00 0 Inelastic RegimeRubber bands placed in parallel or in series can be used to determine the effective spring constant for the multi-band system. For identical rubber bands in series, the effective spring constant is
k
keff =
-n (7)
Where keff is the effective spring constant, k is the spring constant for a single rubber band, and
n is the number of rubber bands in series. For identical rubber bands in parallel, the effective spring
constant becomes:
keff = kn (8)
In order to cement their understanding of springs, learners must examine the effect on the spring constant of connecting rubber bands in series. Data were collected for a single rubber
band, two rubber bands in series, three rubber bands in series, and four rubber bands in series, as shown in Figure 15.
I rubber band 0 2 rubber bands
0.02 0.04 - 3 rubber bands, 0.06 0.08 Change in Length [m] 4 rubber bands 0.1 0.12
Figure 15: Change in length vs applied force for 1 to 4 rubber bands in series with measured spring constants of 85.7 N/m, 41.5 N/m, 29.5 N/M, and 19.2 N/m, respectively. Filled circles indicate the elastic region for each experiment.
Since the vertical axis is Force and the horizontal is Length, then Eq. (7) and Eq. (8) can be used to see that the slope of data is simply the spring constant. For the data collected the effective spring constants of the configurations given in Table 4 were found and compared to the expected effective spring constant.
0
0
0o
0
o
0
0
1.5 I 0.5 0 0 0.14Table 4: Measured and expected keff for rubber bands in series
# of Rubber Bands in Series Measure K [N/mi Expected K [N/mJ % Discrepancy
1 85.7 -
-2 41.5 42.8 -3.0
3 29.5 28.6 + 3.2
4 19.2 21.4 - 10
As seen in Table 4, the measured values of the effective spring constant and the expected spring constant are close enough to demonstrate the effects on spring constants from placing rubber bands in series. Average discrepancy of -3.3% indicates good agreement with the expected value of k for the multiple-band configurations tested.
It was found that attempting to measure the change in length for rubber bands in parallel using the same weighting system resulted in displacement results that were too small for learners to easily measure, because the high spring constant from adding rubber bands in parallel as shown in Eq. (8). In order to make the rubber bands "stretchier", sets of parallel rubber bands were added in series to create a comparable displacement. The configuration for these sets of parallel rubber bands in series can be seen in Figure 12 E -G. By combining Eq. (8) and Eq. (7), one will find
that configurations E - G in Figure 12 have a keff that is equal to that of the spring constant for a single rubber band. This gives learners the ability to measure the springs in parallel while still having measureable difference in the change in length. This has the added benefit of giving the learners experience in combining rubber bands in configurations that involve combinations of series and parallel arrangements.
in series was tested using water as the weight with measurements taken tablespoons. From Figure 16, it is possible to extract data from a system us
in increments of two ing water. 16-14 -12 -10 - 8- 6- 4-0 0.01 0.02 0.03 0.04 Change in Length [m] 0.05 0.06
Figure 16: Change in length vs applied force for two rubber bands in series using
water as a weighting system. The spring constant of the water based system is 45.4 N/m, this is 8.5% different from the spring constant of 41.5 N/m found for the non-water based system in Figure 15. Filled circles indicate the elastic region.
The final topic introduced to learners is the concept of hysteresis. Shown in Figure 17, the behavior of rubber bands when a load is removed is not the same as that when the load is being increased. This is called "hysteresis". If one repeatedly stretches and un-stretches a rubber band the stiffness gradually decreases and it becomes easier to stretch. As it is repeatedly stretched, the heat produced from the transfer of energy from the rubber bands to its molecules can be felt. This loss of energy through heat causes the observed hysteresis .This is a valuable concept to begin to introduce to students as it helps them connect seemingly disjointed occurrences like stretching and heat to hysteresis loops [15]. 0z Ln a) F 00 00 0.07 0
OLoading Unloading 1l.5 0.5 0 0 0.01 0.02 0.03 0.04 0.05 0.06 0.07 Change in Length [m]
Figure 17: Change in length vs applied force for two rubber bands showing
hysteresis. The red points indicate the loading curve and the pink indicate the Linloading curve.
4. Implementation of Pendulum Lab
In order to receive initial feedback on the functionality of the Pendulum Lab, 12 students in their first semester at MIT ran the experiment as part of a requirement for their Classical Mechanics class, known as 8.01. All students who participated by performing the Pendulum Lab were students in a special program at MIT known as Experimental Study Group (ESG). While MIT students are not the ultimate target of the designed lab experiments, valuable insights were gained from this initial round of implementation. The following section outlines some comments and assessment results from these students regarding the lab as well as some observations made after reading their
shown in Figure 18, was set-Up in a room that students could freely access to complete their experiment.
Figure 18: Laboratory set-up used by students in ESG to complete their
pendulum lab experiment
4.1 Student Lab Reports
After reading the lab reports submitted by students, there are a few observations on their understanding of concepts that can be made. First of all, for students in their first semester of college, their lab reports were extremely well written and well organized. Students took great care in drawing their graphs by hand and sone even went as far as to plot their graph using Excel. The care taken by students is evident from inspecting the slope of their graphs. When students drew a graph by hand and then extracted the value for gravity shown in Figure 19, it was found with a
95% confidence interval that their value for the acceleration of gravity were not statistically
significant from the expected value of 9.81l.
11 10 3 6 4 0 7,14 <44 1' /1' ~'/4' '4 1 2 3 4 5 6 Student Group
Figure 19: Values for gravity calculated by ESG students. The average value with
95% confidence is 9.65 0.31 , which is statistically indistinguishable from the
S2'
expected value of 9.81l.
S2
As an additional part of the lab exercise, students used dimensional analysis to determine the relationships between length and the acceleration of gravity of a simple pendulum. For learners below the college level this might be considered an advanced feature of such a lab. However, this provided a good opportunity to explore a wide range of exercises connected to the basic hands-on lab experiences. As shown in Eq. (1), it is evident that the relationship between period vs. length is not linear. Even after they derived this equation, multiple students plotted a linear fit to the data taken for period vs length, shown in an example from a student lab report in Figure 20. Even though they may have mathematically understood that the relationship was not linear from the equation, the results appeared somewhat linear due to the small number of points, and therefore
Period (T) as a Function of Length (L)
2.5 v= 1.409x + 0.6534 1 z Seriesl 0.5 - Linear (Series 1) 0 0 0.2 0.4 0.6 08 1 1.2 Length LFigure 20: Graph on the period vs length submitted by students showing an
incorrect linear fit.
As a way to make the data trends more evident and avoid their reliance on faulty intuition, in future instructions it will be suggested that leaners include (0, 0) as a point on their graphs. As pointed out in Section 3.1.2. including (0, 0) as a data point would be strictly speaking incorrect because it is not an actual measured result and using it can hide systematic errors in their data. However, including (0,0) on the graphs is so helpful in making evident the non-linear character of the T vs. L curve that it is important to be included. Students will be informed of the appropriate caution they should use when including (0, 0) on their graphs.
Another aspect that students had trouble with was internalizing that the period is independent of the mass. Even though they have determined that mass is not in the equation for period of a simple pendulum by deriving Eq. (1), many students made comments throughout their papers that lead LIS
to believe that they have trouble believing this. One student wrote:
We attached a piece of string to a small rubber ball using a piece oftape with ideally negligible mass.
If there is no mass in the equation for the period of a simple pendulum, then it is not necessary for
the tape to have a negligible mass. There will be an explicit branch of the basic measurement wherein they will vary the mass of the simple pendulum bob while keeping the length constant so
that they can observe that the oscillation period is independent of mass to within experimental error.
While most students correctly predicted that the period of the physical pendulum would be longer than that of the simple pendulum, one students predicted this was so because the physical pendulur has more mass rather than it being due to the distribution of the mass. To better address these misconceptions, in the future students will take measurements for the simple pendulum using a weight that is comparable to the weight of the ruler they measured for the physical pendulum. Doing this would allow for them to better see how it is not the mass that affects the period, but rather the distribution of the mass.
Despite having no formal training in error analysis or instruction on how to minimize errors in this class, all of the students provided great insight into the importance of measuring the period over a large number of cycles rather than measuring the period over just one cycle. Below is an excerpt from one of the lab reports submitted.
If you only measure the time for one cycle (short time) this experimental error is a
big percentage of the short time (which means the error can change the measured time by larger value). When you stop the time for ten cycles the time is then times as long and the experimental error of starting and stopping is only a small percentage of this time. Now we can divide the time for ten cycles by ten and hence divide the measuring error by ten. The new time for one cycle only has a tenth of the measuring error.
Students also understood the significance of log-log plots and realized the value in using them if you need to determine the particular power relationship between two variables. All students
set-up shown in Figure 21 where they' used a small pocket light as the plumb-bob and a piece of string attached to a pen as the fulcrum. They even went a step further and used a whiteboard to mark a 20 degree angle from the perpendicular to be able to release the plum b-bob from the same position every time. The value for gravity that they extracted from their data had a value of 9.84 which is a 0.3% discrepancy from the "true" value for gravity. This shows that students can build systems on their own and add features that improve the measurement.
Figure 21: Experimental set-up for the pendulum lab exercise designed by students without instruction.
Overall, the students were very successful in their lab reports and compiled excellent data on the period of simple and physical pendulums.
4.2 Survey Results
Written comments from all 6 pairs of students were solicited regarding the pendulum lab exercises they performed. Due to the size and uniqueness of the population tested it is not possible to draw statistically conclusive results, but the preliminary findings will be used to refine the labs and
Students were asked to indicate how much time they spent on the entire laboratory exercise. On average, students spent 30 minutes completing the data acquisition portion of the lab and 2 hours on the analysis and write up. Because the students were performing several components of a suite of laboratory exercises at once, rather than the intended format of "mini labs", the actual time to complete any one lab should be significantly less than that reported.
Overall, the written comments from the students regarding the labs were positive and recommended including it next year as part of the curriculum. Many students stated that the labs were a success in that they illustrated the concepts being taught well and motivated them to learn more about the differences between simple and physical pendulums. One student stated, "...I did find it helpful; hands-on experience is always more valuable in my opinion, which is why I liked this lab." Students also noted that the labs motivated them to learn more about new topics. One student wrote, "[This lab motivated me to learn more about] the differences between physical and simple pendulum."
Not all comments were positive. Many students suggested making the lab instructions less confusing to read. They would have preferred seeing it as smaller blocks of text that didn't seem as intimidating. It is not beneficial for students being exposed to physics for the first time to be scared of learning. In the future instructions will be modified to appear less daunting to the learners. One student stated that labs had too many questions, something that will be solved when the lab suite is broken up into "mini labs" as it was intended to be.
Some students stated that they would like to see labs centered on angular momentum and gyroscopic precession, as well as pulley labs that work on measuring acceleration and seeing forces in action. They also would like the labs to go more in depth and have allowed them to discover
Even though the work is at an early stage, the opportunity to have it used and feedback provided
by groups as disparate as MIT freshmen and Haitian learners will give us the opportunity to adapt
the work to a wide range of learners and learning environments.
5.
Conclusion
The initial purpose of this project was to create a set of low-cost hands-on mechanics experiments to complement online courseware. However, it was soon realized that the experiments could also be decoupled from this particular application and offered separately as a coordinated set of hands-on experiences for a wide range of learners across the world. By building devices like the inclinometer, these labs show that students are capable of developing tools that can connect multiple suites of labs using primitive devices. The challenges of developing these lab exercises included choosing widely obtainable materials, minimizing the lab costs, and designing experiments that could produce the necessary results to see the desired trends, even when built non-ideally. The feasibility of a core set of exercises using very limited and accessible resources has been demonstrated. Furthermore, it has been shown that learners can be connected to the basic underlying physics in such a way that it develops expert skills in observation and experimentation. The basic suites are each linked to real world applications that the learners can experience, observe and measure for themselves.
In the future, more branches to the labs will be added that will provide the opportunity to make more advanced measurements and connect the work to even more applications. Furthermore, the original basic work will be supplemented with measurements that make use of the video and accelerometer capabilities of smart phones that are becoming more and more broadly available across the world. As noted earlier, this was part of the original plan, but priority was given to the development of the basic simple labs not only for its wider accessibility, but for important pedagogical reasons. Smart phones sensors and interface systems such as those provided by Vernier software, all have often subtle mediating devices and technologies between the learners and the physical phenomena-essentially "black boxes". These can not only hide the nature of the phenomena, but can inject artifacts into the measurements and analysis that are not readily
recognized. So, even as we contemplate adding such options for the learners, we will build them on the foundations of simpler and more direct experiences.
Overall, the laboratory exercises developed for this project were quite successful and have provided an insightful stepping stone to continue the development of additional branches and laboratory exercises.