HAL Id: hal-01187875
https://hal.archives-ouvertes.fr/hal-01187875
Submitted on 27 Aug 2015
HAL is a multi-disciplinary open access
archive for the deposit and dissemination of
sci-entific research documents, whether they are
pub-lished or not. The documents may come from
teaching and research institutions in France or
abroad, or from public or private research centers.
L’archive ouverte pluridisciplinaire HAL, est
destinée au dépôt et à la diffusion de documents
scientifiques de niveau recherche, publiés ou non,
émanant des établissements d’enseignement et de
recherche français ou étrangers, des laboratoires
publics ou privés.
Protein-lipid Interaction Analysis by Surface Plasmon
Resonance (SPR)
Olga Lucia Baron Acevedo, David Pauron
To cite this version:
Olga Lucia Baron Acevedo, David Pauron. Protein-lipid Interaction Analysis by Surface Plasmon
Resonance (SPR). Bio-protocol , Bio-protocol LCC, 2014, 4 (18), pp.1-8. �hal-01187875�
Protein-lipid Interaction Analysis by Surface Plasmon Resonance (SPR)
Olga Lucia Baron* and David Pauron
Sophia Agrobiotech Institute, INRA-CNRS-UNS, Sophia Antipolis, France *For correspondence: [email protected]
[Abstract] Interactions of lipids with proteins are essential events in the framework of biological
membranes. Assessment of the affinity and specificity of protein-lipid binding can give useful information to elucidate cell membrane functions. Surface Plasmon Resonance (SPR) is a powerful technology to study macromolecular interactions, allowing direct and rapid determination of association and dissociation rates using small amounts of samples. An extensive range of binding analyses can be performed by SPR such as protein–protein, protein–membrane (lipids), protein–carbohydrate, protein–nucleic acid and even protein-small molecules. This protocol describes the binding of an antimicrobial protein (used as ligand) to a lipopolysaccharide (LPS) (used as analyte) after immobilization onto a CM sensor chip by amine coupling.
Materials and Reagents
1. Purified protein as ligand (purity >90%) (1 ml at minimum 20 µg/ml) 2. Purified Lipid as analyte (minimum 300 µl at 2 mg/ml)
a. LPS (Sigma-Aldrich, catalog number: L8274) b. Lipid A (Sigma-Aldrich, catalog number: L5399)
3. 10 mM acetate buffer (pH 4 to 5.5) (GE Healthcare, catalog numbers: BR-1003-49 to 52) 4. Filtered deionized water
5. 200 mM NaOH
6. HBS-EP buffer (GE Healthcare, catalog number: BR-1001-88) (see Recipes)
7. Amine coupling kit components (GE Healthcare, catalog number: BR-10000-50) (see Recipes)
8. Regeneration scouting kit components (GE Healthcare, catalog number: BR-1005-56) (see Recipes)
Equipment
1. Biacore 3000 system (GE Healthcare)
3. Glass vials (9 mm) 4. Glass vials (16 mm) 5. 1.5 ml centrifuge tubes
6. Sonicator (Branson Bath-type ultrasonicator, model: 5510)
Software
1. BiaEvaluation software (GE Healthcare)
Procedure
A. Preparation of reagents
1. Prepare reagents of the amine coupling kit according to the instruction datasheet (dissolve EDC and NHS in 10 ml filtered deionized water to obtain solutions at 400 mM and 100 mM respectively).
2. Allow all other reagents (1.0 M ethanolamine-HCl, HBS-EP buffer, acetate buffers and regeneration scouting kit solutions) to warm up to room temperature (22-25 °C) before use.
B. pH scouting
pH scouting allows to determine the optimal pH and ionic strength for ligand immobilization. This step is necessary when working with carboxymethylated dextran matrix (CM) sensors. 1. Set sensor chip into the Biacore instrument (follow instrument's handbook).
2. Set the HBS-EP buffer as running buffer.
3. Set up the immobilization pH scouting function in the Biacore control software.
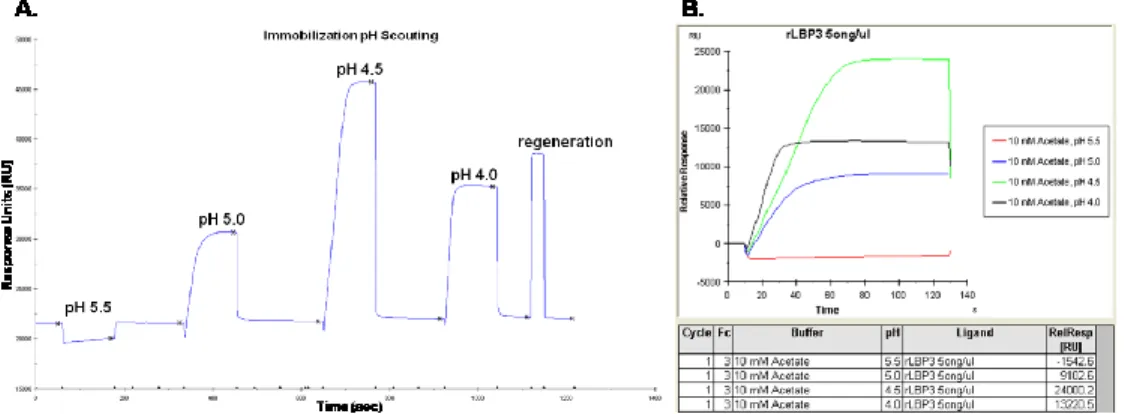
4. Prepare 100 µl of ligand solutions by diluting ligand to a final concentration of 20-200 μg/ml in 10 mM acetate buffers at different pH (4.0, 4.5, 5.0 and 5.5).
5. Inject 80 µl of each ligand solutions and determine the optimal pH in which the highest pre-concentration response is observed (Figure 1). After each ligand injection the sensor chip surface is washed with running buffer (already set up in the pH scouting function). 6. At the end of the pH scouting, inject 220 µl of 1 M ethanolamine-HCl. This regeneration
step is performed to completely remove the ligand from the sensor chip surface.
Note: Select your running buffer depending on the type of molecules to interact, which kind of assay will be run, and the type of sensor chip used. In this case, buffers free of primary amine groups or strong nucleophilic groups (e.g. sodium acetate) and of low ionic strength (e.g. 10 mM) are recommended for the electrostatic attraction to occur.
If two pH conditions give similar pre-concentration results, select the higher pH in order to avoid ligand denaturation or precipitation.
Figure 1. pH scouting sensorgram A and results report B showing responses generated by the ligand. In this case 4.5 is the optimal pH for ligand immobilization. Y-axial
variable illustrates the response in resonance units (RU) after ligand injections and X-axial variable shows the time settled for all injections.
C. Immobilization of ligand
1. Open the immobilization application in the Biacore control software and set up your template for immobilization.
2. Prepare the ligand in the acetate buffer with the pH you chose in step B.
3. Prepare vials with EDC, NHS and ethanolamine-HCl solutions. The volume of ligand and solutions (EDC, NHS and ethanolamine-HCl) required is displayed in the immobilization application and depends on how many flow cells will be used (Figure 2).
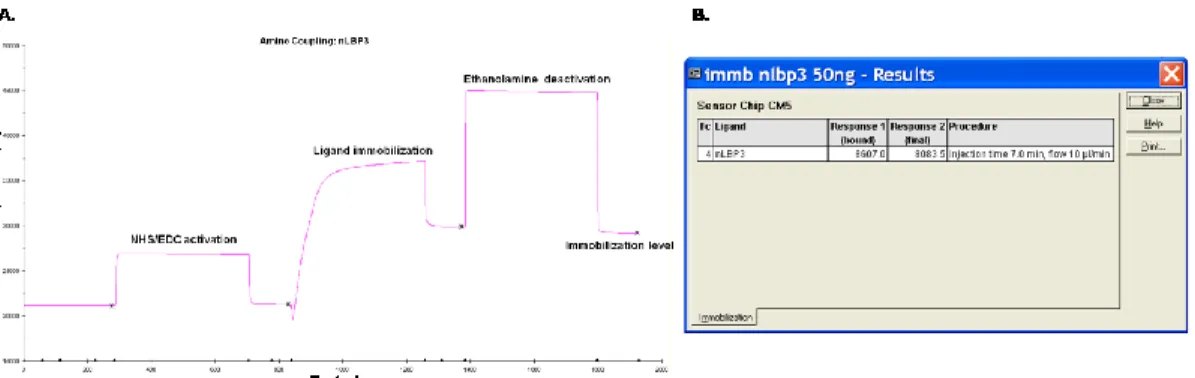
4. Run the immobilization procedure. The application will inject an EDC/NHS mix (1:1) to activate the chip surface for ligand immobilization, then ligand solution will be injected. Finally, an injection of ethanolamine-HCl will be performed to wash away unbound ligand and deactivate remaining active carboxyl groups.
5. Check immobilization results (Figure 3), evaluate the response in terms of analyte binding capacity of the surface and not on the response units observed. Optimal immobilization level depends on the relative molecular weights of the ligand and analyte. For this protocol, ligand immobilization was fixed to 7,000 RU. Binding capacity depends on the molecular weight of the analyte in relation to the number of ligand sites on the sensor chip surface. Binding capacity for ligand shown in Figure 3 was ~118 RU.
Note: If you are going to use the same analyte for several ligands, you can immobilize them all before continuing with step C4. At this point, you can stop the experiment and store the sensor chip at 4 °C.
Figure 2. Example of immobilization template showing volume solutions necessary to run the immobilization procedure
Figure 3. Sensorgram A and result report B of ligand immobilization. Response 1 shows
the amount of ligand bound to the surface after injection and response 2 illustrates the final amount of ligand covalently immobilized after surface deactivation.
D. Analyte preparation
1. Sonicate (at 40 kHz) stock solution of LPS or lipid A for 15 min at 25 °C. Since LPS tends to aggregate, it is important to sonicate LPS and lipid A solutions just before preparing analyte samples.
2. Prepare analyte at the desired concentrations in HBS-EP buffer. In our case, LPS was diluted at 5, 10, 25, 50, 100 and 200 µg/ml and lipid A at 3, 6, 10, 15, 20, 30, 40, 50 µg/ml.
E. Regeneration conditions
Regeneration scouting allows to determine optimal conditions to remove bound analyte from the ligand on the sensor chip surface. This step is important for a successful binding assay; it allows to identify the appropriate regeneration solution that will completely remove the analyte
without destroying ligand activity. Regeneration conditions need to be determined for each analyte.
1. Open the regeneration scouting application in the Biacore control software. 2. Inject the highest analyte concentration (e.g. 200 µg/ml).
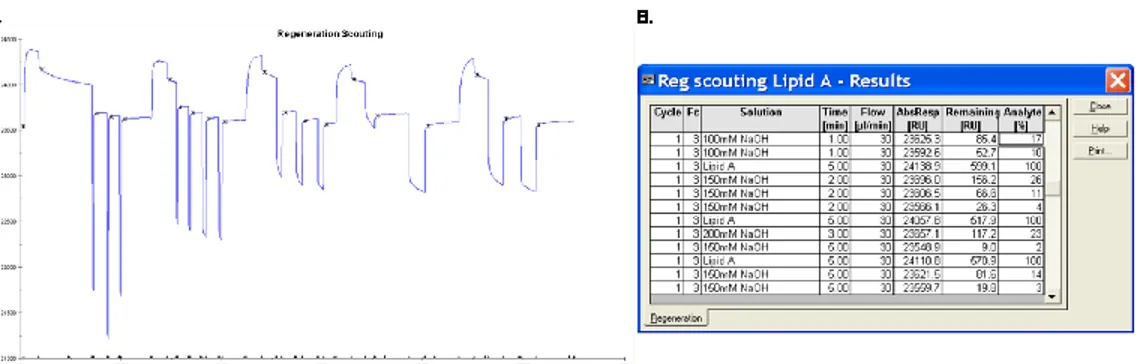
3. Test the buffers, starting with the mildest. First inject glycine buffers at pH 3.0, 2.5, 2.0 and 1.5 for 60 sec. If the response level does not go back to the baseline level (response before the analyte injection), keep on testing other buffers. Optimization of contact time of the surface with the regeneration buffer, number of buffer injections and baseline stabilization period will help to determine optimal regeneration conditions. In our case regeneration was set up with two washes of 20 mM NaOH for 5 min for LPS and 150 mM NaOH for 5 min for lipid A, followed by 2 min of wash with HBS-EP buffer (Figure 4). 4. Once you have identified good regeneration conditions for your experiment, perform
several cycles of analyte injection and regeneration in order to evaluate ligand performance (responses obtained from the binding assays should not vary more than 10% of the response of the first injection).
Note: The regeneration scouting kit provides several ready-to use buffers with a range of pH values and different ionic strength but alternative home-made buffers can also be used as long as they are filtered and degassed.
Figure 4. Regeneration scouting sensorgram A and result report B illustrating some conditions tested for analyte (lipid A) removal
F. Binding assay
Before starting your binding assay, design your experimental plan taking into consideration: 1. Flow rate and injection time for the antigen solution: need to be optimized according to
your ligand. Bear in mind that high flow rates help to avoid any mass transport effects and that long enough injections (and wash) allow to observe a curvature of the binding response and a decay in the dissociation phase.
3. Blank control: An activated and blocked flow-cell without immobilized ligand is necessary as a reference to evaluate nonspecific binding.
4. Negative control: Additionally to the blank, it is recommended to use a non-relevant protein of similar size of your ligand as a negative control of binding. This second control is helpful to validate your experiment since the stickiness of lipids may give false binding results.
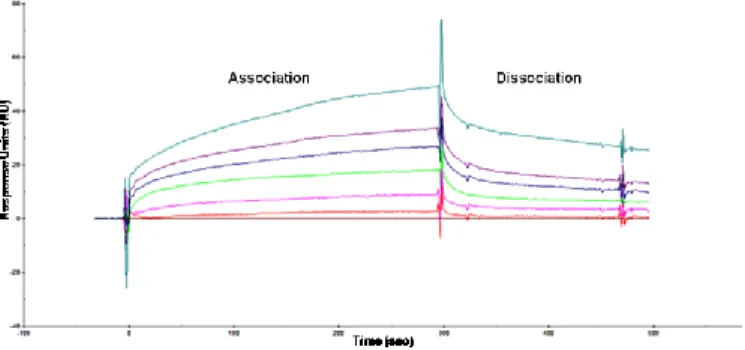
Once you have established your experimental conditions, proceed to perform your binding assay, you can use the binding analysis application provided with Biacore control software or customize your own application and templates following instrument’s manual. Typical results obtained in a lipid binding assay are exemplified in Figure 5.
Note: If using a new chip perform 3-5 cycles of binding before starting your real experiment to verify whether ligand-analyte interaction response is steady.
Figure 5. Sensorgram of protein-lipid (LPS) binding assay. In this example, binding
experiment was performed at the same time with three different proteins.
G. Binding analysis
Collected data are then analyzed using the BIAevaluation software (follow software handbook instructions - GE Healthcare). Figure 6 shows an example of results obtained after analysis of a protein-lipid binding assay. Experiments done in triplicate gave similar results.
Notes
1. Due to the inherent stickiness of lipids, it is strongly advised to thoroughly clean the instrument (desorb and sanitize) after binding experiments to remove traces of analyte remaining in the circuits of the Biacore system.
2. If several ligands and analytes will be analyzed by SPR, it is recommended to have at least two sensor chips. Foreseeing a sensor chip stock is useful in case one or more ligands are damaged when adjusting regeneration conditions.
Recipes 1. HBS-EP buffer 0.01 M HEPES (pH 7.4) 0.15 M NaCl 3 mM EDTA 0.005% (v/v) P20 Surfactant 2. Amine coupling kit components
750 mg 1-ethyl-3-(3-dimethylaminopropyl) carbodiimide hydrochloride (EDC) 115 mg N-hydroxysuccinimide (NHS)
10.5 ml 1.0 M ethanolamine-HCl (pH 8.5) 3. Regeneration scouting kit components
11 ml ethylene glycol (p.a.) 11 ml 10 mM glycine-HCl (pH 1.5) 11 ml 10 mM glycine-HCl (pH 2.0) 11 ml 10 mM glycine-HCl (pH 2.5) 11 ml 10 mM glycine-HCl (pH 3.0) 11 ml 4.0 M magnesium chloride 11 ml 0.2 M sodium hydroxide
11 ml 0.5% sodium dodecyl sulphate (SDS) 11 ml 5.0 M sodium chloride
20 ml surfactant P20
Acknowledgments
The authors wish to thank the Analytical Biochemistry Facility of the Sophia Agrobiotech Institute (ISA) for kind access to the Biacore system. This work was funded by ANR
(ANR-07-References
1. Baron, O. L., van West, P., Industri, B., Ponchet, M., Dubreuil, G., Gourbal, B., Reichhart, J. M. and Coustau, C. (2013). Parental transfer of the antimicrobial protein LBP/BPI protects Biomphalaria glabrata eggs against oomycete infections. PLoS Pathog 9(12): e1003792.