HAL Id: hal-01420438
https://hal.archives-ouvertes.fr/hal-01420438
Submitted on 20 Dec 2016HAL is a multi-disciplinary open access archive for the deposit and dissemination of sci-entific research documents, whether they are pub-lished or not. The documents may come from teaching and research institutions in France or abroad, or from public or private research centers.
L’archive ouverte pluridisciplinaire HAL, est destinée au dépôt et à la diffusion de documents scientifiques de niveau recherche, publiés ou non, émanant des établissements d’enseignement et de recherche français ou étrangers, des laboratoires publics ou privés.
of the dynamics of carbon resources of a West-African
village territory
Mahamadou Belem, Sansan Youl, Jean-Luc Chotte, Bruno Barbier,
Christophe Lepage, Raphaël J. Manlay
To cite this version:
Mahamadou Belem, Sansan Youl, Jean-Luc Chotte, Bruno Barbier, Christophe Lepage, et al.. MIROT: A multi-agent system model for the simulation of the dynamics of carbon resources of a West-African village territory. International Conference on Regional and Urban Modeling, Jun 2006, Bruxelles, Belgium. 22 p. �hal-01420438�
dynamics of carbon resources of a West-African village
territory
Mahamadou BELEM
a,b,*, Sansan YOUL
c,d, Jean-Luc CHOTTE
eBruno BARBIER
f, Christophe LEPAGE
g, Raphaël MANLAY
ha Institut de Recherche Pour le Développement (IRD)
UR179 SeqBio - 911, Avenue Agropolis, 64501 34394, Montpellier, Cedex 5 - France e-mail: mahamadou.belem@mpl.ird.fr
b Ecole Nationale du Génie Rural, des Eaux et des Forêts (ENGREF)
648, Jean-François Breton - Domaine de la Valette BP 44494 - 34093 Montpellier Cedex 5 – France
c Institut de Recherche Pour le Développement (IRD)
UR179 SeqBio - 01 BP 182 Ouagadougou 01 - Burkina Faso e-mail: youl@ird.bf
d Institut de l’Environnement et de Recherches Agricoles (INERA)
Kamboinsé - 01 BP 476 Ouagadougou 01 - Burkina Faso. e-mail: sansan.youl@messrs.gov.bf
e Institut de Recherche Pour le Développement (IRD)
UR179 SeqBio - 911, Avenue Agropolis, 64501 34394, Montpellier, Cedex 5 – France. e-mail : Jean-Luc.Chotte@mpl.ird.fr
f Centre de coopération internationale en recherche agronomique pour le développement (CIRAD)
Av. du President Kennedy - 01 BP 596 Ouagadougou 01 - Burkina Faso. e-mail: bbarbier@cirad.fr
g Centre de coopération internationale en recherche agronomique pour le développement (CIRAD)
73, av. Jean-François Breton - 34398 Montpellier Cedex 5 – France; christophe.l@chula.ac.th
h Ecole Nationale du Génie Rural, des Eaux et des Forêts (ENGREF)
648, Jean-François Breton - Domaine de la Valette BP 44494 - 34093 Montpellier Cedex 5 – France e-mail: manlay@engref.fr
* corresponding author
Institut de Recherche Pour le Développement
UR179 SeqBio, 911, Avenue Agropolis, 64501 34394, Montpellier, Cedex 5 - France e-mail: mahamadou.belem@mpl.ird.fr
Abstract: The decrease in carbon (C) resources in West African savannas falls within local
agroecological and global environmental issues. Understanding how they are impacted by human activities at the village level is thus crucial. Multi-agent system (MAS) formalism can assist in representing the complex interactions between ecological and socio-economic dynamics. A MAS model (MIROT) was implemented into the CORMAS platform to simulate the dynamics of C resources of a village in Burkina Faso. The representation of the environment was achieved by importing data from digital maps. Two bio-economic models (implemented with GAMS) were coupled with MIROT and used to simulate optimized farmer’s strategies of decision at the farm level. Various scenarios were compared from simulations to assess the relative impact of climatic, demographic, economic or social factors on the viability of the village system as estimated by its carbon budget.
INTRODUCTION
In sub-Saharan Africa the availability inand cycling of carbon resources largely determine the viability of smallholders’ low-input, farming systems. These rely on the soil organic carbon (SOC) content as well as the availability of wood, grain, fodder, all organic resources.
Within the context of global change and within the Clean Development Mechanism of the Kyoto Protocol, developing countries may be funded by Annex-I parties to the United Nations Framework Convention on Climate Change for their efforts in mitigating the greenhouse gases content in the atmosphere (UNFCCC, 1997).
Carbon (C) resources are declining in West African savannas (Ker, 1995). Improving their management is thus crucial from both local agroecological and global environmental points of view. Since carbon resources are renewable and, to a certain extent, shared between several decision-makers, particular attention should be paid to the level at which improvements are conceived and promoted. In West-African savannas, the village territory level must be considered, because of the functional connection between the land use systems and the communal control of fertility management practices and of land tenure (Manlay et al., 2004a).
Carbon dynamics of a village territory is complex. It involves interactions at several scales of time (day, month, season, year) and space (plot, farm, village territory and beyond). These interactions occur between actors in the system, and between actors and their environment. The environment drives the human activities: such as agricultural practices or breeding. Environmental conditions are subjected to complex external factors: climate change, global socio-economic context, etc. Through their activities human societies contribute to the transformation of the environment. In turn environment modifies the behaviour of human beings to adapt to the new conditions, and so on.
To understand such a complex system, tools simulating the state of the future environment and human behaviours along plausible scenarios are needed. Descriptive approaches can only assess past and present situations. At the plot level, forecasts can be made using real experiments. But at the farming system and regional levels the multiplicity of actors and scales of time and space makes computer modelling a better experimental tool to analyse the C cycle. This study aimed at developing a tool for the quantification of the carbon flows and stocks of a village territory. For this purpose a model that would represent the biophysic and socio-economic determinants of C dynamics in a territory was implemented and tested. Our assumptions were the following:
1. Any relevant analysis about decisions on the management of organic (associated C and nutriments) resources must encompass the village territory level because of their communal regulation.
2. The multi-agent system (MAS) is a tool for prospective analysis which adequately supports the analysis by anticipation of the dynamics of the natural resources at the scale of the village territory. These analyses are made according to a range of scenarios of land management.
In the following section, multi-agents systems are defined and the study site is described. Then basic explanations about the functioning of carbon dynamics in the farming system and the conceptual framework of the MIROT model are provided. Finally simulations for some key variables under simple scenarios are shown and results are discussed.
1. MODELLING CARBON DYNAMICS IN
HUMAN COMMUNITIES
The management of a renewable resource involves complex interactions between social and ecological dynamics. Models can help better to understand the mechanisms underlying these interactions and predict the likely impact of various collective rules and policies. Models apprehend the phenomenon studied through the representation of its principal factors. The understanding of the carbon dynamics requires considering the biological, social, physical, economic and political factors. However taking into account these major factors requires a study at a large scale such as the village, the region or the country.
Several studies simulated the organic stock management and carbon at the scale of the rural community in West Africa (Reenberg, 1996 ; Barbier, 1998 ; Defoer et al., 1998 ; Stephenne et Lambin, 2001 ; Manlay et al., 2004c ; Manlay et al., 2004b ; Tschakert, 2004) but these are theoretical, or strictly qualitative, or spatially non-explicit. Generally they do not take into account actors’ diversity and restrict to an over-simplified set of their activities (Thornton et Herrero, 2001).
This communication describes a multi-agents model that simulates the dynamics of carbon (and related nitrogen) resources at a village territory scale in the south-west of Burkina Faso: Touroukoro. The model integrates two types of farmers and the activities of cattle intervening in the spatial distribution of the organic matter. It integrates constraints related to resource use: equipment, cash, land, cattle, etc. Thus, we use two bio-economic models built with Gams (General Algebraic Modelling System) to optimize the rules of decisions of the farmers.
2. MULTI-AGENT SYSTEMS AND
OPTIMIZATION
MAS have become a popular tool to simulate the dynamics of a renewable resources (Axtell, 2000 ; Abrami, 2004 ; Barreteau et al., 2004 ; Bousquet et Le Page, 2004). Then, the MAS application domains go increasely: agronomy, economy, Internet, etc.
MAS come from the need to have heterogeneous agents able to coordinate their actions in order to solve a problem in the same system. An agent is considered here as an “autonomous entity capable of reacting to its environment, determining its most appropriate goals and actions in its world, and reasoning about deadlines and tradeoffs arising from those determinations” (Vincent et al., 2001). The capacity of an agent to modify its environment is determined by a set of actions assigned to him, thus defining its competences. A MAS is a set of agents representing the actors of the world studied. MAS are virtual laboratories controllable and observable by the operators. Because of its flexibility, MAS become a sustainable tool to represent and simulate complex systems (Jennings, 2000).
The dynamic of carbon considered at the scale of the territory village is a complex system. It is characterized by a great number of entities (e.g. vegetation, climate, soil, cattle, farmers which adopt different types of rotation) requiring an individual treatment. Also, the study of dynamics at the scale of the territory village is interested in flow of carbon in the soil, consequently its spatial distribution (Manlay et al., 2004c). The soil in this case, is carrying resources being the subject of a use by the various actors of the system. Thus, a spatial modelling will make it possible to take into account the interactions between social and spatial dynamic. We retained the MAS formalism, in order to represent the dynamic of carbon in all its complexity.
MAS agents evolve in a dynamic, complex and unforeseeable environment. It is difficult to predict correctly the behaviour of environment. To adapt and react to the various changes, the agents use individual or collective actions. A new organization can emerge (Drogoul et al., ; Müller, 2004) from these
interactions. These characteristics are useful to clarify problems of coordination involved in the management of a resource.
Within the same model MAS can represent various levels of organization (from individual to groups) and make the articulations between these levels of organization explicit (Servat et al., 1998 ; Hilaire, 2000 ; Amiguet, 2003 ; Abrami, 2004 ; Tranouez, 2005). By taking into account the various levels of organization of a system, MAS make it possible to study which a same model various points of view.
Space constitutes a central element in the interactions between the agents. Space carries the resources which are the subject of a common use by the various entities. Multi-agents models can take into account the spatial organization of resources and the spatial constraints of their management (Bonnefoy et al., 2000 ; Bonnefoy et al., 2001 ; Dumont et Hill, 2001 ; Lion, 2005). Thus, through spatial modelling and the modelling of the actions of the actors, the MAS highlight the impact of the various uses on dynamics of space. One of the major problems in environmental sciences is the representation of space on several hierarchical scales. Several platforms such as CORMAS provide utilities to represent the heterogeneity of space and the interactions which exist between social and spatial dynamic.
For the implementation of Mirot Model, CORMAS (Common-Pool Resources and System Multi-Agent) (Bousquet et al., 1998) was used as a platform of simulations.
2.1. O
PTIMISATION
The system studied is a semi-marketed agriculture where the main objective of the farmers is supposed to be the satisfaction of food and monetary needs. Farmers’ decisions are influenced by a whole of constraints. To this end, Capillon in (Herve et al., 2002) defines an agricultural system as ‘‘a decision-making chain within a set of constraints and assets, implemented to achieve one or more goals, that governs production processes and can be characterised by flux (money, material, information, and labour) within and outside of the farm.’’ Roughly, farmers are constrained by the limitation of the resources and the state of the environment to produce and sell their production in an optimal way. Within such a view two bio-economic models were used to optimize two farmers’ sets of decisions: (1) cropping strategy, and (2) programming of sale of agricultural production. The GAMS software was used for optimization steps.
Mathematical-programming models are used to simplify the behaviour of the multi-agent model. Some of the results of the simulations of the MAS were used as parameters for the mathematical models and vice versa.
3. STUDY SITE: THE VILLAGE TERRITORY OF
TOUROUKORO
The village of Touroukoro is located in the south-west of Burkina Faso in the Comoé province. The climate is of sudanian type with rainfalls higher than 1000 mm allowing to grow a wide variety of crops (Bonkougou, 2004).
The population of Touroukoro is highly diverse with either indigenous or migrant coexisting ethnic groups (Bonkougou, 2004). It is growing fast because of high natality rate and high immigration flow. Two major, contrasted farming systems can be distinguished:
1. an indigenous system of semi-continuous crops based on yam (Figure 1): practised by the natives with rotation of yam/maize/sorghum then grains during two (2) or three (3) years before returning the land into long fallow (for ten years or more);
Figure 1: Crop rotation in the indigenous semi-permanent cropping system
2. The migrant system crop is based on cotton (Figure 2): with the usual rotation of the maize/cotton/maize/sorghum;
Figure 2: Crop rotation in the migrant continuous cropping system
3. A continuous farming system practised by the small farmers without draft animals and equipment.
Crops cultivated in Touroukoro can be subdivided into two categories: cash crops (cotton, yam), and food crops (maize, sorghum, etc.). Cattle husbandry is the second source of income and cashew production is the third source of income. Cashew tree planting also aims at securing land.
4. A SIMPLIFIED DESCRIPTION OF CARBON
DYNAMICS OF A VILLAGE TERRITORY
Description of carbon dynamics at the village territory scale answers at several levels of description: plot, farm and village territory.
4.1. T
HE PLOT LEVEL
Carbon is fixed in the ecosystem in an organic form primarily by photosynthesis in the arbour-ground biomass of plants. Through respiration a fraction of the carbon stored returns to the atmosphere. Plants fill the litter and soil compartments after senescence of their above and below-ground organs and humification. Animal dung deposition also contributes to SOC accretion. A portion of SOC is transferred by erosion and lixiviation. Finally, SOC content depends on soil characteristics (depth, texture, etc.) and human activities (e.g. management practices, wood harvest, bush fires, etc.)
4.2. T
HE FARM LEVEL
Carbon dynamics at the farm level is -to some extent- the aggregation/addition of the carbon dynamics occurring at the plot level, but not only. Farmer’s main objective is the satisfaction of his needs of food, cash, and social recognition. Demand is driven by measurable features of the household (such as community size), but not only. It is constrained by money, labour availability and other means of production. Farmer’s needs, among other things, define management schemes that drive carbon dynamics (accretion, uptake, turn-over) in each plot -individually or mutually with nearby plots- as well as livestock- or harvest-mediated carbon flows set across the farm boundaries.
4.3. T
HE VILLAGE TERRITORY LEVEL
At village territory level, behaviour and decisions of a single actor are controlled by her/his community, other actors, and collective structures (committees, customary authority) operating at different scales. To achieve their goals actors interact through institutions (formal or abstract) such as the market. Interactions can be set through tenurial or manuring agreements that modify the carbon allocation and transfers. Carbon dynamics at the village territory level is also influenced by the coexistence of contrasted types of socio-economical and cultural groups. One type can have contrasted access to, and practices for the management of resources (among which carbon) that may be synergistic or antagonists with those of other groups. These distinctions are often influenced by the social membership.
Additionally landscape patterns of rainfall, soil, vegetation and freshwater distribution drive the behaviour of decision-makers and constraint access to communal carbon pools. The complexity and instability of environment require permanent adaptation from local decision-makers.
5. MIROT, AN OPTIMIZING MAS
A MAS typically includes agents, objects, organization and structure of its environment. In MIROT, the agents Farmer and Cattle are the two active entities. The system mimics their behaviour and their dynamic.
5.1. F
ARMER
The Farmer agent is a cognitive agent. Its database determines its knowledge on the state of its environment, and a base of rules enabling it to determine the action to be carried out in a given situation. It has the knowledge of the existence of the other agents. It exchanges information with them. Farmer’s main features are household size, cash disposal, food and livestock stocks, and available land.
The Farmer tries to optimize its utility while satisfying its needs for food and cash (Figure 3). Needs for food and cash depend on the family size (Equation 1 and Equation 2). To achieve its objectives Farmer must set the surface needed for each crop. It defines an optimal plan of production according to the adopted strategy. The production plan depends on resources (land and labour) availability and biophysical factors requiring a rational behaviour from the farmer.
Exploitation of the plot (e.g. through fertility decrease) changes the environment of the farmer and yields an information feedback (production). This feedback will influence the Farmer’s future behaviour. For instance positive feedback induces investment in cattle and equipment to improve production. Investments are made with the Farmer’s cash income. Farmer establishes a selling plan for each crop while taking into account the constraint of satisfaction of food and money. If the farm production becomes too low, the Farmer can migrate or change its strategy. Farmer also adapts to the state of the environment. ) Size Population * FoodNeed Individual ( FoodNeed Concession ← Equation 1: Model of assessment food need
) Size Population * ed MonetaryNe Individual ( ed MonetaryNe ← Equation 2: Model of assessment monetary need
It uses past recent experience to minimize risks: year after year, the agent Farmer’s memory is updated with yield achieved. The memory is limited to five years. From its memory, the Farmer defines lowest possible yields and productions and thus minimal surfaces for each crop. This rule guarantees an optimal
level of satisfaction of its need. The satisfaction of the needs is a condition for the stability of the Farmer. When the needs are not satisfied and cash is not sufficient, a part of the household migrates towards a new farm or leaves the village. Given these descriptions the farmer is a rational entity able to act so as to improve his utility.
Farmer cropping process decision:
evaluate food need
evaluate monetary need
define production
cultivate
harvest production
define crop sale plan sale a fraction of production
migrate invest Bye equipment [cash sufficient] [equipment insufficient] [production insufficient] define production
sale a fraction of production migrate
evaluate food need
evaluate monetary need
invest [cash sufficient] cultivate harvest production Bye equipment [equipment insufficient]
[production insufficient] define crop sale plan
Figure 3: UML diagram for Farmer’s rules of decision for cropping
5.2. A
GENT
C
ATTLE
Agent Cattle is a located agent. It is characterized by its size and the quantities of organic matter ingested and deposited monthly. The representation of the cattle activity in the system makes it possible to take into account their role in the transfer of organic matter/fertility (Landais et Guérin, 1993). It is a reactive entity which functions by stimulus.
In the MIROT model, the activity of the cattle is represented through the following elements: ingestion, excretion and mobility rules. The principal objective of the Cattle is the satisfaction of its requirement in fodder and water, some resources distributed on the environment. To access these resources, the Cattle must move. Plot attractiveness is a function of fodder availability. Cattle can not access some land use (orchards and crops). Thus, from its current place, the Cattle selects the best pastures.
The direction of moving determines the distance walked on a plot and the residence time of the agent Cattle. The residence time depends on the travel rate. Grass intake (Equation 3) and dung deposition (Equation 4) are calculated. The displacement of Cattle is limited by a maximum duration of daily moving and the satisfaction of Cattle needs.
ime
residenceT
city
UptakeCapa
ake
biomassUpt
=
*
Equation 3: Model for fodder uptake by agent Cattle. uptakeCapacity is the amount of fodder ingested per hour and residenceTime is the residence time of Cattle on the plot
. e sidenceTim erHour excretionP excretion= *Re
Equation 4: Model for dung deposition. excretionPerHour is the quantity of organic matter deposited per hour and residenceTime is the residence time of Cattle on the plot.
5.3. T
HE OTHER OBJECTS OF THE SYSTEM
Other main objects in MIROT are:
- Climate, that evaluates monthly rainfall,
- Time, which evaluates the year and month of simulation,
- Month, which describes the evolution of data according to the month of the year. It is described by the name and average rainfall of the month, and the monthly fodder needs and excretion for an animal,
- Crop, which describes the various types of crop used in the model. A Crop is characterized by its type, selling and purchase price, gross and direct margin and fertility requirements,
- Cropping_Culture that describes the cropping system, each cropping system being characterized by its type, and crop rotation (treated as an ordered list of crops),
- Storage, which defines the quantity of grains stored in the household’s loft.
5.4. S
PATIAL ORGANIZATION
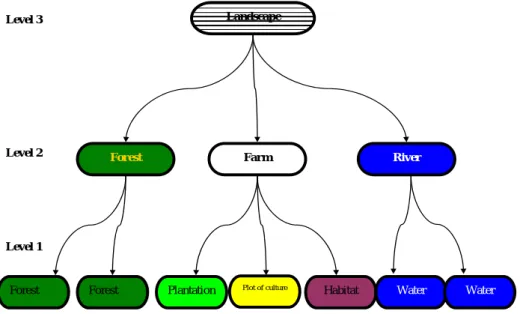
To carry out an explicit representation of the environment a multilevel organisational structure of space was adopted. Three levels were distinguished (Figure 4):
- Level 1 corresponds to the elementary spatial entities (that is, the plots) of the system,
- Level 2 corresponds to the spatial entities formed by aggregates of the spatial entities of level 1 gathered according to a common characteristic. The entities of Level 2 are either (1) non appropriated, in which case they are covered by savanna/forest vegetation, or (2) they belong to one Farmer and as such define the boundaries of its cropping, planting and breeding activities. - Level 3 represents the simulated landscape at the village territory.
Landscape
Forest Farm River
Plot of culture Plantation
Forest Forest Habitat Water Water
Level 3
Level 2
Level 1
Figure 4: Spatial organization of MIROT
5.5. S
PACE CONFIGURATION
The space of simulation is reproduced thanks to an importation of data from a geographical information system (GIS) into CORMAS (Figure 5). This importation, based on the morphopedological map of Touroukoro increases the realism of the model by taking into account some actual spatial constraints on the behaviour of actors. The map consists in a grid of points, each point corresponding to a 1 ha cell. Five types of land are distinguished defining a vegetation cover for each plot.
After initialisation of vegetation cover the plots are gathered into sets of 25 plots at least to form one farm. In conformity with reality, initial farms establishment is set in specific areas of the grid depending on Farmer’s social membership (migrant or native).
Soil distribution Land cover Habitat location
Migrant natives shoal
Forest
Treeless plots Glacis of junction: high slope
(ferruginous soils)
Residual relief, armoured hillock
Alluvial formation : hydromorphic soil
Glacis of junction: middle slope (ferruginous soils)
Figure 5: Map generation
5.6. L
AND USE AND LAND USE CHANGE
The initial vegetation cover of a plot is forest, but it then changes varies according to its land use (crop, fallow, plantation, compound, kraal) (Figure 6). The occupation of the cultivated plot changes according to the cropping system (Figure 7 and Figure 8). A plot whose fertility is insufficient for the cropping returns in fallow and is exploited when its fertility is sufficient. The fertility of a plot is represented by discrete scales of points of fertility. When the plot is cultivated, its fertility decreases according to the fertility required by the crop. But, it increases by one point when it is left into fallow.
forest field
plantation
habitat
plot in fallow plant cashew tree
cultivate()
build habitat
fertilize
[fertility sufficient] cultivate()[plantationAge<=5]
occupation=yam occupation=corn occupation=sorghum fallow
cutivate(yam) cultivate(corn) cultivate(sorghum)
cultivate(sorghum)[ageCulture<=5] leave plot in fallow
fallowDuration>=10
stopToCultivate[ plantation of cashew existes and plantationAge>=5]
Figure 7: land use and land change dynamics in native system
occupation=corn occupation=cotton occupation=sorghum
fallow
(first year) cultivate(corn) (second year) cultivate(cotton) (thirth year) cultivate(corn)
cultivate(sorghum)[ageCulture<=5] leave plot in fallow
fallowDuration>=10
stopToCultivate[existe plantation of cashew and plantationAge>=5] (fourth year) cultivate(sorghum)
cultivate(corn)[fertilized]
Figure 8: land use and land change dynamics in migrant system
5.7.
BIOMASS GROWTH
Several pools of biomass are represented in the model: herbaceous layer, above-ground tree (AGT) layer roots, and crop residues. Their growth varies according to their occupation and from uptake by farmers or animals.
AGT biomass of non-cropped and cropped plots is estimated as logistic (Equation 5) and decreasing exponential (Equation 6) functions, respectively (Youl, 2003).
( )
t r AGT AGT AGT AGT AGTe
S
S
S
S
t
S
× −×
⎟⎟
⎠
⎞
⎜⎜
⎝
⎛
−
+
=
)
0
(
)
0
(
1
max maxEquation 5: Model of above-ground tree (AGT) biomass allocation in a non-cultivated plot. SAGT(t): amount of AGT biomass at time t;
( )
r t AGTAGT
t
S
e
S
=
(
0
)
×
− ×Equation 6: Model of above-ground tree (AGT) biomass allocation in a cultivated plot. SAGT(0): initial amount of AGT biomass at t =
0; r: decrease constant; t: length of cropping
Herbaceous biomass is modelled as a function of AGT biomass (which is a competitor for light) (Equation 7). Cultivated plots are weeded.
( )
( )
( )
⎟
⎟
⎠
⎞
⎜
⎜
⎝
⎛
⎟⎟
⎠
⎞
⎜⎜
⎝
⎛
−
×
⎟⎟
⎠
⎞
⎜⎜
⎝
⎛
−
×
+
=
+
max max max max)
1
(
AGT AGT AGT herb herb herb herb herbS
t
S
S
S
t
S
S
growthHMax
t
S
t
S
Equation 7: Growth model for herbaceous biomass. Sherb(t): amount of herbaceous biomass at time t; growthHMax: maximum
herbaceous growth; Sherbmax: maximum amount of herbaceous biomass; SAGTmax: maximum amount of above-ground tree (AGT) biomass;
SAGT(t): amount of AGT biomass at time t
The output of crop is evaluated according the rainfall and fertility of plot (Equation 8).
pport
fertilityA
Fall
normalRain
rainFall
ut
normalOutP
outPut
⎟
×
⎠
⎞
⎜
⎝
⎛
×
=
Equation 8: Crop output model
Where normalOutPut is the output of the crop, rainFall the rainfall evaluated by the model and normalrainfall the average rainfall in Touroukoro and fertilityApport the impact of fertility on output of crops
fertilityApport = 1 if plot fertility (plotFertility) is great than or equal to the fertility required (requiredFertility) by the crop else:
rtility requiredFe ity plotFertil pport fertilityA =
Equation 9: impact of fertility on output of crops
5.8. MAS
COUPLING WITH
G
AMS OPTIMIZATION MODEL
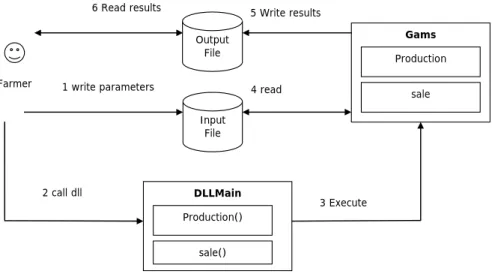
To integrate optimization into the MAS the CORMAS platform is coupled to the GAMS software (Figure 9). The interaction is achieved using dynamic link library (DLL). Optimization modules are called through this DLL.
Since CORMAS was developed within Visual Works (VW). VW predefined methods enabling the execution of a C program from a SmallTalk program were used. The DLL was thus written in C. Two modules of optimization are developed in GAMS (Figure 9). The Production module builds the Farmer’s production plan. The Sale module defines the Farmer’s selling plan. The DLL comprises two principal methods production() and sale() intended respectively to call the production and sale module of Gams. Optimization is made at the individual (i.e. Farmer) level only. Agents run in a concurrent way and use the same files of parameters and results. However, the parameters can differ from one agent to another. To avoid conflicting access to data, semaphores were used. Semaphores enable restricted access to the resources shared such as the input and output files. When an agent starts a call of optimization, any other access to the module of optimization is blocked until the end of the first call. As a result the sequential execution of optimization modules decreases the performance of the model.
DLLMain Input File Production() sale() Gams Production sale Farmer Output File 2 call dll 3 Execute 5 Write results 6 Read results 4 read 1 write parameters
Figure 9: Structure and functioning of the MAS-Gams optimization model coupling
The production plan depends on food and monetary needs, labour, equipment availability, area for each crop, and output of each type of crop. These data are stored in a file of parameters. The Gams optimization module reads this file and then provides the optimal crop area distribution.
The selling plan takes into account the production of each crop, needs for food and money and commodities prices that are stored in a file too. The optimization module provides the quantity to be sold for each crop.
6. SIMULATION
Simulations were run in model implemented under contrasted scenarios to assess the value of the models, and possibly to identify new trajectories or development pathways (Le Bars, 2003).
The principal objective of MIROT model was to simulate the dynamics of carbon at the village territory scale. The various scenarios were selected to understand the effect of the human actions on the carbon cycle and the sensitiveness of human behaviour to environmental change. Human actions are driven by the satisfaction of food and money needs that are positive functions of the population size. Briefly, three sets of scenarios were explored (
Table 1): (1) population density as a driver of farmers’ activities and carbon storage, (2) cash need and its influence on the global behaviour of the system, and (3) climatic change (as expressed by rainfall variation) and its impact on the viability of the system. In each scenario natives and migrants have similar population distribution at the beginning of simulations: 10 natives and 10 migrants. In economic and climatic scenarios, the growth rate is 5% per year.
Table 1: Scenario description
Scenario set Scenario code Parameters (annual values)
Demographic Population growth rate (in %)
D1 2.5 D2 5 D2 10
Economic Monetary need (in euros)
E1 50 E2 100 E3 200
Climatic Rainfall annual variation (in %)
C1 +10
C2 - 10
6.1. D
EMOGRAPHIC SCENARIOS
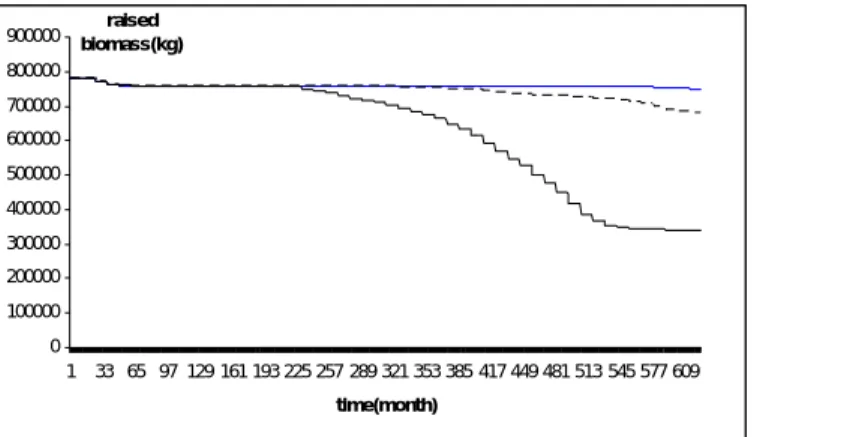
Population growth rate has a strong impact on both population size and total amount of above-ground tree (AGT) biomass (Figure 10; Figure 11). Results suggest that increased population increases pressure on resources such as AGT biomass. Collapse of these resources in turn limit carrying capacity of the territory and thus lead to population decline after departure from the village.
0 2000 4000 6000 8000 10000 12000 14000 1 33 65 97 129 161 193 225 257 289 321 353 385 417 449 481 513 545 577 609 time(month) population Annual population growth D1: 2.5% D2 : 5% D3 : 10%
0 100000 200000 300000 400000 500000 600000 700000 800000 900000 1 33 65 97 129 161 193 225 257 289 321 353 385 417 449 481 513 545 577 609 time(month) raised
biomass(kg) Annual population
growth D1: 2.5% D2 : 5% D3 : 10%
Figure 11 Evolution of the amount of above-ground tree biomass of the village territory under three demographic scenarios
When growth rate is set to 2.5 % the area converted to cropping increases slowly between 120 and 620 months (Figure 12). When it is set to 10% the village is saturated after 620 months with simulation. Although there is a similar proportion of migrants and natives at the beginning of simulation. After, the surface occupied by the natives increases faster than that of the migrants. A reason for this is that soil impoverishment by yam is faster than by cereal and cotton, which requires larger clearing of uncropped land. cotton Population growth rate forest Treeless plot Sorghum Maize yam
6.2. E
CONOMIC SCENARIOS
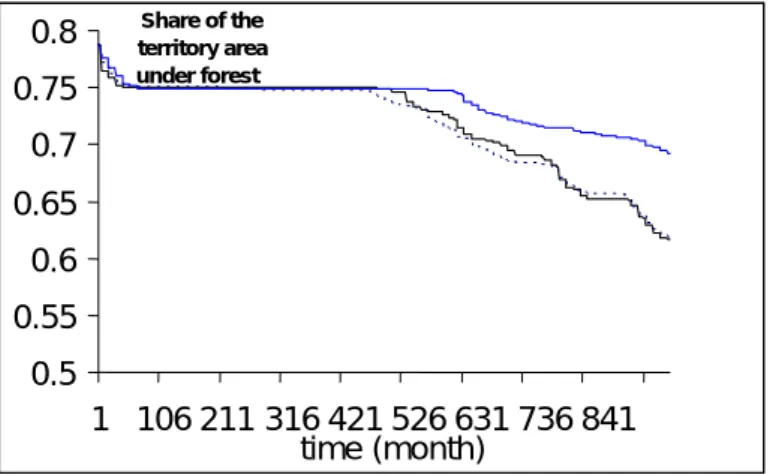
Drop in carbon resource and forest cover is increased when cash need increases (Figure 13; Figure 14); a threshold effect can be evidenced round 100 € inhab-1 y-1 since the E2 and E3 scenarios do not differ
much in their effects. Increasing monetary need increases the need for cropped land, leading to higher deforestation rates. And since above-ground tree biomass is a major pool of carbon, increasing monetary need exhausts carbon storage.
Share of the
Figure 13: Evolution of the share of the territory under forest under three economic scenarios
1010000 1020000 1030000 1040000 1050000 1060000 1070000 1080000 1090000 1100000 1110000 1 75 149 223 297 371 445 519 593 667 741 815 889 time (month) total carbon (t)
Figure 14: Evolution of the amount in total carbon of the territory under three economic scenarios
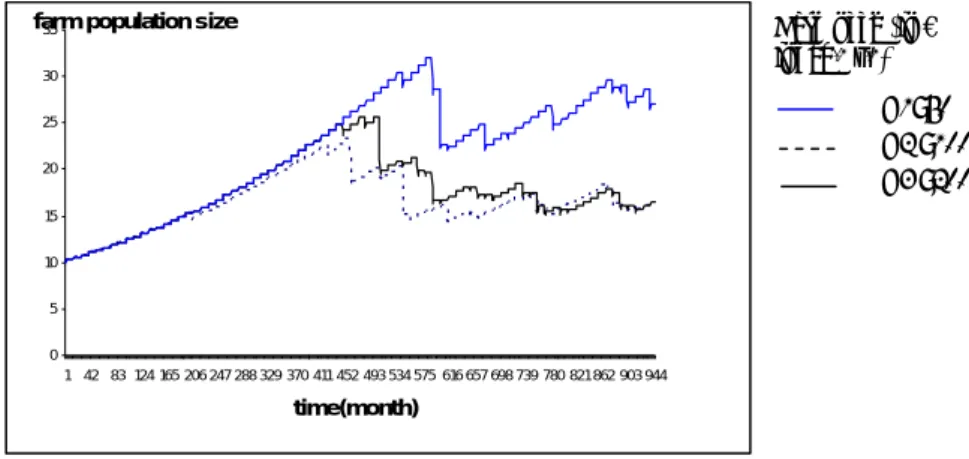
Additionally, the lower the monetary need, the larger the average farm population size beyond 450 months of simulation (Figure 15). The average is 35 persons after 575 steps (months) in scenario E1 (50 €). In scenario E2 (100 €), the maximum (26) is reached after 470 months. Again scenario E3 has little impact on population size as compared to E2. A reason for these trends is that high monetary need increases cropping intensity, decreases soil fertility and reduces the farm carrying capacity in human beings. As a result the farm splits and some of the household moves to another location to found a new farm.
0.5 0.55 0.6 0.65 0.7 0.75 0.8 1 106 211 316 421 526 631 736 841 time (month) territory area under forest
Cash need (in € inhab-1 y-1)
E1: 50 E2 : 100 E3 : 200
Cash need (in € inhab-1 y-1)
E1: 50 E2 : 100 E3 : 200
0 5 10 15 20 25 30 35 1 42 83 124 165 206 247 288 329 370 411 452 493 534 575 616 657 698 739 780 821862 903 944 farm population size
time(month)
Cash need (in € inhab-1 y-1)
E1: 50 E2 : 100 E3 : 200
Figure 15: Evolution of the average farm population size under three economic scenarios
6.3. C
LIMATIC SCENARIOS
Cultivated land increases and carbon resources decrease when rainfall increases (Figure 16; Figure 17). Lower rainfall hinders crop performances. Consequently, larger areas are needed to satisfy farmers’ needs for food and money.
940000 960000 980000 1000000 1020000 1040000 1060000 1080000 1100000 1120000 1 42 83 124 165 206 247 288 329 370 411 452 493 534 575 616 657 698 739 780 Time (month) C (t) Rainfall variation (in % y-1) C1: +10 C2 : -10
Figure 16: Evolution of amount in total carbon of the territory under two climatic scenarios
0 0.1 0.2 0.3 0.4 0.5 0.6 0.7 0.8 0.9 1 1 44 87 130 173 216 259 302 345 388 431 474 517 560 603 646 689 732 775 Temps (mois) Share of the territory area under cropping Rainfall variation (in % y-1) C1: +10 C2 : -10
Figure 17: Evolution of the share of the territory under cropping under two climatic scenarios
gradually until they disappear in scenario C2 (Figure 19). Maize is the dominant crop in scenario C1. Rainfall decrease (scenario C2) favours cereal expansion, with clear benefit to sorghum that even competes with maize. Such results can be interpreted by the general drop in crop performance. The yam requires more fertility and it is gradually abandoned because there are not sufficiently fertile plots for its cropping.
Explanation: The yam is less resistant to climatic precariousness; it is abandoned with the profit of maize-growing and sorghum-growing. To compensate for the reduction of yam-growing, the farmers cultivate more maize and sorghum.
0 0.2 0.4 0.6 0.8 1 1.2 1 4 7 10 13 16 19 22 25 28 31 34 37 40 43 46 49 52 time (month) Share of cropped area Cotton Yam Maize Sorghum
Figure 18: Evolution of crop distribution under scenario C1 (rainfall increase)
0 0.2 0.4 0.6 0.8 1 1.2 1 4 7 10 13 16 19 22 25 28 31 34 37 40 43 46 49 52 time (month) Share of cropped area
Figure 19: Evolution of crop distribution under scenario C2 (rainfall decrease)
7.1. M
ODEL STRENGTH
Organization is a fundamental property of a complex system. However the levels of organization of a system are multiple and require to be integrated in the model. The MIROT model integrates several levels of organization: (1) environment is represented at three scales (plot, farm and village territory), and (2) four levels of representation of social organisation (farmer, ethnic group, production system and village community) are proposed. Agent-Group-Role (AGR) formalism used in this last case improved expressivity and modularity of the system. The using of AGR constitutes a first step for the installation of a dynamic and evolutionary organization. Moreover, the model was coupled with a GIS. This interfacing allowed an explicit representation of the environment, and the taking into account of the physical, biological and human drivers of environmental features and spatial constraints put on individual behaviour. The spatial behaviour of cattle (straying trajectory) was also represented in the model. By coupling the MIROT model with an economic model, a first representation of economic motivations was carried out. This coupling also made it possible to take into account the constraints related to the availability of the resources such as equipment, labour available, the cash resources, etc.
7.2. S
OME MODEL LIMITATIONS
MIROT has some limitations. A real ecosystem involves many entities and complex interactions. Representing a set of various ecosystems interacting with each other according to biophysical and socio-economic drivers would be almost impossible in a single model. A model is a simplification of reality. Finding the right level of abstraction is thus needed to allow its sound analysis and avoid building a complex tool with behaviour and outputs impossible to control and understand. MIROT does not escape this rule. For instance:
- only two farming systems were selected among the many ones existing in Touroukoro,
- the tenurial market was not simulated due to lack of information about trading practices that are still considered as illegal,
- the fertility is represented by a discrete scales of points of fertility. It varies according to the use of the plot (increase in the event of fallow and reduction in the event of setting in crop). In reality, the fertility of a plot is subjected to several factors which unfortunately we do not lay out.
7.3. C
OUPLING
MAS
AND MATHEMATICAL PROGRAMMING
This study illustrates the interest of MAS for the representation of the complex systems. Whatever its advantages multi-agents modelling is not the unique solution to any modelling problem. Other types of modelling exist; just like MAS, their use depends on the user’s objective. Mathematical programming is another more conventional technique for the bioeconomic representation of the dynamic of a farm or even of a community "the behaviour of the actors [ y ] is generally simulated by an algorithm of maximization of a function of utility under constraint of plot, work, capital, food and monetary risk" (Barbier, 1998). In semi-marketed agricultures these models simulate the behaviour of a farmer who would maximize his monetary income after the food needs of the family, and having a reasonable knowledge of the local and regional context technico-economic necessary to the realization of this optimization. The study suggests that these two approaches can be complementary even if they meet apparently divergent aims. Individual modelling is a more realistic but complex representation generating a behaviour more difficult to interpret. The mathematical programming is unaware of part of the complexity of the decision-making process of the farmer but more easily makes it possible to analyze and interpret the various technico-economic scenarios.
7.4. D
EALING WITH THE COMPLEXITY OF THE SYSTEM
approximately 310 farms. A farmer can manage one farm. In consequence, the model controls 310 farmers if the territory is saturated. Supposing each farmer raises cattle, 310 herds or 620 active agents (farmers and herds) evolve in parallel. Each active agent has a thread and resource consumption is important. Heavy computation resource consumption reduces the performance of the system. In addition, the Gams execution by the agents decreases the performance of the system.
8. CONCLUSION AND PERSPECTIVES
The MIROT prototype can simulate the carbon dynamics at the village territory level. It integrates the major aspects of carbon dynamic: biological, physical and socio-economic factors. The model provides several types of output for a relevant analysis of the studied system. These outputs can be subdivided in three categories: (1) biological data (biomass and carbon, nitrogen, etc.) (2) demographic variables (population, density, etc.) and (3) economic performance indicators. Moreover, it is possible to define outputs for each production system (native and migrant). Simulations carried out made it possible to analyze the impact of the demographic pressure, the economic situation and the climatic change on the dynamics of the system.
Understanding and managing a complex system is highly dependant on the articulation of at least two levels of description: local (the components of the system), global (the collective behaviour which results from it). In a natural system, these various levels are indivisible (Duboz et al., 2003), but they require consideration for a better understanding of the dynamics of the ecosystem. Concerning the resource management, the articulation between the options at the global level (regulation, taxes and subsidies) and impact on individual behaviours and what can result, is not clear and again requires articulation between different levels of description. Further effort will focus on the articulation between different levels of organisation within the issue of carbon dynamic. Additionally the genericity of MIROT will be worked out to develop a model able to simulate the dynamics of carbon resources of contrasted territories of West-African savannas.
BIBLIOGRAPHY
Abrami G., 2004. Niveaux d'organisation dans la modélisation multi-agent pour la gestion de ressource renouvelables: Application à la mise en oeuvre de règles collectives de gestion de l'eau agricole dans la basse-vallée de la Drôme. Phd thesis, Ecole Nationale de Génie Rural et des Forêts, France, 401 p.
Amiguet M., 2003. MOCA : Un modèle componentiel dynamique pour les systèmes multi-agents organisationnels, Université de Neuchâtel,. Suisse.
Axtell R., 2000. Why agents? On the varied motivations for agent computing in the social sciences. Center for Social and Economic Dynamics, . (Working Paper No. 17). Barbier B., 1998. Induced innovation and land degradation: results from a bioeconomic
model of a village in West Africa. Agricultural Economics 1335 (1-2), 1-11.
Barreteau O., Bousquet F., Millier C., Weber J., 2004. Suitability of Multi-Agent simulations to study irrigated system viability: application to case studies in the Senegal River Valley. Agricultural Systems 80 (3), 255-275.
Bonkougou D.Y., 2004. Déterminants socio-économique de la gestion des ressources en carbone par les exploitants dans le terroir de Torokoro. Province de la Comoé (Burkina Faso). Institut de Développement Rural (Université Polytechnique de Bobo-Dioulasso), Burkina Faso.
Bonnefoy J.-L., Le Page C., Rouchier J., Bousquet F., 2000. Modelling spatial practices and social representations of space using multi-agents. In: Ballot G., Weisbuch G. (Eds.), Application of simulation to social science. Hermès, Paris, pp. 155-168. Bonnefoy J.-L., Bousquet F., Rouchier J., 2001. Modélisation d'une interaction individus,
espace et société par les systèmes multi-agents: pâture en forêt virtuelle. Espace Géographique 1, 13-25.
Bousquet F., Bakam H., Proton H., Le Page C., 1998. Cormas : Common-pool resources and multi-agents systems. Lecture Notes in Artificial Intelligence 1416, 826-837. Bousquet F., Le Page C., 2004. Multi-agent simulations and ecosystem management : a
review. Ecological Modelling, 313-332.
Defoer T., de Groote H., Hilhorst T., Kanté S., Budelman A., 1998. Participatory action research and quantitative analysis for nutrient management in southern Mali. A fruitful marriage? Agriculture Ecosystems & Environment 71 (1-3), 215-228. Drogoul A., Ferber J., Cambier C., 1992. Multi-agent Simulation as a Tool for Analysing
Emergent Processes in Societies.
Duboz R., Ramat E., Preux P., 2003. Scale transfert modeling: Using Emergent computation for coupling an ordinary differential equation system with a reactive agent model. Systems Analysis Modeling Simulation 43 (6), 793-814.
Dumont B., Hill D.R.C., 2001. Multi-agent simulation of group foraging in sheep: effects of spatial memory, conspecific attraction and plot size. Ecological Modelling 141 (1-3), 201-215.
Ferber J., Gutknecht O., 1998. A meta-model fro the analysis and design of organisation in multi-agents. In: press I.C.S. (Ed.) Proceedins of Third international Conference on Multi-Agent Systems (ICMAS'98), Paris, 3-4 juillet 1998, pp. 128-135.
Herve D., Genin D., Migueis J., 2002. A modelling approach for analysis of agro pastoral activity at the one-farm level. Agricultural Systems 71 (3), 187-206.
Hilaire V., 2000. Vers une approche de spécification, de prototypage et de vérification de systèmes multi-agents. Informatique, Université de Franche-Comté préparée au sein de l’ Université de Technologie de Belfort-Montbéliard, Franche-Comté, 221 p. Jennings N.R., 2000. On agent-based software engineering. Artificial Intelligence Journal,
. 177 :277–296.
Ker A., 1995. Farming Systems in the African Savanna. A Continent in Crisis. International Development Research Centre (IDRC), Ottawa, 176 p.
Landais E., Guérin H., 1993. Système d'élevage et transferts de fertilité dans la zone des savanes africaines. Cahiers Agricultures 2s, 9-25.
Le Bars M., 2003. Un simulateur Multi-Agent pour l'Aide à la Décion d'un Collectif Application à la gestion d'une ressource limitée Agro-environnementale. Spécialité
Informatique, Paris Dauphine, France, 234 p.
Lion M., 2005. La modélisation comme outil d’aide à la gestion: Le cas de la colonisation forestière des pelouses sommitales du mont Lozère (Cévennes, France). In: Colloque SMAGET,Modèles et systèmes Multi-Agents pour la Gestion de l’Environnement et des Territoires, Saint-Maurice Les Arcs, France, p. 12.
Manlay R.J., Ickowicz A., Masse D., Feller C., Richard D., 2004a. Spatial carbon, nitrogen and phosphorus budget in a village of the West African savana-II. Element flows and functioning of a mixed-farming system. Agricultural Systems 79 (1), 83-107.
Manlay R.J., Masse D., Chevallier T., Russell-Smith A., Friot D., Feller C., 2004b. Post-fallow decomposition of woody roots in the West African savanna. Plant and Soil 260 (1-2), 123-136.
Manlay R.J., Ickowicz A., Masse D., Floret C., Richard D., Feller C., 2004c. Spatial carbon, nitrogen and phosphorus budget of a village in the West African savanna - I.
Element pools and structure of a mixed-farming system. Agricultural Systems 79 (1), 55-81.
Müller J.P., 2004. Emergence of collective behaviour and problem solving. In: Omicini A., Petta P., Pitt J. (Eds.), Engineering Societies in the Agents World: 4th International Workshops. October 29-31, 2003, London, UK. Springer-Verlag GmbH, pp. 1 - 21. Reenberg A., 1996. A hierarchical approach to land use and sustainable agricultural
systems in the Sahel. Quaterly Journal of International Agriculture 1, 63-77. Servat D., Perrier E., Treuil J.-P., Drogoul A., 1998. When agents emerge from agents: an
introducing multi-scale Viewpoints in Multi-Agents Simulation. Multi-Agent Systems and Agent-Based Simulation. Springer-Verlag, Berlin, 183–198 p.
Stephenne N., Lambin E.F., 2001. A dynamic simulation model of land-use changes in Sudano-sahelian countries of Africa (SALU). Agriculture Ecosystems & Environment 85 (1-3), 145-161.
Thornton P.K., Herrero M., 2001. Integrated crop-livestock simulation models for scenario analysis and impact assessment. Agricultural Systems 70 (2-3), 581-602.
Tranouez P., 2005. Contribution à la modélisation et à la prise en compte informatique de niveaux de descriptions multiples. Application aux écosystèmes aquatiques.
Informatique, Université du Havre, Havre, France, 192 p.
Tschakert P., 2004. The costs of soil carbon sequestration: an economic analysis for small-scale farming systems in Senegal. Agricultural Systems 81, 227–253.
UNFCCC, 1997. Protocole de Kyoto à la Convention-Cadre des Nations Unies sur les Changements Climatiques.
Vincent R., Horling B., Lesser V., 2001. An Agent Infrastructure to Build and Evaluate Multi-agent Systems : The Java Agent Framework and Multi-agent System Simulator. Lecture Notes in Computer Science: Infrastructure for Agents, Multi-Agent Systems, and Scalable Multi-Multi-Agent Systems,, Vol. 1887. Springer, 102-127. p. Youl S., 2003. Dynamique du carbone d'un terroir de savane d'Afrique de l'ouest :Approche