HAL Id: hal-01302628
https://hal.archives-ouvertes.fr/hal-01302628
Submitted on 14 Apr 2016
HAL is a multi-disciplinary open access
archive for the deposit and dissemination of
sci-entific research documents, whether they are
pub-lished or not. The documents may come from
teaching and research institutions in France or
abroad, or from public or private research centers.
L’archive ouverte pluridisciplinaire HAL, est
destinée au dépôt et à la diffusion de documents
scientifiques de niveau recherche, publiés ou non,
émanant des établissements d’enseignement et de
recherche français ou étrangers, des laboratoires
publics ou privés.
Parameter Estimation of a Mathematical Model
Describing the Cardiovascular-Respiratory Interaction
Layli Goldoozian, Antonio Hidalgo-Muñoz, Vicente Zarzoso, Edmond Zahedi
To cite this version:
Layli Goldoozian, Antonio Hidalgo-Muñoz, Vicente Zarzoso, Edmond Zahedi. Parameter Estimation
of a Mathematical Model Describing the Cardiovascular-Respiratory Interaction. Computing in
Cardi-ology, 42nd Annual Conference, Sep 2015, Nice, France. �10.1109/CIC.2015.7410986�. �hal-01302628�
Parameter Estimation of a Mathematical Model Describing the
Cardiovascular-Respiratory Interaction
Layli S. Goldoozian
1, Antonio R. Hidalgo-Mu˜noz
2, Vicente Zarzoso
2, Edmond Zahedi
1,31
School of Electrical Engineering, Sharif University of Technology, Tehran, Iran
2Laboratoire I3S, Universit´e Nice Sophia Antipolis, CNRS, France
3
Department of Electronics, Electrical & System Engineering, Faculty of Engineering and built-in
Environment, National University Malaysia (Universiti Kebangsaan Malaysia)
Abstract
Short-term interaction between heart rate (HR) and physiological measures like blood pressure and respira-tion reveals relevant informarespira-tion about autonomic ner-vous system (ANS) function. Complex mathematical mod-els for describing their couplings have been proposed in the literature. However, an accurate estimation of their parameters in an inverse modeling problem is crucial to extract reliable ANS related indices. This study consid-ers a physiologically-based model of the cardiovascular-respiratory system and ANS control that presents the neu-ral and mechanical effects of respiration separately. The estimation method is evaluated on synthetic signals. An accurate estimation of the highest-sensitivity model pa-rameter (intrinsic HR) is achieved with an error of 4.7±
3.4% over the actual values. One of the parameters
reflect-ing the amplitude of the respiratory-mediated variations presents an even better approximation with a mean rela-tive error as low as 3.8±3.3%. Our results show that most of the high-sensitivity parameters and also respiratory-related parameters that are specifically considered in our physiologically-based framework can be well approxi-mated regardless of their initial values.
1.
Introduction
Cardiovascular regulation over short time scales (of sec-onds to minutes) is one of the most important functions of the autonomic nervous system (ANS) that is mediated via parasympathetic and sympathetic nerves [1]. Therefore, short-term variations in some cardiovascular measures like heart rate (HR) and blood pressure (BP) are commonly
L. Goldzoozian is in part supported by a grant from the Embassy of France in Tehran.
A. Hidalgo is in part supported by a Postdoctoral Fellowship from the University of Nice Sophia Antipolis.
V. Zarzoso is a member of the Institut Universitaire de France.
studied to assess ANS function. In practice, an external stimulation perturbing ANS, e.g., sit-to-stand or respira-tory maneuvers, is applied and ANS-related indices are extracted from the BP or HR (or their relative change). Al-though there are some clinical methods for the evaluation of ANS [2], there is still the need to assess its function in an online and reliable way.
Respiration causes fluctuations in cardiovascular param-eters like HR and BP through both ANS and mechanical paths [3]. HR variability due to respiration is known as respiratory sinus arrhythmia (RSA), and its analysis is used for assessing autonomic health. Some studies have consid-ered complex models to explain the joint relation between the cardiovascular signals and respiration [4, 5]. How-ever, estimating such model parameters reliably is of great importance so that they may be applied as time-varying biomarkers of ANS function [6].
The present work is based on a joint model of the cardiovascular-respiratory system and ANS control to sim-ulate the short-term relations between HR, BP and respira-tion [7]. The efficiency of the parameter estimarespira-tion method is specifically studied here. Inverse modeling is done in two steps. Firstly, a sensitivity analysis is performed to define the most significant parameters of the model. Sec-ondly, the parameters are estimated using well-known opti-mization algorithms (Nelder-Mead). Finally, the accuracy of the parameter estimation method is assessed on synthet-ically generated data.
2.
Modelling
2.1.
Cardiovascular-baroreflex interaction
A 2-element Windkessel model consisting of the total arterial resistance and arterial compliance has been con-sidered for the cardiovascular system [8]:
˙ P (t) =−P (t) RcCa +H(t)∆V Ca (1)
where H(t) is the instantaneous HR, P (t) the mean BP,
Rcand Ca the total arterial resistance and compliance
re-spectively, and ∆V the stroke volume.
The baroreflex system, as an important part of the ANS, aims at maintaining BP in a narrow physiological range. BP is sensed by the baroreceptors which transmit afferent signals to the brain. The brain sends some efferent sig-nals back to the cardiovascular parts via sympathetic and parasympathetic nerves where BP regulation is done by ad-justing some physiological parameters like HR, ventricu-lar contractility, arterial resistance and systematic venous unstressed volume. The models considered for baroreflex control of HR and arterial resistance [8], are given respec-tively by: ˙ H(t) = βHTs 1 + γTp − V HTp+ δH ( H0− H(t) ) (2) Rc= R0c(1 + αTs) (3)
where Tpand Tsare the parasympathetic and sympathetic
tones respectively which can be modeled as sigmoidal functions of pressure: Ts(t) = 1 1 +(P (t− τ)/P0 )r (4) Tp(t) = 1− 1 1 +(P (t)/P0 )r (5)
The definitions and nominal values [8] of the parameters in eqns. (1)-(5) are presented in Table 1.
Table 1. Model parameter definitions and nominal values [8]
Parameter Description Value
Ca arterial compliance 50 ml.mm.Hg−1 R0
c min arterial resistance 0.6 mmHg.s.ml−1 βH sympathetic control of HR 0.84 s−2
γ vagal damping of βH 0.2 VH vagal control of HR 1.17 s−2 δH inverse relaxation time 1.7 s−1 H0 uncontrolled HR 100 bps
∆V stroke volume 50 ml
τ sympathetic delay 3 s
α sympathetic effect on Rc 1.3 P0 mean arterial pressure 93 mmHg
2.2.
Respiratory effects
As mentioned, respiration affects cardiovascular system through mechanical and neural paths. HR increases and decreases during inspiration and expiration respectively. A direct neural coupling exists between respiratory sys-tem and heart. This neural mechanism affects HR mostly via respiratory related variations in the power (VH) of the
parasympathetic tone (Tp) [9]. Therefore, eqn. (2) is
mod-ified as below: ˙ H(t) = βHTs 1+γTp −(VH− k1VL(t) ) Tp+δH ( H0−H(t) ) (6) where VL(t) is the instantaneous lung volume and k1is the factor of lung volume in modulating VH.
The mechanical effect of respiration on the cardiovascu-lar system should be reflected in the model by respiratory modulated changes in the stroke volume, which itself hap-pens as a result of respiratory-synchronous variations in the intra-thoracic pressure [7, 9]. This effect is incorpo-rated in eqn. (1) as:
˙ P (t) =−P (t) RcCa +H(t) ( ∆V − k2VL(t) ) Ca (7) where the coefficient k2is intended to adjust the effect of
VLin modulating the stroke volume.
As can be perceived from eqn. (7), modulation of ∆V by respiration leads to respiratory-related variations in the pressure. Consequently, in addition to the direct neural path, HR is also indirectly modulated by the respiration via the link between HR and BP (baroreflex control). Remark that parameters k1and k2in eqns. (6)-(7) are related to the gains of the respiratory-related variations of the outputs.
3.
Inverse modeling
3.1.
Sensitivity analysis
Prior to the estimation of the model parameters, it is es-sential to define the parameters to which the model out-puts have higher sensitivity. Sensitive parameters are in-deed those whose variations cause significant changes in the outputs [6]. The sensitivity analysis was carried out at nominal parameter values.The instantaneous normalized sensitivity of each of the outputs (in our case, HR or pres-sure in eqns. (6) and (7) respectively) to the i-th parameter
θiat time instant t is calculated as:
Sn,i(t) = ∂yn(t, θ) ∂θi θi yn θi=θi0 (8) where θi0denotes the nominal value of parameter θi and
y stands for the model output; the subscript n refers to
either HR or BP. The total sensitivity index of the model to θiis defined as the scaled 2-norm of the instantaneous
sensitivity over the two outputs:
Si= √ 1 2m ∑ n,t S2 n,i(t) (9)
where m is the number of time samples over which the sensitivity is calculated for each output. Parameter values are split into high-sensitivity and low-sensitivity groups according to their total sensitivity values Si.
3.2.
Parameter estimation
Having defined the sensitivity of the model to the pa-rameters, the parameters of the high-sensitivity group are estimated in the model identification process while fixing the value of the other parameters at their nominal values (Table 1). The parameter identification was carried out in two steps. Firstly, all high-sensitivity parameters were es-timated such as to minimize the normalized mean squared error between the model outputs and the data.
At the second step, the respiratory-related parameters k1 and k2were estimated while fixing the values of the other parameters at their estimated values obtained from the first step or at their nominal values for the low-sensitivity pa-rameters. Oscillations at respiratory rate range are often re-ferred to as high-frequency oscillations. Since respiration is only expected to introduce high-frequency fluctuations in the model outputs, the cost function to be minimized at this step was the normalized mean squared error between the instantaneous amplitude of the model outputs and the actual data: E = 1 2m ∑ n,t (
Ampmon (t)− Ampsynn (t)
Ampsynn (t)
)2
(10)
where Amp(t) is the amplitude, and superscripts ’mo’ and ’syn’ stand for the model output and actual (synthesized) data, respectively.
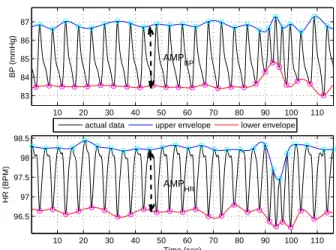
To assess the amplitude signals, a peak detection algo-rithm was applied on the BP or HR signals to find their maxima and minima at each respiratory cycle. The upper and lower envelopes of the signals were defined by spline interpolation, which converts the detected extremum series into evenly spaced signals (Fig. 1). The difference of the upper and lower envelopes was calculated as for the instan-taneous amplitude signal.
For both of the parameter identification steps, the Nelder-Mead algorithm (a gradient-free method) in the MATLAB Optimization Toolbox was used to optimize the parameters [10]. The accuracy of the estimation for each parameter was defined as the percent error between the ac-tual and the estimated values of the parameter averaged over 100 trials.
3.3.
Evaluation
The accuracy of the parameter identification method was assessed on the synthesized data. One hundred data segments of 30-second length were generated by random perturbations of the model parameters of up to 30% of their nominal values. The model outputs were sampled at a fre-quency of 5 Hz. As instantaneous respiratory signal VL(t),
which is an input to the model, we employed a recorded respiratory signal obtained from a MIMIC dataset [11].
4.
Results
4.1.
Sensitivity analysis
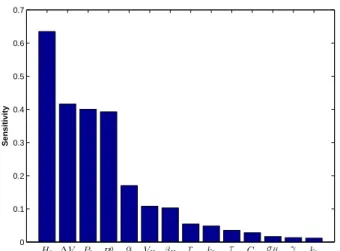
The result of the sensitivity analysis for the model is shown in Fig. 2. Parameters {H0, ∆V, P0, R0c, α} yield
the highest sensitivity index values, and are thus classified in the high-sensitivity group, while the rest are considered as low-sensitivity.
4.2.
Parameter estimation and evaluation
The estimation error for the high-sensitivity parameters determined in the first step is presented in Table 2. Also given are the estimation error of respiratory-related pa-rameters k1 and k2 when estimated along with the high-sensitivity parameters (“s1”) and when computed at the second step (“s2”) as described in Sec. 3.2.
Table 2. Parameter estimation errors
Parameter Error Parameter Error ( High-sensitivity) (M ean± SD)% ( Respiratory-related) (M ean± SD)% H0 4.7±3.4 k1 14.21±12(s1) ∆V 9.6±7.5 10±9.3 (s2) P0 8.7±7.2 R0 c 9.6±6.3 k2 8.6±5.8 (s1) α 13.7±11.5 3.8±3.3 (s2)
s1: step one, s2: step 2 of parameter estimation
10 20 30 40 50 60 70 80 90 100 110 83 84 85 86 87 BP (mmHg)
actual data upper envelope lower envelope
10 20 30 40 50 60 70 80 90 100 110 96.5 97 97.5 98 98.5 HR (BPM) Time (sec) AMPBP AMPHR
Figure 1. Extracting the upper and lower envelopes of the model outputs, giving rise to the amplitude signals
Ampmon (t) employed in eqn. (10) for the estimation of
respiratory-related parameters. Top: BP signal. Bottom: HR signal. The synthesized data amplitudes Ampsyn
n (t)
0 0.1 0.2 0.3 0.4 0.5 0.6 0.7 Sensitivity H0 ∆V P0 R0c α VH βH r k2 τ Ca σH γ k1
Figure 2. Sensitivity analysis of the model parameters.
5.
Discussion
Our work has determined the most sensitive parameters in our cardiorespiratory-ANS model and the influence of respiratory-related parameters on the high-frequency oscil-lations of the model outputs. Parameter estimation results (Table 2) reveal that parameter H0(intrinsic HR), the most sensitive according to the analysis of Fig. 2, can be es-timated with a low error of 4.7±3.4%. Furthermore, the estimation error for most of the other high-sensitivity pa-rameters is relatively low and comparable to the literature. According to the sensitivity analysis (Fig. 2), the parame-ters{VH, βH, r, τ, Ca, σH, γ, k1, k2} were classified in the low-sensitivity group. This low-sensitivity group includes parameters k1and k2, the gains of the control paths of res-piration on the cardiovascular model. As we are specifi-cally interested in the respiratory mediated control of ANS, it is of much importance to estimate these two parameters reliably. The low sensitivity of these respiratory-related parameters causes significant estimation inaccuracies. To compensate for this shortcoming, the second step of pa-rameter estimation was carried out. As reported in Table 2, the estimation errors improve considerably in the sec-ond step, especially for parameter k2(error of 3.8± 3.3% vs. 8.6± 5.8%) in the second step. This is due to the dif-ferent cost function considered in this step, where the op-timization algorithm aims at minimizing the mean squared error between the amplitude of high-frequency (respiratory rate range) oscillations of the model outputs and the data [eqn. (10)]. This cost function was chosen regarding the actual effects of these two parameters which impact the high-frequency components of the outputs more signifi-cantly than the low-frequency one, i.e., the high-frequency terms of the signals are more sensitive to these two param-eters.
In conclusion, our results show that most model parame-ters including the respiratory-related ones can be estimated
with low error in the framework of our physiologically-based model. Further work should consider the applica-tion of our parameter estimaapplica-tion method to assess reliable online ANS indices in real data.
References
[1] Xiao X, Mullen TJ, Mukkamala R. System identification: a multi-signal approach for probing neural cardiovascular regulation. Physiological measurement 2005;26(3):R41. [2] Low PA. Testing the autonomic nervous system. Seminars
in neurology 2003;23(4):407–421.
[3] Berntson GG, Cacioppo JT, Quigley KS. Respiratory sinus arrhythmia: autonomic origins, physiological mechanisms, and psychophysiological implications. Psychophysiology 1993;30(2):183–196.
[4] Mullen TJ, Appel ML, Mukkamala R, Mathias JM, Co-hen RJ. System identification of closed-loop cardiovascular control: effects of posture and autonomic blockade. Amer-ican Journal of Physiology Heart and Circulatory Physiol-ogy 1997;272(1):H448–H461.
[5] Lu K, Clark J, Ghorbel F, Ware D, Bidani A. A human car-diopulmonary system model applied to the analysis of the valsalva maneuver. American Journal of Physiology Heart and Circulatory Physiology 2001;281(6):H2661–H2679. [6] Ottesen JT, Novak V, Olufsen MS. Development of
pa-tient specific cardiovascular models predicting dynamics in response to orthostatic stress challenges. In Mathemati-cal Modeling and Validation in Physiology. Springer, 2013; 177–213.
[7] Goldoozian LS, Zahedi E. Mathematical modeling of heart rate and blood pressure variations due to changes in breath-ing pattern. In 20th Iranian Conference on Biomedical En-gineering (ICBME). IEEE, 2013; 54–58.
[8] Fowler A, McGuinness M. A delay recruitment model of the cardiovascular control system. Journal of Mathematical Biology 2005;51(5):508–526.
[9] Ataee P, Belingard L, Dumont G, Noubari HA, Boyce WT, et al. Autonomic-cardiorespiratory regulation: A physiology-based mathematical model. In Annual Interna-tional Conference of the IEEE Engineering in Medicine and Biology Society (EMBC. IEEE, 2012; 3805–3808. [10] MATLAB Optimization Toolbox Users Guide. MathWorks,
Natick, MA, USA, 2013.
[11] Goldberger AL, Amaral LA, Glass L, Hausdorff JM, Ivanov PC, Mark RG, Mietus JE, Moody GB, Peng CK, Stanley HE. Physiobank, physiotoolkit, and physionet components of a new research resource for complex physiologic signals. Circulation 2000;101(23):e215–e220.
Address for correspondence: Layli Goldoozian
BME Laboratory, Department of Electrical Engineering, Sharif University of Technology
Tehran, Iran
![Table 1. Model parameter definitions and nominal values [8]](https://thumb-eu.123doks.com/thumbv2/123doknet/13425528.408309/3.918.97.438.717.894/table-model-parameter-definitions-and-nominal-values.webp)