HAL Id: hal-01299757
https://hal.archives-ouvertes.fr/hal-01299757
Submitted on 8 Apr 2016
HAL is a multi-disciplinary open access
archive for the deposit and dissemination of
sci-entific research documents, whether they are
pub-lished or not. The documents may come from
teaching and research institutions in France or
abroad, or from public or private research centers.
L’archive ouverte pluridisciplinaire HAL, est
destinée au dépôt et à la diffusion de documents
scientifiques de niveau recherche, publiés ou non,
émanant des établissements d’enseignement et de
recherche français ou étrangers, des laboratoires
publics ou privés.
Product Standards and Margins of Trade: Firm-Level
Evidence Product Standards and Margins of Trade:
Firm-Level Evidence
Lionel Fontagné, Gianluca Orefice, Roberta Piermartini, Nadia Rocha
To cite this version:
Lionel Fontagné, Gianluca Orefice, Roberta Piermartini, Nadia Rocha. Product Standards and
Mar-gins of Trade: Firm-Level Evidence Product Standards and MarMar-gins of Trade: Firm-Level Evidence.
Journal of International Economics, Elsevier, 2015, 97 (1), pp.29-44. �10.1016/j.jinteco.2015.04.008�.
�hal-01299757�
Product Standards and Margins of Trade:
Firm-Level Evidence
Lionel Fontagn´e
∗Paris School of Economics – Universit´e Paris I and CEPII.
106-112 Bd de l’Hˆopital, F-75647 Paris Cedex 13.
Gianluca Orefice
†CEPII, 113 rue de Grenelle, F-75007 Paris.
Roberta Piermartini
‡ERSD, WTO, 54 rue de Lausanne, CH-1211 Geneva 21.
Nadia Rocha
§ERSD, WTO, 54 rue de Lausanne, CH-1211 Geneva 21.
Abstract
This paper considers the heterogenous trade effects of restrictive Sanitary and Phyto-Sanitary (SPS) measures on exporters of different sizes, and the channels via which aggregate exports fall: firm participation, export values and pricing strategies. We do so by matching a detailed panel of French firm exports to a new database of SPS regulatory measures that have been raised as of concern in the dedicated committees of the WTO. By using specific trade concerns to capture the restrictiveness of product standards, we focus only on standards that are perceived as trade barriers. We analyze their effects on three trade-related outcomes: (i) the probability to export and to exit the export market (the firm-product extensive margin), (ii) the value exported (the firm-product intensive margin), and (iii) export prices. We find that SPS concerns discourage the presence of exporters in SPS-imposing foreign markets. We also find a negative effect of SPS imposition on the intensive margins of trade. These negative effects SPS are attenuated in larger firms.
JEL classification: F12, F15.
Keywords: International trade, firm heterogeneity, multi-product exporters, non-tariff barriers.
∗email: lionel.fontagne@univ-paris1.fr – corresponding author. †email:gianluca.orefice@cepii.fr.
‡email: roberta.piermartini@wto.org. §email: nadia.rocha@wto.org.
Product Standards and Margins of Trade:
Firm-Level Evidence
1
Introduction
Regulatory measures addressing health, safety and environmental quality are social imperatives in any economy. Although these measures may legitimately address market failures and international spillovers, rather than simply shielding producers from import competition, they will also inevitably affect trade flows. Although not all product standards reduce trade,1 some act as a barrier to trade by increasing the cost of exporting. They may reduce the number of competitors in the market, the number of varieties available to the consumer, and may unevenly affect different-sized exporters. The challenge of international co-operation in this respect is not to remove product regu-lations, but to make them compatible with country specialization and respect the preservation of a level playing field for all competitors. To this end, it is essential that the trade effects of regulations, especially those that restrict trade, be understood and taken into account in designing cooperative policies. Recent work has highlighted that trade pol-icy may have differential effects on firms depending on their size. To the extent that regulation differentially affects exporters of different sizes and productivity levels, standards will not only affect the variety of goods available to consumers, but also the degree of competition in the importing market. This complicates the assessment of the trade effects of regulatory policy changes on heterogenous exporters.
We focus on Sanitary and Phyto-Sanitary (SPS) measures, and analyze the trade impact of the subset of regulatory measures that have been raised as concerns in the SPS committee of the WTO (and can thus be considered as substantial barriers for exporters). Our research question is then not whether SPS measures reduce trade (which we expect given our sample), but how this trade effect – when present – transits through the different margins of trade in the presence of heterogeneous exporters. In particular, we explore whether such measures affect different-sized exporters differently. To this end, we consider the impact of restrictive SPS measures on individual firms’ export decisions (whether or not to export, and how much to export) and pricing behaviour in export markets.
Our paper is the first to evaluate the impact of regulatory standards on firm exports over a long time period (10 years), covering all HS-4 sectors and analyzing firms’ actual behavior. In contrast, most of the existing literature on non-tariff measures is based on aggregate trade flows, and as such does not shed any light on how firms’ specific patterns of trade are affected by standards and technical regulations.2 Whether and by how much restrictive SPS
1A regulation that addresses the problem of incomplete information on the attributes of credence goods may actually foster trade rather than
reduce it (this is the case, for example, for the regulation of pesticide contents).
measures affect trade margins and prices, in the presence of heterogeneous firms, is an empirical question. This is because the trade effects of policy changes predicted by theory depend on the particular type of trade cost (fixed, variable or additive) that the policy affects, and on the specific assumptions of the model.
The imposition of a standard (independently of the particular type of trade cost affected) negatively affects the extensive margin of trade. By way of contrast, the effect on the intensive margin is ambiguous. While standard CES models of heterogeneous firms predict an identical effect of higher trade costs on the intensive margin of trade for small and large firms,3a growing body of theoretical literature emphasizes how the impact of trade policy
depends on firm characteristics such as size and productivity.4These models relax some of the standard assumptions
ofMelitz(2003), such as a constant elasticity of substitution across varieties and exogenous trade costs. Spearot
(2013) allows demand elasticities to vary across varieties and shows that, for a broad class of demand systems, the traditional negative effect of higher trade costs on trade flows is amplified for low-revenue varieties (firms with a low value of exports prior to the new restrictive measure). This may even be reversed for high-revenue varieties (firms with large export revenues prior to the measure).5 Similarly, in an endogenous-costs model such asArkolakis
(2010), where firms pay an increasing marginal cost of marketing to reach more consumers and where the cost to reach a certain number of consumers falls with the size of the population in the export market, the exports of small firms fall more after the introduction of a restrictive trade measure than do those of firms with larger volumes of exports pre-measure.6 Finally, in the presence of additive trade costs, the demand elasticity falls in trade costs and rises in the producer price (Irarrazabal et al.,2013). Higher trade costs reduce the elasticity of trade to the producer price, and more so for low-price firms.
To sum up, on the basis of trade theory, we expect that the imposition of a restrictive SPS will have a negative effect on the extensive margin of trade, as small firms exit the market. We also predict that cost-enhancing SPS measures will have a stronger negative effect (if any) on the trade volumes of small firms than on those of large firms. Finally, we expect a positive impact of stringent SPS on mean prices.7
We use individual export data on French firms provided by French Customs, and find that SPS concerns negatively affect both the extensive and intensive trade margins. In our preferred specification, we estimate that restrictive
3Crozet et al.(2013) discusses the impact of ad valorem versus additive regulation-related trade costs on trade in services using different
theoretical frameworks.
4Although the heterogeneous-firm model with CES preferences helps to explain several stylized facts (e.g. not all firms export to all markets),
it fails to account for others: a large proportion of firms export a small amount of goods, and the ranking of firms entering export markets differs from that predicted on the basis of their productivity only (Eaton et al.,2011)
5Note that inSpearot(2013) not all firms necessarily gain from trade liberalization, as the aggregate effect includes an indirect competition
effect (competition becomes tougher when barriers to trade fall, which is potentially detrimental for high-revenue firms).
6A translog demand system exhibits the same property. That is, a tariff increase has a larger impact on lower-revenue varieties (Feenstra and
Weinstein,2010)
7In our paper, we test for a differential effect of higher SPS across firms by introducing an interaction between the SPS variable and firm size
into the regression. We expect the coefficient on this interaction term to be positive for the the extensive- and intensive-margin regressions, but have no clear predictions for the same coefficient in the price regression.
SPS measures that have triggered the exporting country to raise a concern at the WTO SPS-committee reduce the probability to export by 4 per cent. The mean effect of a restrictive SPS measure on the value of exports (the intensive margin) is approximately 18 per cent. Finally, in the presence of SPS concerns exporting firms increase the price of their exported goods by 6 to 9 per cent. We also find a heterogeneous effect of SPS across firms: the negative impact of restrictive SPS is reduced for larger players. In a further extensive-margin estimation, we test the effect of SPS concerns on the number of exporting firms in every product-destination-year cell: the presence of SPS concerns reduces the number of exporting firms by 8%.
The remainder of the paper is organized as follows. Section 2 describes the data and some stylized facts. Section 3 discusses our empirical strategy, and Section 4 presents the results. The final section concludes.
2
Data and Stylized facts
A number of pieces of work have attempted to quantify the effect of non-tariff measures on international trade. These results are however based on data that are outdated, refer to a selected sample, or barely touch on the heterogeneous effects of the measures on individual exporters. For example,Kee et al.(2009), using data on Non-Tariff Measures (NTMs) from TRAINS, estimate an average ad valorem equivalent for the core NTMs8of 12 per cent. However,
the NTMs data come from 2001 and have not been updated since. The number of products, importing countries and regulations render the collection of such data very costly. Furthermore, the TRAINS database only records whether a country has imposed an NTM, without indicating whether the measure is a barrier to trade or not. Other work relies on survey data. The International Trade Center (ITC, Geneva) is engaged in an effort to conduct surveys on exporters’ perceptions of obstacles to foreign-market access. However, although informative, these data are not a systematic record of all barriers. Similar concerns arise regarding work using the WTO notification database as a source for non-tariff barriers, as not all countries have the same propensity to notify their measures to the WTO. The picture of the NTMs in force in the notification database may then be biased.
Our analysis overcomes the data limitations in the previous literature by using two major databases: a recently-constructed database on specific trade concerns (STCs) and a database of French firm exports.
8The core NTMs consist of price-control measures, quantitative restrictions, monopolistic measures, anti-dumping and countervailing
2.1
The Specific Trade Concerns database
The recently-released WTO database on specific trade concerns records the concerns that have been raised in the dedicated committees of the WTO.9 In particular, we focus on the concerns raised in the SPS Committee.10 This committee provides WTO members with a forum to discuss issues related to SPS measures taken by other members. These issues are referred to as ”specific trade concerns” (STCs). When a country raises a concern at the SPS Com-mittee over a measure (whether draft or in force), it specifies the product of concern, the type of concern regarding the measure and the objective of the measure concerned. The advantage of this information is that it provides a sys-tematic set of all measures that are perceived as sizeable trade barriers by exporters. In this context,“sizeable” means that they are important enough that countries whose exports are affected raise a “concern” to the SPS committee of the WTO. We are aware that, for the purpose of our estimations, one potential drawback is that this may produce endogeneity problems. We will therefore address endogeneity here, including via instrumental-variable estimation. Overall, the SPS STCs database contains information on 312 specific-trade concerns that were raised over the 1995-2011 period. Each STC corresponds to a concern raised by one or more countries in relation to a SPS measure maintained by one or more of their trading partners.11 For each concern, we have information on: (i) the country or
countries raising the concern and the country imposing the measure, (ii) the product codes (HS 4-digit) involved in the concern, (iii) the year in which the concern was raised to the WTO, and (iv) whether it has been resolved and how. Our analysis focuses on a sub-sample of concerns raised by the EU over the period 1995-2005 - the period for which we have information on French firm-level exports. However, given the lag structure of our econometric exercise (see Section 3), in order to be consistent over the entire paper, we rely on the 1996-2005 period.
Approximately 45 per cent of all concerns raised between 1996 and 2005 were reported as resolved or partially resolved by WTO members to the SPS Committee. Most of these resolved concerns ended up in a gentleman’s agreement in which the importing and exporting countries arranged to solve the problem without resorting to a WTO panel. Among the concerns raised by the EU, a slightly higher share were reported as being resolved or partially resolved (50 per cent). Only five percent of all concerns ended up in a dispute at the WTO (6 per cent for concerns raised by the EU). In addition, the average duration between a concern first being raised and its resolution is about three years.
The nature of STCs varies case by case. STCs are raised in relation to SPS measures protecting human, animal or plant life or health. Between 1996 and 2005, 40 per cent of the concerns raised related principally to animal
9The dataset is available athttp://www.wto.org/english/res_e/publications_e/wtr12_dataset_e.htmin a
quanti-tative format and in a searchable format athttp://spsims.wto.org/web/pages/search/stc/Search.aspx.
10Staiger(2012) provides a theoretical analysis of the challenges faced by the WTO in dealing with non-tariff measures.
11The 312 SPS STCs cover 58 imposing countries and 205 HS4 headings. On average, each STC covers 13% of French exports in a given
health and zoonoses, 28 per cent to food safety, 26 per cent to plant health, and 6 per cent to other issues such as certification requirements and transparency.12 In some cases, countries asked for a clarification about the scope and the status of the measure. In other cases, the concerns relate to the perceived discriminatory or trade-restrictive nature of the measure. Further STCs were related to the restrictiveness of the specification of the standard, the inspection procedure, the transparency of the measure, or the conformity-assessment procedures. Table1provides an overview of the typology of STCs raised in the WTO SPS Committee between 1996 and 2005.
One example of a concern over transparency is that raised in June 2004 by the European Union together with United States, Australia, and New Zealand against several SPS measures adopted by the Indian Government. The raising countries indicated that India’s non-notification, or late notification, of various SPS measures had created unnecessary trade disruptions and an uncertain environment for trade. In 2005, the European Union and the United States again expressed concern regarding India’s non-compliance with its transparency obligations under the SPS Agreement and requested India to suspend the implementation of measures on dairy products and pet food until a WTO notification was made available and a reasonable time provided to Members for their review and comment. India explained that it had recently notified the establishment of three separate enquiry points with clearly-delineated responsibilities. These efforts had achieved greater coordination among agencies, as demonstrated by the number of recent notifications that had been submitted at an early stage in the development of the regulation and with a due period for comments.13
SPS concerns go beyond the food and agricultural sectors and also include manufacturing. One example is the concern raised by the EU regarding Chinese import requirements for cosmetics.14 The new regulations prohibited
cosmetics containing certain ingredients of animal origin from 18 countries. The regulation was introduced in connection with risks associated with the existence of Bovine Spongiform Encephalopathy (BSE). Cosmetics from these 18 countries required certification that they did not contain specified products of bovine or ovine origin. In June 2003, the European Union reported that further progress was made as China had presented a list of prohibited products. China responded that it was willing to review its regulations and welcomed continued dialogue.
A detailed analysis of the typology of SPS-related STCs shows that SPS measures, although they are behind-the-border in nature, are far from being non-discriminatory. On the contrary, they can discriminate not only between domestically-produced and imported products, but also across types of exporting firms or potentially against specific exporting firms. Of considerable interest in the context of the current paper, the concern raised by the EU in
12WTO Committee on SPS, 2005, G/SPS/53. Similarly, 39, 30, 25 and 6 per cent of STCs raised by the EU related to animal health, food
safety, plant health, and other issues, respectively.
13WTO documents G/SPS/R/34,G/SPS/R/35, G/SPS/R/36/Rev.1 G/SPS/R/37/Rev.1. 14WTO documents G/SPS/R/27, G/SPS/R/28,G/SPS/R/3.
1998 related to the US requirement on refrigeration and labeling requirements for shell eggs. The EU required clarifications regarding the non-application of the measure to production units with 3000 hens or fewer, and asked the United States to explain the discrimination between foreign and domestic eggs.15 The measure has been maintained
by the United States, and no solution of the concern had been reported to the WTO as of March 2011.16 This
example shows that measures can, by their nature, discriminate against particular types of firms - large exporting firms in the above example. In addition, given that the imports of goods that are regulated by SPS measures have to be inspected and certified, there is potential for SPS measures to be applied in a discriminatory way. Certification requests for individual consignments or lengthy inspections can potentially target specific firms. In these types of cases, our firm-level analysis is the most appropriate for the evaluation of the trade impact of SPS measures. The advantage of specific trade concerns over notifications or traditional information on the existence of regulations to measure the restrictiveness of product standards is that they identify measures that are perceived by exporters and/or governments as major obstacles to trade. As such the information they provide relates to restrictive trade measures only. By way of contrast, the traditional measures of non-tariff barriers used in the existing literature, based on the TRAINS or Perinorm database or WTO notifications, do not distinguish between product standards that restrict trade and measures that may even increase trade, such as those addressing problems of asymmetric information or network externalities (Moenius,2004;Fontagn´e et al.,2005). Therefore, existing work arguably fails to account for the actual trade-restriction effect of particular measures.
Our use of trade concerns as a measure of restrictiveness also allows us to identify the exact moment when the mea-sure is perceived to be a barrier. For example, in 1998, the EU asked Australia to identify the international standard on which its import ban on Roquefort cheese was based, or to provide scientific justification and a risk assessment. Australia’s risk assessment of Roquefort cheese had identified potential problems with pathogenic micro-organisms, and French Roquefort did not comply with Australian requirements. However, the measure restricting Roquefort imports of into Australia dates from before 1995, but compliance was strengthened only at a later date.17 It was only at the moment when the implementation of the measure was made more effective that the measure was perceived as being a barrier, not beforehand.
One potential problem with the use of STCs is that they can either refer to a measure currently in force or to a new measure notified to the WTO. When STCs refer to a new measure, except for emergency measures, they can be raised as early as 8 months before the new regulation enters into force.18 Therefore, the estimates of the impact of
15WTO documents G/SPS/R/13.
16WTO document G/SPS/GEN/204/Rev.11/Add.2.
17WTO documents G/SPS/R/11 and Corr.1, G/SPS/R/13, G/SPS/R/14.
18The WTO agreement requires members to notify new measures that may have a ”significant effect on trade” at their drafting stage and
measures subject to STCs on trade are potentially downward-biased. As our estimated coefficients are significant, this issue does not undermine our findings. Furthermore, this issue can be partially addressed by the use of the lag of STCs, as measures of STCs raised the year before are in fact likely to currently be in force.
In line with the general perception that non-tariff trade barriers have become increasingly prevalent, the cumulative number of unresolved SPS-related STCs trends upward both in terms of the number of countries with SPS measures that are the object of a STC, and the number of products covered by such concerns. Figure1 shows that the number of countries with SPS measures that are the object of STCs doubled over the 1996-2005 period. This number continued to grow after 2005, and reached a peak in 2009. This is consistent with the general perception of increased protectionism after the crisis, again suggesting that STCs may indeed capture trade barriers. The count of the number of HS4 product lines for which a concern had been raised also increased between 1995 and 2011 (Figure
2).
STCs tend to be concentrated against a handful of countries. In particular, the map in Figure3shows that relatively few concerns are raised against small economies. This does not necessarily indicate that small countries do not use SPS measures that may restrict trade. Instead, it might be the case that raising concerns is costly. Therefore, countries limit the concerns that they raise in the WTO Committee to those covering large export markets. An-other explanation may be that richer countries are more sensitive to food-safety issues than are poorer countries. Therefore, rich countries will impose more numerous and stringent measures than do poor countries, and this in turn will be reflected in a greater number of concerns against the former. However our identification strategy will address these issues by including sector-destination-year fixed effects. Table2shows the distribution of concerns by the country that has imposed the problematic measure. Column 1 shows for each imposing country the number of products (counted at the HS4-level) covered by a concern raised by a WTO member. The figures in this column show that, over the 1996-2005 period, 40 per cent of all products covered by a concern referred to measures intro-duced by the European Union, the United States, India, China and Japan. However, when we take into account that concerns may refer to more than one product (column 1), that the measure imposed by a country may be a concern for a number of raising countries (column 2) and weight the relevance of each concern by the number of years for which it remained unresolved (column 3), the set of countries with substantial involvement in STCs substantially increases. For example, the figures for the total number of concerns raised against Turkey, Switzerland, Argentina, Korea, and Indonesia in column 3 are twice as large as the average figure (which is 335).
measure (Paragraph 5(d) of Annex B of the SPS Agreement and WTO document G/SPS7/Rev.3). In addition, in accordance with paragraphs 1 and 2 of Annex B of the SPS Agreement, Members are obliged to: (a) ”ensure that all SPS regulations which have been adopted are published promptly”, and (b) ”allow a reasonable interval between the publication of a sanitary or phytosanitary regulation and its entry into force”. As agreed in the Doha Decision on Implementation-Related Issues and Concerns (WT/MIN(01)/17, para. 3.2): ”the phrase ”reasonable interval” shall be understood to mean normally a period of not less than 6 months”.
The concerns raised by the EU, in columns 4 and 5 of Table2, exhibit very similar patterns. EU concerns against measures introduced by the United States, India, China and Japan represent 45 per cent of all products covered by a concern. When the duration of concerns is taken into account, Turkey, Canada, Argentina, and Korea now also figure prominently (with a total count in column 3 that is twice as large as the average figure).
SPS-related trade concerns have been raised for a variety of sectors. Table3lists the sectors (at the HS2-level) for which at least one concern was raised over the 1996-2005 period.19 For each sector, this table shows the number of
countries that raised a concern (column 1), the number of countries time the number of products at the HS4-level covered by the concern (column 2), and the latter multiplied by the number of years during which the concern remained unresolved (column 3).
2.2
French firm-export data
We now turn to the export data. Individual export data on French firms are provided by French Customs for the 1995-2005 period.20 Our estimations will focus on the 1996-2005 period as we lose the starting year after calculating the
firm’s exit probability (for details see the next section).
The French firm dataset includes export records at the firm, product and market level for all French exporters (more precisely, all exporters located in France).21 The dataset classifies product categories using the Combined Nomen-clature at 8 digits: CN8 (an 8-digit European extension of the HS6 comprising some 10,000 product categories). The descriptive statistics for French firms’ exports and markets appear in Appendix TableA1.
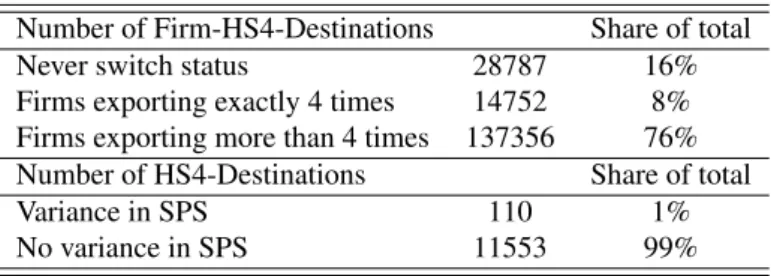
The number of potential observations is very large: for each HS4 heading there are some 100,000 potential exporters, 200 destinations and 11 years. To work with a manageable dataset, we restrict our sample. As the EU acts as a single country in WTO committees, we restricted our firm-level sample to only extra-EU export flows. We also excluded service sectors from our analysis (98 and 99 in the HS classification). We then selected the following subsample of relevant destination countries for French firms: we calculated total export flows by destination market and retained markets with above-median exports. Next, we kept only those firms that exported a certain product to a certain market for at least four years within our time period. This strategy reduces any bias from only occasional exporters. TableA4presents the descriptive statistics on the churning rate of firms included in our estimation sample.22 Finally,
19A figure of zero implies that no country raised a concern over the 1996-2005 period. For example, no country raised a concern for products
falling under Chapter 51 (wool). But, since Chapter 51 is listed in the table, some country must have raised a concern in relation to wool over the 2006-2011 period.
20These data are subject to statistical secrecy.
21We consider legal units, as defined by their administrative identifier.
22With this sampling rule we include in our sample non-switcher firms, i.e. those firms exporting over the entire period (as revealed by churning
rates in TableA4). The presence of non-switcher firms might weight the SPS coefficient downwards (they do not change status). As a robustness check we dropped non-switcher firms. The results, reported in the Online Appendix of the paper show that the inclusion of non-switchers does not affect the SPS coefficient. We can also replicate our estimations including firms exporting at least three (instead of four) years. The results again appear in the Online Appendix.
we aggregated the information on exported products - originally provided at CN8 - into some 1,200 headings of the HS4 classification, which is also that used by the WTO to record SPS concerns.23
As acknowledged byKonings and Vandenbussche(2013), one advantage of individual exporter data is their good quality.24 To the best of our knowledge, only two other pieces of work have analyzed the effect of standards and
technical regulations at the firm level. Chen et al.(2006) use the World Bank Technical Barrier to Trade Survey (2004), covering 619 firms in 24 agricultural and manufacturing industries and 17 developing countries, and find that the testing procedures imposed by potential destination markets reduce export shares by 19 per cent.25 Reyes
(2011) examines the response of US manufacturing firms in the electronic sector to a reduction of technical barriers to trade following the harmonization of European product standards to international norms. In US Longitudinal Firm Trade Transaction Database (LFTTD) data this harmonization increased the probability that high-productivity firms enter the EU market, whereas tariffs did not affect the entry decision.
Firm-level export data allow us to see clearly whether NTMs affect the intensive/extensive margins of trade, the exit dynamics from foreign markets, and French firms’ export prices. We can also control for firm characteristics in determining the effect of NTMs. Large highly-productive firms may react differently to NTMs than small and less-productive firms. Since we do not have information on turnover, employment or capital for the universe of French exporters, we rely on export-based measures of firm characteristics.26
The importance of firm characteristics for the relationship between SPS measures and trade is underlined by the Kernel distributions of firm size according to whether an STC has been raised in the market. In Figure 4 the distribution of firm size27 is less dispersed with a higher mean for firms exporting in markets with SPS measures
subject to concerns than in markets without such measures. The two firm-size distributions are statistically different from each other.28
3
Empirical Strategy
We ask whether the trade impact of non-tariff barriers such as SPS measures is heterogeneous across firms. The theoretical analysis of the impact of a new restrictive SPS measure is complex: SPS measures may simultaneously affect different dimensions of trade costs, and may discriminate against exporters. Our empirical strategy aims to
23This sampling strategy significantly reduces our sample size, from 40 million to 2 million observations. We test the robustness of our
results by running regression at the HS Section level of the UN (http://unstats.un.org/unsd/tradekb/Knowledgebase/ HS-Classification-by-Section): the results appear in the online Appendix (Tables 3 and 4).
24Konings and Vandenbussche(2013) use French firm data to analyze the impact of anti-dumping protection at the firm level. 25InChen et al.(2006) export share is the ratio between firm exports and total sales.
26Data on French firm characteristics are available only for firms with more than 25 employees. Over 50 per cent of exporting firms have fewer
than 20 employees. To correctly account for the extensive margin of exports, we do not use data on French firm characteristics.
27For the purpose of the figure, size is approximated by total export value per firm. 28The Kolmogorov test null is rejected at the 99 per cent level
uncover such relationships.
The imposition of an SPS increases the fixed entry cost (or the cost of remaining) in the market to which this new SPS applies, if it requires that firms change their production process or logistics chain to comply with the new regulation. A new SPS measure may also take the form of an iceberg-type variable cost if it requires firms to upgrade their products or substitute more-costly inputs for those previously used (e.g. a less-toxic treatment imposed in certain destination markets). A new SPS measure may generate an additive cost if it requires a firm to go through a certification procedure for each unit sold (thus adding a per unit cost, as inMartin(2012)). These costs may affect exporters disproportionately more than domestic producers. In a standard heterogeneous-firm model of trade with CES preferences, where trade barriers take the form of fixed entry costs and variable (iceberg) costs of exporting, the imposition or toughening of a trade barrier has a negative impact on the extensive margin of trade (Melitz,2003;
Chaney,2008;Crozet and Koenig,2010). In contrast, the effect on the intensive margin is ambiguous.29 Larger
variable costs, such as tariffs, reduce export volumes, while higher fixed entry costs can potentially have a positive effect on export volumes via their indirect effect on the price index in the importing country (through a reduction in competition).
Theory provides no unique predictions regarding the price responses of exporters of different sizes to higher trade costs. On the one hand, large and potentially more efficient firms are likely to comply with more stringent require-ments more easily and at lower cost.30Large exporters with higher market shares and lower demand elasticities will also pass less of the cost increase on to the consumer. Prices should therefore rise, but less so for large firms. On the other hand, higher compliance costs reduce firm participation, decrease competitive pressures in the importing market, and push up export prices. Larger firms can increase prices more through this channel, as they face a lower demand elasticity than do small firms.31
Against this background, our empirical strategy is to explain exporters’ behavior in terms of participation, values shipped and market (price range) positioning as a function of SPS concerns and firm characteristics. We control for bilateral tariff levels and include a set of fixed effects controlling for a number of factors affecting trade. We
29This pattern has been extensively documented regarding the impact of distance on aggregate exports. More-distant markets are served by
larger and more profitable firms, this selection leading to an indeterminate effect of distance on the intensive margin (Lawless,2010).
30Better-managed firms should be able to adjust to new standards at lower cost, through more efficient production techniques. Bloom et al.
(2010) provide related evidence that better-managed UK manufacturing establishments are less energy-intensive.
31In a similar theoretical framework,Berman et al.(2012) show that in the presence of exchange-rate appreciation, exporters with a larger
estimate the following equation:
yi,s,j,t = α + β1SP Ss,j,t+ β2ln(size)i,t−1+ β3(SP Ss,j,t∗ ln(size)i,t−1) + β4ln(visibility)i,HS2,j,t−1+
β5(SP Ss,j,t∗ ln(visibility)i,HS2,j,t−1) + β6Ln(tarif f + 1)s,j,t+ φHS2,t,j+ µi+ εi,s,j,t, (1)
where the subscripts i, s, j, and t stand respectively for firm, HS 4-digit product category (or 2-digit sector if HS2), destination country and year.
Our dependent variables are: (i) a dummy variable for positive trade flows into a certain product-destination market combination to capture the (firm-product) extensive margin of trade, or participation; (ii) a dummy variable for the firm exiting a certain product-market (a dummy for the firm not exporting in the current year but having exported the year before); (iii) the firm’s export values (in logs) to capture the intensive margin of trade;32and (iv) the price of
exported goods (in logs), proxied by unit export values. Despite the dichotomous nature of some of our dependent variables, we estimate equation1via OLS. We rely on simple linear probability models (LPM) rather than on non-linear probit (or logit) to avoid the incidental parameter problem due to the sizeable set of fixed effects we include in all regressions. In addition, LPMs provide simple direct estimates of the sample average marginal effect.33
SP Ss,j,t, reflects the existence, at time t, of an ongoing (unresolved) concern in product category s between the
EU and an importer country j.34 Size
i,t−1is a firm-specific characteristic and captures heterogenous export
per-formance across firms related to firm productivity (which is here unobserved).35 We use a one-year lag in our
regressions to reflect that firms’ past performance affects future export decisions.
To investigate whether SPS concerns have heterogeneous effects on exporters, we include an interaction term be-tween firm size and our SPS variable.36 Heterogeneous-firm trade models37suggest that the effect of an SPS measure on export performance may depend on the size of a firm, provided that size is associated with (for example) pro-ductivity, and hence with the ability to overcome the additional costs of exporting. In other words, not all firms will
32The dependent variable in this regression includes only positive trade values.
33As a robustness check, we run a fully-saturated version of the Linear Probability Model where firm size and its interaction with SPS are
binned. We split the sample distribution of firm size into two bins (above/below the median) and four bins (quartiles). The results in Appendix Table A3 are in line with our main results: SPS concerns have a stronger negative impact for firms below median size (and, among these, even more for firms in the bottom size quartile). The negative effect of SPS is smaller for firms above median size, and in some cases zero for firms above the 75th size percentile. We thank an anonymous referee for suggesting this strategy.
34For the purpose of this paper, we do not distinguish between different types of SPS, except for testing the robustness of our results to the
exclusion of bans. We focus on the average trade effect of a restrictive SPS, as indicated by the fact that it generated a STC at the relevant WTO committee.
35Since we do not have exhaustive information on French exporters’ balance sheets, we calculate the size variables in terms of exports and
not total sales. The empirical literature has extensively shown that export values are a good proxy for the overall size of the firm: big exporters are usually larger and more-efficient than are non-exporters (seeMayer and Ottaviano(2008)). We define this variable as: ln(size)i,t−1=
X
s⊂S
X
j⊂J
exportsi,s,j,t−1.
36The interaction between SPS and firm size is our main variable of interest. Given that this variable varies at the firm-HS4-destination-year
level, we do not need to cluster standard errors. However, as a robustness check we also cluster standard errors at HS4-Destination-Year and our results continue to hold. The results are available on request.
be able to cope with the higher costs of new SPS regulations, be it a fixed cost of adaptation and/or a variable trade cost.
In addition, large and more visible firms may be targeted by policy makers, and SPS measures can be protectionist in nature. We pick this up by introducing a variable controlling for the visibility of the firm: V isibilityi,HS2,j,t−1
measures the (lagged) importance of the firm, in terms of its exports, in a certain sector and destination market. This is calculated as (the logarithm of one plus) the share of exports of a firm in a certain market and HS2 sector over total French exports in the same market and sector. This is also introduced as an interaction term with the SPS concerns variable.
The use of SPS measures and their stringency may furthermore be related to the level of tariffs. Theoretically, these two policy instruments can be used as substitutes or complements.38 To help isolate the effect of SPS measures we
also control for applied tariffs at the product level (Ln(tarif f + 1)HS4,j,t).39
For ease of interpretation, both V isibility and Size have been centered (i.e. included in the regressions as deviations from their median value).40 The descriptive statistics of the variables included in our regressions appear in Table
A2.
Finally we add two sets of fixed effects.41 We include a set of firm fixed effects, µi, to control for firm-specific
(time-invariant) characteristics that affect trade performance, such as average firm size or productivity. We also include a set of three-way fixed effects ( HS2-Destination-Year), φHS2,t,j, to control for country-time-HS2-level varying
factors that may affect trade, such as business cycles, import-demand shocks and multilateral trade resistance (as highlighted byHead and Mayer(2014)).42 These three-way fixed effects also control for the geographic orientation
of French exports that may affect the probability of raising a concern. SPS measures may well be imposed by foreign countries to prevent imports from European countries other than France, and for this reason some measures might be irrelevant for French firms (and thus bias our coefficient). Finally, HS2-Destination-Year fixed effects also control for measures imposed by a country in response to a negative domestic shock in a given sector. For example, a government may impose a ban on the import of cheese to protect the local dairy sector that has been affected by a negative shock in a particular year.43
38Note, however, that in our sample the correlation between tariffs and our SPS variable is negligible, at 0.07.
39The tariff data come from the TRAINS database. As a robustness check we also add the interaction between tariffs and firm size, with the
results appearing in the online appendix in Table 5. We thank an anonymous referee for suggesting this test.
40Firm size is normalized by the sample median by year. Visibility is normalized by the HS2-Destination-Year specific median. 41We are indebted to two anonymous referees for suggesting the current identification strategy.
42We use theGuimar˜aes and Portugal(2010) estimator, which allows us to include high dimension fixed effects.
43It is worth adding that our results remain robust to dropping the firm fixed effects. Our results do not thus only reflect within-firm time
4
Results
4.1
SPS and the extensive margin of trade
The regression results for the impact of SPS measures on export participation are shown in Table4. As expected, we find a negative and significant effect of the imposition of an SPS giving rise to a concern on the extensive margin of trade. From the estimates in column 1, where we control for tariffs in addition to fixed effects, the imposition of a restrictive SPS measure (as revealed by the presence of a concern) for a certain product reduces the probability of exporting this product by approximately 4 percent. Restrictive SPS measures hence act as an additional cost on foreign markets and increase the productivity threshold for export participation. The coefficient on tariffs is, as expected, also negative and significant.
In columns 2 to 4, we progressively add firm-level characteristics and their interaction with SPS measures. Column 2 includes the lag of firm size (which is why the number of observations falls relative to column 1). We find that large firms have a higher probability of participating in the export market (that is, to export a given product category to a given destination). This result is in line with heterogeneous-firm trade theory. In addition, big players are less affected by SPS measures. The interaction between total firm exports (firm size) and the SPS concern dummy attracts a positive and significant coefficient: the larger the size of the exporter the smaller the effect of a SPS concern. This conforms to our expectations: less efficient firms do not participate in the export market as the higher efficiency threshold disqualifies them from doing so (restrictive SPS increases fixed and variable export costs). As firm sizehas been centered (measured as the deviation from the median), we can conclude that the restrictive effect of SPS is lower for firms above the median. Our data do not allow us to say why larger firms are less affected by new restrictive SPS measures, but our results suggest that they can more easily overcome the fixed or variable cost of an SPS measure, as suggested by theory (Bloom et al.(2010).
Column 3 introduces the interaction between (lagged) firm visibility and SPS. This is crucial for our identification strategy. As already discussed, authorities in importing markets might target more-visible exporters with restrictive SPS measures. If this were so, our findings on the heterogeneous effect of SPS measures across firms suffer from endogeneity bias, and we should expect a significant coefficient on the interaction between Firm Visibility and SPS. However, the estimated coefficient is not significant (the standard error is actually very large), so that the negative impact of SPS measures on export probability does not vary across firms with different levels of visibility (see column 3). This confirms the validity of our empirical model.
interac-tions with the SPS variable both appear. The negative impact of SPS measures continues to be dampened for large firms, while visibility in a given sector-market does not affect this impact. In column 5, we test whether our results are driven by SPS measures that take the form of an import ban, and so drop such cases. This does not change the results.
As a second step, we analyze the extensive margin of trade from the perspective of the firm’s decision to exit a market (a given product-destination) to see whether this is related to SPS measures. A new restrictive SPS will trigger exit if exporters cannot pay the cost of adaptation to the new restrictive SPS, or they reorient their exports to another destination-product where the cost of exporting has not risen. Firm exit here neither means that a firm stops exporting in general, nor that the firm stops exporting to the destination imposing the measure, but that the firm stops exporting to the market-product to which the SPS measure has been applied.
The results for the effect of SPS on exit probabilities appear in Table5; the positive and significant estimated coefficient confirms that SPS measures increase the probability (by 2 per cent, as the average of the coefficients in columns 1 and 3) of firm exit from the market with such measures. As expected, large firms are less likely to exit than are small firms following an SPS measure (see the negative coefficient on the interaction between SPS and firm size in columns 2, 4 and 5). One possible explanation is that large firms can more easily adapt to new standards. Tariffs – which can be interpreted as a variable trade cost as opposed to distance (Berthou and Fontagn´e,2013) – do not affect exit probability, suggesting that the fixed cost of exporting associated with the SPS (for example, the product-adaptation cost implied by new SPS measures) is more important than variable export costs (the tariff level).44 This result does not mean that stringent SPS imposes only fixed costs on exporters, as there may be variable
costs as well. However, the trade-reduction effect, via firm exit, is channeled by the fixed-cost part of the SPS-related costs.
Last, as a robustness check, we estimate the effect of SPS concerns on the number of exporting firms for each HS4-Destination-Year combination. The results in Appendix TableA5suggest that the presence of SPS concerns reduces the number of exporting firms within each HS4-Destination-Year cell.45
4.2
SPS and the intensive margin of trade
We now turn to the impact of SPS measures that have triggered a concern on firm export values. Table6shows that SPS measures negatively affect the intensive margin of trade. In column 1, SPS measures that give rise to a concern
44This result may appear to contrast with our results on participation (Table4) where the tariff coefficient is negative and significant. However,
the two stories are different: an increase in variable costs (tariffs), although preventing firms from participating in the export market (the result on participation estimation), is not large enough to force firms to exit the export market (the exit estimation results).
at the WTO reduce export values (for firms staying in the market) by on average 18 percent, which corresponds to a huge tariff increase (a ten percentage points increase in tariffs, according to column 1, only reduces export values by 1.4%). Using 6-digit level data,Buono and Lalanne(2012) obtain a higher tariff elasticity, probably because the greater disaggregation in their data allows them to better take into account tariff movements at the product level, including tariff peaks.
As for the extensive margin, the intensive margins of large exporters (firms above median size) are less affected by restrictive SPS. In a CES world `a laArkolakis(2010), with economies of scale and diminishing returns, higher export costs are expected to have the most effect on smaller firms that stay in the market. Our findings are in line with this prediction. It is worth noting that the interaction term between SPS and Firm Visibility (in column 3) is insignificant. This again suggests that our results are not biased by importing countries targeting highly-visible firms with new SPS measures. Column 5 excludes ban and prohibition cases from the sample, with no effect on the coefficients of interest.
Finally, the combination of the results in Tables 4 and 6 (column 2) allows us to replicate the quantification exercise
inEgger et al.(2011) of the contribution of the different margins to the overall SPS effect. We find an expected lost
sales figure from SPS at the firm level of 43%. Of this, the extensive margin accounts for one-third of the total effect of SPS concerns and the intensive margin for two-thirds.
4.3
SPS and firm pricing
Our price regressions appear in Table7. As a preliminary remark, as we do not have direct information on individual-exporter prices, we estimate the relationship between SPS concerns and trade unit values at the HS4 level. Unit values are not prices, and the product mix within the HS4 product may change with SPS concerns. Our estimation may therefore suffer from measurement error, as, at the level of aggregation of our analysis, we do not observe changes in the product mix within a product category. Keeping this note of caution in mind, it is nonetheless of interest to analyze our empirical findings.
As expected, the unit values of exports rise on average when a new SPS measure is introduced. SPS measures increase the fixed costs of production (e.g. compliance with a new standard may require additional costs to adapt the production process), or variable costs. To the extent that an SPS measure imposes a barrier to entry, it may lead to a redistribution of market shares among players and so to a strategic pricing response. Under imperfect competition, the rent (higher price, lower quantities) created by the new barrier to entry will be distributed among agents (exporters and domestic firms). Firms may attempt to capture part of this rent, and decide to upgrade the
product mix. This kind of response has been extensively documented in the case of voluntary export restrictions – VERs (Krishna,1989). Here we would expect upgrading by the survivors, and a higher price paid by the consumer on the destination market which imposes a stringent SPS. However, our data cannot distinguish whether the positive effect of a restrictive SPS on unit values is due to higher production costs, the upgrading of the product mix, or simply higher prices resulting from less competition.
Columns 2 to 4 address the heterogenous response of firm pricing by interacting SPS with Firm Size. As discussed above, theory predicts an overall positive impact of restrictive SPS on prices. However, the theoretical predictions regarding the relative impact of SPS measures on prices by firm size are ambiguous. On the one hand, large exporters should pass less of the cost increase onto foreign consumers, compared to exporters with lower market shares; furthermore, large firms may adjust at lower cost to the new standards. On the other hand, large exporters may respond to the lower demand elasticity they face by increasing prices more than do small firms following the fall in competition (via firm exit) in the importing country. We find some evidence that large (exporting) firms (above median size) increase their price less than do small firms. However, this result should be interpreted only cautiously, as the interaction with Firm Visibility becomes significant, suggesting endogeneity (columns 3). As we will see in the next section, instrumental-variable analysis confirms that this interaction result is not robust. As was the case for our other dependent variables, there is no effect of removing bans and prohibitions in the specification of Column 5.
The coefficient on tariffs is negative and significant in all regressions. One possible explanation of this counter-intuitive result is that tariffs are endogenous in this specification: in the political-economy literature on tariff pro-tection homogeneous goods - goods in low value-added sectors such as agriculture - tend to be more protected than are differentiated goods.
4.4
Endogeneity
Equation (1) may suffer from endogeneity bias either because of omitted-variable bias or reverse causality. The former is considerably reduced by our use of sector-country-year and firm-specific fixed effects: these control for most of the potential unobserved variables affecting firms’ export behavior.
Reverse causality may come about if the government of a certain destination-market introduces an SPS measure in response to high levels of French exports (from a specific French firm, or from a group of firms) and a concern is raised by the EU against this measure. As we run firm-level regressions and analyze the differential impact of SPS measures across firms of different sizes, potential reverse causality is significantly reduced. However, reverse
causality can still arise if a country imposes protectionist measures against a specific (highly-visible) firm that has exported a great deal to that country-sector. We believe that the insignificant coefficient on the interaction between SPS and firm visibility shows that this source of endogeneity is not a major concern.
Nevertheless, as a robustness check, we estimate our regressions with SPS lagged by one year.Indeed, the presence of a SPS at t − 1 is likely to be exogenous with respect to export at time t.46. The results in Table8are in line with
our baseline regressions. In particular, the imposition of SPS measures reduces both the intensive and extensive margins of trade, with the impact being attenuated for large exporters. The results also confirm that consumers in SPS-imposing markets face higher prices.
We also address endogeneity via the instrumental-variable (IV) specification (1). Our instrumental variable here is the total number of concerns raised in a certain HS2 sector (excluding the concern raised at the product level) - SP SHS2. The intuition is that if there is an SPS on a certain product s, it is likely that an SPS concern will also be raised in products similar to s, i.e. products within the same HS2 industry. We control for the geographic orientation of French firms (which was previously picked up in our set of sector-country-year fixed effects) by including the market share of French firms in a given HS2-Destination. This market share is calculated as the ratio of sector-destination market-specific French exports to total exports in that sector.47
The results from the first-stage regression of the IV specification are presented in Table9, and suggest that our instrument is good predictor of SPS. In addition, the regression F-statistic rejects the possibility of weak instruments. The second-stage results appear in Table10. The impact of SPS measures on firm-export decisions (either partic-ipation or exit) remains negative and significant, with the effect being dampened for larger firms. Regarding the intensive margin of trade, the second-stage results confirm our findings when the market share of French firms is controlled for - which (partially) substitutes for the sector-country-year fixed effects which are no longer included. As such, restrictive SPS reduces exports, but less so for large firms. Last, for trade unit values, the estimated coefficient on the interaction remains negative, but is no longer significant in this set of regressions.
5
Conclusion
This paper has considered the heterogenous trade effects of restrictive SPS measures on exporters of different sizes, and the channels through which aggregate exports are reduced: firm participation, export values and pricing
strate-46Even more if one considers that a SPS concern at t − 1 refers to a measure imposed at t − 2 or earlier
47We chose this strategy as 2SLS cannot be run with the same set of fixed effects as in equation (1): the high-dimension fixed effects estimator
ofGuimar˜aes and Portugal(2010) has not been implemented in STATA for 2SLS. As such, we had to reduce our fixed effects to the maximum number of variables allowed by STATA in a single regression. The 2SLS regression thus includes HS2-year and destination-year fixed effects. As a further check we also tried including destination-year-section(HS1) fixed effects. Although feasible in terms of size, this strategy did not produce a result for computational reasons (out of memory).
gies. We use a panel of French firm-level exports over the 1996-2005 period and an original dataset on SPS specific trade concerns raised at the WTO. The advantage of dataset is that it only includes SPS measures that are perceived as an obstacle to trade by exporters, thus overcoming one of the problems with the non-tariff measures previously used in the economic literature, which fail to distinguish between restrictive and possibly trade-enhancing measures. From a theoretical point of view, the imposition of a restrictive SPS may engender both fixed and variable costs, and so affect both the extensive and intensive margins of trade with heterogeneous effects across firms. However, little is known about the magnitude, and in some cases also the direction, of these effects.
We estimate the effect of the presence of an unresolved SPS concern in a certain market and product category on both the intensive and extensive margins of trade. We also consider the effect of SPS on trade unit values – as a proxy for prices. Most importantly, our analysis accounts for a differential effect of SPS measures on a number of dimensions of trade and across firms. We pay particular attention to potential endogeneity issues.
Our results show that the imposition of stringent SPS measures reduces both the participation of firms in export markets and the value of the exports of the firms that remain in the market. These negative effects are attenuated for larger exporters. We also find evidence of a price-increasing effect of SPS imposition. Complying with stringent SPS imposes additional costs that are at least partially passed on to the consumer, and /or may represent an incentive for firms to upgrade their exported product.
These effects are not small. The presence of a restrictive SPS reduces export participation by 4 per cent and the exported value (the intensive margin) by 18 per cent. The size of the latter effect is huge considering that, in our estimates, a 10 percentage-point rise in tariffs leads to ”only” a 1.4% reduction in the value of exports by the firm. This result is plausible considered that our SPS dummy only refers to trade-restrictive SPS measures (those for which the exporting country has raised a concern to the WTO).
Overall, our results show that stringent SPS measures do not only reduce existing trade flows: they also affect market participation and prices. Moreover, firms of different types will be affected differently, with a higher toll imposed on smaller and possibly worse-performing exporters.
Our results have important implications from a policy perspective. The significant impact of non-tariff barriers such as SPS measures on trade highlights the challenges faced by countries at the multilateral and regional levels in the negotiation of domestic regulations in addition to their tariff commitments. Our results also illustrate that governments willing to cooperate on the integration of non-tariff measures should take into account the importance of the cost component of such measures, and therefore their differential effect on small and large firms, potentially distorting competition.
Bibliography
Arkolakis, C. (2010), ‘Market penetration costs and the new consumers margin in international trade’, Journal of Political Economy118(6), 1151 – 1199.
Berman, N., Martin, P. and Mayer, T. (2012), ‘How do different exporters react to exchange rate changes?’, Quar-terly Journal of Economics127(1), 437–492.
Berthou, A. and Fontagn´e, L. (2013), Variable trade costs, composition effects, and the intensive margin of trade, Technical report, Paris School of Economics.
Bloom, N., Genakos, C., Martin, R. and Sadun, R. (2010), ‘Modern management: Good for the environment or just hot air?’, Economic Journal 120(544), 551–572.
Buono, I. and Lalanne, G. (2012), ‘The effect of the uruguay round on the intensive and extensive margins of trade’, Journal of International Economics86(2), 269–283.
Chaney, T. (2008), ‘Distorted gravity: the intensive and extensive margins of international trade’, American Eco-nomic Review98(4), 1707–1721.
Chen, M. X., Otsuki, T. and Wilson, J. S. (2006), Do standards matter for export success?, Policy Research Working Paper Series 3809, The World Bank.
Crozet, M. and Koenig, P. (2010), ‘Structural gravity equations with intensive and extensive margins’, Canadian Journal of Economics43(1), 41–62.
Crozet, M., Milet, E. and Mirza, D. (2013), The discriminatory effect of domestic regulations on international trade in services: Evidence from firm-level data, Technical report, Paris School of Economics.
Disdier, A.-C., Fontagn´e, L. and Mimouni, M. (2008), ‘The impact of regulations on agricultural trade: Evidence from the sps and tbt agreements’, American Journal of Agricultural Economics 90(2), 336–350.
Eaton, J., Kortum, S. and Kramarz, F. (2011), ‘An anatomy of international trade: Evidence from french firms’, Econometrica79(5), 1453–1498.
Egger, P., Larch, M., Staub, K. E. and Winkelmann, R. (2011), ‘The Trade Effects of Endogenous Preferential Trade Agreements’, American Economic Journal: Economic Policy 3(3), 113–43.
Feenstra, R. C. and Weinstein, D. E. (2010), Globalization, markups, and the u.s. price level, Working Paper 15749, National Bureau of Economic Research.
Fontagn´e, L., von Kirchbach, F. and Mimouni, M. (2005), ‘An assessment of environmentally- related non-tariff measures’, The World Economy 28(10), 1417–1439.
Guimar˜aes, P. and Portugal, P. (2010), ‘A simple feasible procedure to fit models with high-dimensional fixed effects’, Stata Journal 10(4), 628–649.
Head, K. and Mayer, T. (2014), Gravity equations: Workhorse, toolkit, and cookbook, Vol. 4, Handbook of Interna-tional Economics, Gita Gopinath, Elhanan Helpman and Kenneth Rogoff editors, chapter 4.
Irarrazabal, A., Moxnes, A. and Opromolla, L. D. (2013), The tip of the iceberg: A quantitative framework for estimating trade costs, NBER Working Papers 19236, National Bureau of Economic Research.
Kee, H. L., Nicita, A. and Olarreaga, M. (2009), ‘Estimating trade restrictiveness indices’, Economic Journal 119(534), 172–199.
Konings, J. and Vandenbussche, H. (2013), ‘Anti-dumping protection hurts domestic exporters’, Review of World Economics149, 295–320.
Krishna, K. (1989), ‘Trade restrictions as facilitating practices’, Journal of International Economics 26(3-4), 251– 270.
Lawless, M. (2010), ‘Deconstructing gravity: trade costs and extensive and intensive margins’, Canadian Journal of Economics43(4), 1149–1172.
Martin, J. (2012), ‘Markups, quality, and transport costs’, European Economic Review 56(4), 777–791.
Mayer, T. and Ottaviano, G. (2008), ‘The happy few: The internationalisation of european firms’, Intereconomics: Review of European Economic Policy43(3), 135–148.
Melitz, M. J. (2003), ‘The impact of trade on intra-industry reallocations and aggregate industry productivity’, Econometrica71(6), 1695–1725.
Melitz, M. J. and Ottaviano, G. I. P. (2008), ‘Market size, trade, and productivity’, Review of Economic Studies 75(1), 295–316.
Moenius, J. (2004), Information versus product adaptation: The role of standards in trade, Technical report, Inter-national Business and Markets Research Center Working Paper.
Reyes, J.-D. (2011), International harmonization of product standards and firm heterogeneity in international trade, Policy Research Working Paper Series 5677, The World Bank.
Spearot, A. C. (2013), ‘Variable demand elasticities and tariff liberalization’, Journal of International Economics 89(1), 26 – 41.
6
Acknowledgements
We are grateful for helpful comments from two anonymous referees. We thank participants at the 2012 GTAP, 2012 ETSG, 2013 CESifo, 2013 EEA conferences, and the GTDW and UNCTAD workshops in Geneva. We also thank Matthieu Crozet, Javier Ocampo, Lee Ann Jackson and Gretchen Stanton. The views presented in this article are those of the authors and do not reflect the World Trade Organization. They are not meant to represent the positions or opinions of the WTO and its Members and are without prejudice to Members’ rights and obligations under the WTO. Gianluca Orefice was affiliated to the WTO in the early phases of this research project. Customs data were accessed at CEPII.
7
Tables and Figures
Table 1: A typology of SPS-related STCs. 1996-2005
All Concerns Concerns raised by the EU
Standards 84 31
Conformity Assessment 81 24
Emergency 43 16
Transparency 16 5
Other 67 20
Source: Authors’ calculations on the STC database, WTO
Figure 1: Countries that are the object of an SPS (number)
Figure 2: Products covered by an SPS (number of HS4 lines)
Source: Authors’ calculations on the STC database, WTO
Figure 3: Number of HS4 lines under STCs by maintaining country, 1996-2010
N. of HS4 under SPS by country [0,0]
(0,20] (20,1494] (1494,7837]
Table 2: The distribution of STCs by maintaining country
Concerns raised by at least one country in the world Concerns raised by the EU Maintaining Country Products Products and Products, countries Products Products and
countries and years years (1) (2) (3) (4) (5) Argentina 27 137 697 27 147 Australia 20 105 427 13 58 Austria 4 4 12 0 0 Bahrain 1 1 3 1 3 Barbados 1 1 2 0 0 Belgium 9 9 47 0 0
Bolivarian Republic of Venezuela 14 69 281 3 21
Bolivia 2 2 2 0 0 Brazil 36 66 212 28 64 Canada 25 88 570 21 200 Chile 28 35 242 0 0 China 71 90 229 70 166 Colombia 1 1 1 0 0 Costa Rica 14 14 14 0 0 Croatia 16 42 126 16 48 Cuba 4 4 11 0 0 Czech Republic 7 9 37 2 9 Egypt 1 1 6 0 0 El Salvador 21 22 31 0 0 European Union 175 1500 7837 0 0 France 5 6 30 0 0 Germany 14 154 462 0 0 Greece 8 8 8 0 0 Guatemala 2 3 3 1 1 Honduras 3 6 30 0 0 Hungary 6 6 18 0 0 Iceland 10 10 40 0 0 India 85 275 720 55 170 Indonesia 59 133 684 0 0 Israel 36 40 60 36 43 Italy 4 4 12 0 0 Japan 62 213 878 46 248 Korea 36 237 858 35 128 Kuwait 1 1 3 1 3 Mexico 6 12 38 2 6 Netherlands 4 4 12 0 0 New Zealand 7 50 228 7 24 Norway 2 2 4 0 0 Oman 1 1 3 1 3 Panama 21 83 174 14 54 Philippines 30 110 152 16 16 Poland 29 34 234 11 66 Qatar 1 1 3 1 3 Romania 15 34 132 0 0 Singapore 4 4 12 0 0 Slovak Republic 7 13 61 2 9 Slovenia 4 4 12 0 0 South Africa 3 4 20 1 8 Spain 46 221 530 0 0 Switzerland 22 118 718 0 0 Taipei 14 25 28 11 11 Thailand 2 2 2 0 0
Trinidad and Tobago 3 3 12 0 0
Turkey 20 110 871 18 144
United Arab Emirates 1 1 3 1 3
United Kingdom 10 10 10 0 0
United States 81 305 1494 67 319
Uruguay 10 20 80 0 0
Mean 19.8 77 334.9 8.7 34
Median 9.5 12.5 37.5 0 0
Source: Authors’ calculations on the STC database, WTO
Table 3: The distribution of STCs by sector (HS2), 1996-2005
Concerns raised by at least one country in the world Concerns raised by the EU
Industry Countries Countries and Countries, products Countries Countries and Countries, products product and years products and years (1) (2) (3) (4) (5) (6)
01 Live animals 13 44 613 6 26 114
02 Meat and edible meat 46 248 4105 19 127 586 03 Fish and crustaceans, molluscs and other 5 29 419 2 8 12 04 Dairy produce, birds’ eggs, natural honey 30 128 1858 11 64 332 05 Products of animal origin 6 46 911 3 33 99 06 Live trees and other plants 6 22 373 3 10 27 07 Edible vegetables and certain roots and tubers 15 121 1838 9 74 169 08 Edible fruit and nuts, peel of citrus fruit or melons 18 164 2012 6 61 162 09 Coffee, tea, mate and spices 3 30 951 0 0 0
10 Cereals 12 40 478 2 2 10
11 Products of the milling industry, malt, starches 3 11 71 0 0 0 12 Oil seeds and oleaginous fruits 1 14 126 0 0 0 13 Lac, gums, resins and other vegetable saps and extracts 3 3 44 1 1 4 15 Animal or vegetable fats and oils 7 27 1340 5 5 15 16 Preparations of meat, of fish or of crustaceans, molluscs 8 19 193 1 2 16 17 Sugars and sugar confectionery 1 4 20 0 0 0 18 Cocoa and cocoa preparations 0 0 0 0 0 0 19 Preps. of cereal, Flour Starch or Milk 0 0 0 0 0 0 20 Preps. of vegetables, fruit, nuts or other parts of plants 10 12 195 5 6 21 21 Miscellaneous edible preparations 13 23 299 7 12 54 22 Beverages, spirits and vinegar 7 7 114 4 4 24 23 Residues and waste from the food industries 6 23 174 1 1 4 30 Pharmaceutical products 1 6 648 0 0 0
31 Fertilizers 0 0 0 0 0 0
33 Essential oils and resinoids, perfumery, cosmetic 3 21 308 1 7 28 35 Aluminoidal Sub, starches, glues, enzymes 0 0 0 0 0 0 38 Miscellaneous chemical products 1 1 108 0 0 0 41 Raw hides and skins and leather 0 0 0 0 0 0 42 Articles of leather, saddlery and harness, handbags 0 0 0 0 0 0 43 Furskins and aritificial fur, manufactures 0 0 0 0 0 0 44 Wood and articles of wood, wood charcoal 5 105 2184 3 63 294 51 Wool and fine or coarse animal hair, inc. yarns,woven fabrics 0 0 0 0 0 0
54 Man-made filaments 3 3 44 1 1 4
88 Aircrafs, spacecraft and parts thereof 0 0 0 0 0 0
Source: Authors’ calculations on the STC database, WTO
Figure 4: Firm-size distribution by SPS presence
Source: Authors’ calculations on French Custom Data and the STC database, WTO Note: Firm size is approximated by total firm exports to a specific product-destination,
and appear in the graph as a deviation from the sample mean.
The null of identical distributions (Kolmogorow-Smirnov test) can be rejected at the 99% level Distribution characteristics (SPS=1): mean 0.419 std dev 2.100 min -4.58 max 7.54 Distribution characteristics (SPS=0): mean -0.002 std dev 2.042 min -10.68 max 12.54