HAL Id: inserm-00750627
https://www.hal.inserm.fr/inserm-00750627
Submitted on 11 Nov 2012
HAL is a multi-disciplinary open access
archive for the deposit and dissemination of
sci-entific research documents, whether they are
pub-lished or not. The documents may come from
teaching and research institutions in France or
abroad, or from public or private research centers.
L’archive ouverte pluridisciplinaire HAL, est
destinée au dépôt et à la diffusion de documents
scientifiques de niveau recherche, publiés ou non,
émanant des établissements d’enseignement et de
recherche français ou étrangers, des laboratoires
publics ou privés.
Stature is an essential predictor of muscle strength in
children.
Jean-Yves Hogrel, Valérie Decostre, Corinne Alberti, Aurélie Canal, Gwenn
Ollivier, Emilie Josserand, Ilham Taouil, Dominique Simon
To cite this version:
Jean-Yves Hogrel, Valérie Decostre, Corinne Alberti, Aurélie Canal, Gwenn Ollivier, et al.. Stature
is an essential predictor of muscle strength in children.. BMC Musculoskeletal Disorders, BioMed
Central, 2012, 13 (1), pp.176. �10.1186/1471-2474-13-176�. �inserm-00750627�
Stature is an essential predictor of muscle
strength in children
Hogrel et al.
Hogrel et al. BMC Musculoskeletal Disorders 2012, 13:176 http://www.biomedcentral.com/1471-2474/13/176
R E S E A R C H A R T I C L E
Open Access
Stature is an essential predictor of muscle
strength in children
Jean-Yves Hogrel
1*, Valérie Decostre
1, Corinne Alberti
2,3,4, Aurélie Canal
1, Gwenn Ollivier
1, Emilie Josserand
2,
Ilham Taouil
5and Dominique Simon
5Abstract
Background: Children with growth retardation or short stature generally present with lower strength than children of the same chronological age. The aim of the study was to establish if strength was dependent on variables related to stature in a population of healthy children and to propose practical predictive models for the muscle functions tested. A secondary aim was to test for any learning effects concerning strength measured at two successive visits by children.
Methods: Hand grip, elbow flexion and extension, and knee flexion and extension were measured by fixed dynamometry in 96 healthy subjects (47 girls and 49 boys, aged from 5 to 17 years).
Results: For the present paediatric population, muscle strength was highly dependent on height. Predictive models are proposed for the muscle functions tested. No learning effect between the first and the second visit was
detected for any of the muscle functions tested.
Conclusions: This work shows that strength measurements using fixed dynamometry are reliable in children when using appropriate standardization of operating procedures. It underlines the particular relationship between body stature and muscle strength. Predictive equations may help with assessing the neuromuscular involvement in children suffering from various disorders, particularly those affecting their stature.
Keywords: Muscle strength, Dynamometry, Children, Growth retardation Background
The increasing number of therapeutic trials for neuro-muscular diseases is generating a need for muscle strength reference values for healthy control children in order to evaluate the severity and the progression of patients' disease. Maximal voluntary isometric contrac-tion (MVIC) has previously been measured to provide normative data for healthy children. This has generally involved the handgrip function, probably because its assessment in children is simple and straightforward [1-3]. For other muscle functions, handheld dynamo-metry [3-8] and isokinetic/isometric dynamometers [9,10] have been used. Surprisingly, quantitative muscle testing (QMT), also known as fixed dynamometry, which is a reliable and sensitive method, has rarely
been used in healthy children [11] although it was the method chosen to assess primary or secondary criteria in several therapeutic trials (for instance, in Duchenne muscular dystrophy [12] and amyotrophic lateral scler-osis [13]). Several disorders are associated with delayed growth or short stature, which has rarely been consid-ered when comparing the strength of children.
Actually, muscle strength norms are mostly expressed in relation to chronological age [14]. However, as pointed out by Rauch et al. [2], chronological age may be a poor variable to account for muscle strength be-cause physical development, hence body size, is a sub-stantial determinant of strength. To overcome the limited value of chronological age for reliably predicting strength, several predictive equations have been devel-oped using additional variables, e.g. weight, height, body mass index (BMI) and sex [3,4,15]. Again, these predict-ive models mainly concern grip strength.
* Correspondence:jy.hogrel@institut-myologie.org
1Institut de Myologie, UPMC UM 76, INSERM U 974, CNRS UMR 7215, Paris
Cedex 13 75651, France
Full list of author information is available at the end of the article
© 2012 Hogrel et al.; licensee BioMed Central Ltd. This is an Open Access article distributed under the terms of the Creative Commons Attribution License (http://creativecommons.org/licenses/by/2.0), which permits unrestricted use, distribution, and reproduction in any medium, provided the original work is properly cited.
Hogrel et al. BMC Musculoskeletal Disorders 2012, 13:176 http://www.biomedcentral.com/1471-2474/13/176
Even for other muscle functions, strength values are generally presented as linear forces in kg or N. However, the actions of flexor and extensor muscles around joints generally result in angular movements. Thus, it seems more appropriate to measure flexion and extension tor-ques rather than linear forces. Torque is computed as the product between the length of the lever arm (the dis-tance between the rotation axis and the application point of the force) and the force generated perpendicularly to this lever arm. In children, torque measurement is par-ticularly relevant because lever arm length increases dur-ing growth [4].
The main aim of the study was to explore the possible relationships between the children stature and their ability to generate muscle strength expressed as torques (except for hand grip strength which is expressed in N) and to propose practical predictive models for the muscle func-tions tested, as already reported for healthy adults [16]. A secondary aim of the study was to test whether there was a learning effect concerning strength, as determined by measurements at two successive tests on children.
Methods
Participants
This study was open to healthy children of both sexes between 5 and 17 years of age. Exclusion criteria included muscle disease, treatment possibly influencing the neuromuscular system, practicing high-level sport (more than 5 hours a week in sports clubs) and occur-rence of any illness or injury during the preceding month. Subjects were recruited from relatives of the hospital personnel, relatives of patient families, and advertisements displayed in hospitals and in the publica-tions of various patient associapublica-tions. Informed consent forms were signed by children and parents. This study received the approval of the Local Ethical Committee (CPP Ile-de-France IV).
Auxological assessment
Height was measured to the nearest millimetre using a standard height gauge (SECA 216 Height Rod) and was also expressed in standard deviations (SD) with respect to French population references. Weight was measured to the nearest 0.1 kg using electronic scales (Tanita TBF-543).
Strength measurement
Strength was assessed bilaterally for five muscle func-tions: handgrip, elbow flexion and extension, and knee flexion and extension. A QMT system was used for the measurements. This system was designed to measure force production in isometric conditions. It included a wall-mounted frame, a load cell, straps for attaching the load cell to the frame and the subject, a grip dynamom-eter, an examination table and a computer for feedback
and force recording (details can be found at www.qma-system.com). The subject was placed in standardized positions on the examination table and the examiner provided appropriate stabilizations during the efforts to avoid artefactual or compensatory movements.
Elbow flexion and extension strength were assessed in the supine position with the elbow at 90° flexion at the side of the trunk, the forearm in a neutral pro-supination position. The evaluator stabilized the subject’s upper limb by holding the anterior part of the shoulder with one hand and the lateral condyle of the elbow with the other hand.
Knee flexion and extension strengths were assessed in the sitting position, with hip and knee at 90° flexion. A flat cushion was installed below the distal part of the working thigh to ensure that the segment was horizontal. For knee extension, the evaluator placed one hand on the lateral part of the subject’s knee and the other hand on the proximal part of the thigh to prevent hip rotation and extension as compensatory movements. For knee flexion, the evaluator maintained the knee with both hands placed on the anterior distal part of the thigh.
For knee and elbow flexion and extension, the lever arm length was measured at each visit to compute the maximal torque produced around the joints. The strap was placed distally on the leg or the forearm segment with the distal edge of the strap at the level of the malle-oli or the styloids, respectively. This length was mea-sured as the distance between the rotation axis of the joint and the middle of the strap, to the nearest half-cm using a flexible measuring tape. The rotation axis of the knee was considered at the middle of the lateral part of the femoro-tibial interline, while the rotation axis of the elbow was taken at the epicondyle level.
Handgrip strength was measured while the subject was seated, the elbow at 90° flexion along the side of the trunk. The height of the examination table was adjusted so that the feet were flat on the floor with hips and knees each at a 90° angle. The contralateral hand of the subject was placed on the thigh. The grip handle width was adjusted to hand size. The evaluator supported the subject’s forearm and the device.
The test order was always the same: handgrip right and left, knee extension right and left, knee flexion right and left, elbow flexion right and left, and elbow exten-sion right and left. The measurements were recorded by dedicated software (QMA computer software package).
Trials were carried out with verbal encouragement asking the subjects to provide maximal voluntary iso-metric contractions (MVIC) during about three seconds with one minute rest between trials. For each muscle function tested, if the difference between the first two measurements was below 10% of the higher value, that higher value was recorded. If not, measurements were repeated until two trials gave values with a difference
Hogrel et al. BMC Musculoskeletal Disorders 2012, 13:176 Page 2 of 9
lower than 10% of the higher value. The maximal value of two reproducible trials was recorded as the MVIC of the function. The force curves were visually checked to ensure that no overshoot or artefact was present.
Particular attention was given to making the subjects feel confident so as to help them to produce their true MVIC. Explanations were adapted to the maturity of the subject and were repeated until the child seemed to understand perfectly what was required of him/her. All measurements were performed by three examiners trained to the same operating procedures (standardized positioning procedures, lever arm measurements, verbal
instructions, curve validation and reading. . .). Reliability
between evaluators for both QMT and lever arm mea-surements was ensured before the study by a preliminary training demonstrating similar results obtained by the different evaluators on the same subjects. Statistical ana-lyses were performed without adjustment on evaluators.
Assessment of learning effects
To ensure that true MVIC was measured, a second measurement session was conducted. This second ses-sion allowed to test for learning effects, possibly arising from difficulties in understanding or shyness at first visit; it also allowed assessment of the reliability of the method. The second session took place between two days and three months after the first one.
Data and statistical analysis
Quantitative variables are reported as medians (range), and qualitative variables as frequencies (percentages). The relationship between the various muscle functions was tested using Pearson’s correlation coefficient. Normal-ity was assessed for all variables using the Kolmogorov-Smirnov statistics.
Knee and elbow flexion and extension are expressed as torque in newton.meters (N.m), and handgrip strength is expressed in newtons (N). The dominant hand side was defined as that with which the children wrote.
Paired t-tests were performed for each muscle function measured to detect any learning effect. Reliability was assessed by means of Bland-Altman plots and calculating intraclass correlation coefficients (ICC). Bland-Altman plots represent the differences between the strength
values measured during the test and retest sessions against the means of these values. It shows the amount of dis-agreement between the two measures (via the differences)
and how these differences are distributed. ICC2,1was
com-puted as a single-measure ICC with a two-way random effects model (absolute agreement). We considered coeffi-cients of 0–0.20 as 'slight', 0.21-0.40 'fair', 0.41-0.60 'mod-erate', 0.61-0.80 'substantial' and >0.80 'almost perfect'. Standard errors of measurement (SEM) were computed as the SD of the differences between test and retest values divided by the square root of two. The SEM is a measure of absolute reliability and is expressed in the actual units. Relative SEM (%) was computed as absolute SEM divided by the mean of the measure.
Reference intervals for muscle functions were esti-mated by multiple linear regression. Age, height and sex were considered for model building. The SD was esti-mated as the standard deviation of the residual of the measurement of interest from regression on all para-meters. The model fit was assessed by calculating the standard deviation scores (Z-score) as Z = (measurement – mean)/SD. The ordered Z-scores were plotted to provide a graphical check of normality using QQ-plot. The absence of heteroscedasticity was also checked by plotting Z-scores against height and age.
SPSS 15 (SPSS Inc., Chicago, IL) and SAS v9.2 (SAS Institute Inc, Cary, NC, USA) softwares were used for statistical analyses. The limit of statistical significance was set at an alpha risk of error of 0.05.
Results
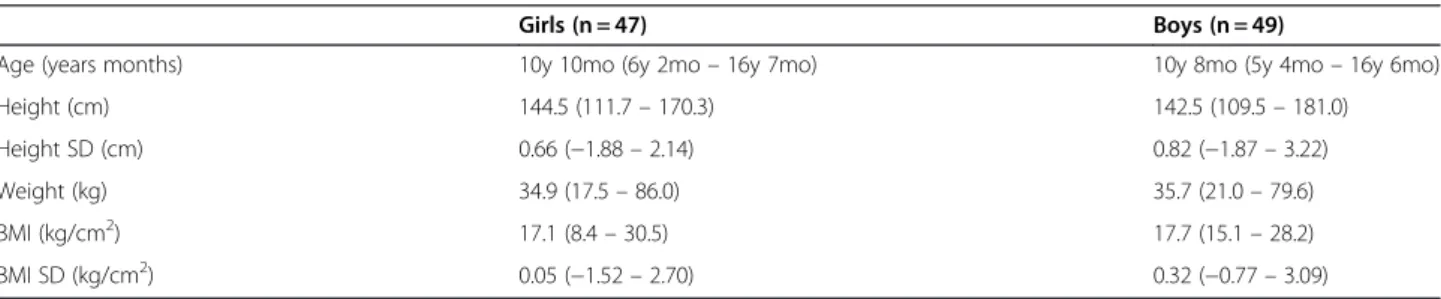
Ninety-six children (47 girls, 49 boys) were included in the study. The ages and anthropometric characteristics of this paediatric population are reported in Table 1. Eighty-seven children (90.6%) were right-handed and nine (9.4%) were left handed.
Fifty-six children attended a second testing session to evaluate a possible learning effect. The median time be-tween the two sessions was 42 days (2 – 85). No learning effect was detected: the differences between the results at the first and second visits were not significant for any of the muscle functions tested (all p > 0.05). Figure 1 pre-sents Bland-Altman plots for each muscle function for both non-dominant and dominant hand sides. The
Table 1 Characteristics of the population, reported as medians (range)
Girls (n = 47) Boys (n = 49)
Age (years months) 10y 10mo (6y 2mo – 16y 7mo) 10y 8mo (5y 4mo – 16y 6mo)
Height (cm) 144.5 (111.7 – 170.3) 142.5 (109.5 – 181.0)
Height SD (cm) 0.66 (−1.88 – 2.14) 0.82 (−1.87 – 3.22)
Weight (kg) 34.9 (17.5 – 86.0) 35.7 (21.0 – 79.6)
BMI (kg/cm2) 17.1 (8.4 – 30.5) 17.7 (15.1 – 28.2)
BMI SD (kg/cm2) 0.05 (−1.52 – 2.70) 0.32 (−0.77 – 3.09)
Hogrel et al. BMC Musculoskeletal Disorders 2012, 13:176 Page 3 of 9
differences between visit 1 and visit 2 plotted versus the mean torque for visit 1 and 2 were normally distributed and no trends were identified concerning the mean test and retest measures. The mean strength, the mean and
SD of the differences between visit 1 and visit 2, the SEM, the relative SEM, the ICC and the 95%CI for ICC for each muscle function are shown in Table 2. The rela-tive SEM was about 10 to 15% depending on the muscle
non-dominant hand side dominant hand side
handgrip elbow flexion elbow extension knee flexion knee extension -20 -15 -10 -5 0 5 10 15 20 0 20 40 60 80 mean (Nm) difference (Nm) -10 -8 -6 -4 -2 0 2 4 6 8 10 0 10 20 30 40 50 60 mean (Nm) difference (Nm) -30 -20 -10 0 10 20 30 0 20 40 60 80 100 120 mean (Nm) difference (Nm) -80 -60 -40 -20 0 20 40 60 80 0 50 100 150 200 250 mean (Nm) difference (Nm) -20 -15 -10 -5 0 5 10 15 20 0 20 40 60 80 mean (Nm) difference (Nm) -10 -8 -6 -4 -2 0 2 4 6 8 10 0 10 20 30 40 50 60 mean (Nm) difference (Nm) -30 -20 -10 0 10 20 30 0 20 40 60 80 100 120 mean (Nm) difference (Nm) -80 -60 -40 -20 0 20 40 60 80 0 50 100 150 200 250 mean (Nm) difference (Nm) -100 -80 -60 -40 -20 0 20 40 60 80 100 0 100 200 300 400 500 600 mean (N) difference (N) -100 -80 -60 -40 -20 0 20 40 60 80 100 0 100 200 300 400 500 600 mean (N) difference (N)
Figure 1 Bland-Altman plots for all muscle functions studied (n = 56 subjects).
Hogrel et al. BMC Musculoskeletal Disorders 2012, 13:176 Page 4 of 9
function. As the results obtained during the two sessions were not significantly different, the values recorded dur-ing the first visit were used to compute the predictive equations.
The strength values for handgrip (p < 0.001), elbow flexion (p < 0.001), knee flexion (p = 0.044) and knee ex-tension (p < 0.001) were all greater for the dominant than the contralateral side. This was not the case for
elbow extension although a trend was observed
(p = 0.245). The same was true for each sex separately, except for knee flexion for which only boys presented a greater strength on the dominant hand side (p = 0.020).
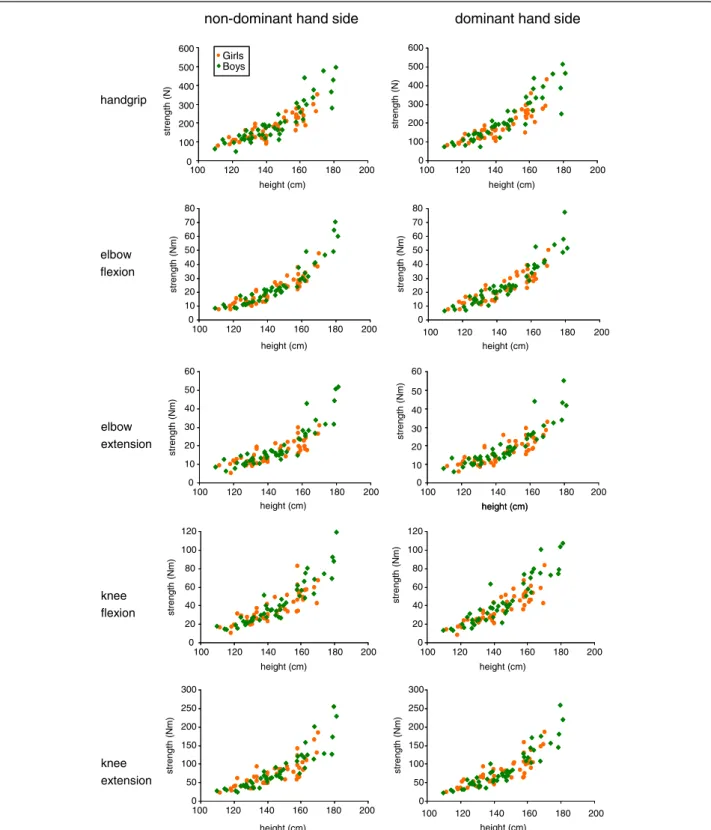
The characteristics of the predictive model based on height, sex and age for the log transform of MVIC are given in Table 3 for each muscle function. As an alterna-tive model, exponential regression may also be used to predict MVIC with height as the single explanatory vari-able (Tvari-able 4). Figure 2 presents the strength measured
for the different muscle functions as a function of height, which was the most significant explanatory vari-able for strength as assessed by multiple linear regres-sion. The strength for all muscle functions did not differ between girls and boys of the same height. Both types of model gave similar adjusted coefficients of determination (see Tables 3 and 4) although the Akaike information criteria were slightly better for the model based on height, sex and age.
Correlations between the various muscle functions were highly significant (all p < 0.001) and were between 0.870 and 0.955.
Discussion
The capacity of muscles to generate strength is one of the main features of maturation during child growth. We report paediatric strength values for quantified muscle testing with fixed myometry obtained from 96
Table 2 Test-retest reliability
Muscle function Side Mean Mean of difference SD of difference SEM Relative SEM (%) ICC ICC 95%CI
Handgrip ND 196.1 −8.4 28.9 20.4 10.4 0.949 [0.911 ; 0.971] D 211.5 −1.2 29.6 20.9 9.9 0.957 [0.926 ; 0.975] Elbow flexion ND 24.2 −0.3 3.4 2.4 10.0 0.969 [0.947 ; 0.981] D 25.7 −0.6 4.2 3.0 11.7 0.954 [0.923 ; 0.973] Elbow extension ND 19.0 −0.2 2.7 1.9 10.2 0.962 [0.936 ; 0.977] D 19.2 −0.2 3.1 2.2 11.2 0.950 [0.916 ; 0.970] Knee flexion ND 40.7 −1.5 7.3 5.2 12.7 0.945 [0.908 ; 0.968] D 41.9 −1.4 8.3 5.8 14.0 0.930 [0.884 ; 0.958] Knee extension ND 78.7 −5.3 17.1 12.1 15.4 0.945 [0.908 ; 0.968] D 84.5 −6.0 17.6 12.4 14.7 0.926 [0.870 ; 0.957]
ND: non-dominant hand side; D: dominant hand side; SD: standard deviation; SEM: standard error of measurement; ICC: intraclass correlation coefficient; CI: confidence interval.
Data are provided in N for handgrip and Nm for the other muscle functions tested (n = 56 subjects).
Table 3 Equations predicting log (MVIC) using age, height and sex as variables (n = 96 subjects)
Muscle function Side a b c d SDlog (MVIC) Adjusted R2 (Intercept) (Age coeff) (Height coeff) (Sex coeff)
Handgrip ND 2.4555 0.0501 0.0152 −0.0727 0.2120 0.781 D 2.2692 0.0416 0.0177 −0.1012 0.1925 0.826 Elbow flexion ND −0.5433 0.0298 0.0226 −0.0590 0.1603 0.894 D −0.5674 0.0317 0.0230 −0.0310 0.1840 0.870 Elbow extension ND 0.0289 0.0319 0.0170 −0.0866 0.1950 0.791 D −0.0278 0.0321 0.0175 −0.0816 0.1893 0.807 Knee flexion ND 0.4470 0.0372 0.0190 −0.0687 0.1935 0.830 D 0.2679 0.0421 0.0203 −0.1368 0.2029 0.841 Knee extension ND 0.4991 0.0182 0.0245 −0.0148 0.2251 0.809 D 0.8783 0.0487 0.0199 −0.0239 0.2085 0.838
ND: non-dominant hand side; D: dominant hand side.
Handgrip strength is expressed in N; all other muscle functions are expressed in N.m. Age is expressed in years, height in cm, sex is 1 for girls and 0 for boys. SDlog(MVIC)is the residual standard deviation of the regression. The equation takes the form: log(MVIC) = a + b.age + c.height + d.sex, where a, b, c and d are the
regression coefficients given in the table.
Hogrel et al. BMC Musculoskeletal Disorders 2012, 13:176 Page 5 of 9
children aged between 5 and 17 years. We also described equations for predicting strength of handgrip, elbow flexion and extension, and knee flexion and extension and observed that height is a major explanatory variable for muscle strength.
In previous studies, grip strength has been more ex-tensively studied than other muscle functions. The strength values we report here are consistent with previ-ous work in paediatrics for handgrip [2] and for other muscle functions tested by handheld dynamometry [4]. Child muscle strength has rarely been reported as torque, although torque is a more appropriate measure than linear force. Indeed, for the same torque, generated by the muscle during a maximal contraction for in-stance, the linear force depends on the length of the lever arm, defined as the distance between the applica-tion point of force and the rotaapplica-tion axis of the joint. Measuring the torque rather than linear force is there-fore particularly important for longitudinal studies in-volving growing children.
The literature provides evidence of substantial inter-individual variability concerning strength expressed with respect to the age. A significant part of this variability may be due to differences in height among children in a given age class. Indeed, Niempoog et al. [15] recently indicated that “chronological age alone does not reflect the pubertal stage that leads to different physical per-formance”. Height was found to be strongly correlated to grip strength in several studies [15,17]. Our study suggests that height is a major explanatory variable also for strength of muscle functions other than handgrip and is in line with Parker et al. [18]. The strong
correlations between the different muscle functions are a clue to a global effect of stature on the whole body muscle strength. We found that girls and boys cannot be overall distinguished according to strength when related to height, at least before 17 years of age. A strong rela-tionship between muscle strength and height has previ-ously been reported for pre-pubertal boys and girls [4,19] Also, the study of Newman et al. [20], implies that grip strength is similar in boys and girls under, approxi-mately, 160 cm of height. Thus below 160 cm, norms for girls and boys appear to be the same when using height as the single explanatory variable. Sartorio et al. [21] observed that “gender differences disappeared when grip strength is normalized for fat free mass in children from 5 to 15”. Since height is closely correlated to lean body mass [22,23], it is not surprising that height explains a large part of the variability between indivi-duals. Interestingly, the relationship between strength and height was accurately described by an exponential model, consistent with the observation that "lean body mass is an exponential function of height" [22].
The exponential model was also applied to linear force. Compared to torque-height relations, the mean
adjusted R2decreased from 0.825 ±0.035 down to 0.686
±0.080 due to a larger inter-individual variability that can probably be explained by a lever arm effect.
We found that the dominant hand side was signifi-cantly stronger than non-dominant hand side for both sexes for handgrip, elbow flexion (in accordance for both sexes with Bäckman et al. [6]) and knee extension (only for boys in the same study). Concerning knee flexion, we found that only boys were stronger on the dominant hand side, in contrast with Bäckman et al. [6] who found this result only for girls. However, the effect of domin-ance for this muscle function was weak: in our study, the difference between the two sides was only 1 Nm for a mean strength of about 40 Nm.
Results did not differ between the test session and the retest session. It suggests that the QMT method can be used immediately, without preliminary training, for chil-dren in clinical trials. However, a habituation session may be useful to accustom children to the assessment procedures and make them feel confident with the evaluator.
ICCs are relative measures of reliability that have been used in many studies. They are generally good to excel-lent, as in the present study, particularly because the range of the measures is generally large. However, the assessment of reliability should not be limited to the use of ICC. Standard error of measurements (SEM) is a measure of agreement and serves as an index of absolute reliability; it has been much less widely used for evalua-tions of the performance of strength assessment techni-ques. The SEM for handgrip strength was about 20 N in
Table 4 Coefficients of equations predicting log(MVIC) using height as the sole variable (n = 56 subjects)
Muscle function
Side a b SD Adjusted
R2 (Intercept) (Height coeff)
Handgrip ND 1.769 0.023 0.214 0.779 D 1.692 0.024 0.193 0.825 Elbow flexion ND −0.975 0.028 0.172 0.883 D −1.014 0.028 0.192 0.864 Elbow extension ND −0.449 0.022 0.206 0.776 D −0.501 0.023 0.201 0.791 Knee flexion ND −0.104 0.025 0.201 0.824 D −0.338 0.028 0.218 0.823 Knee extension ND 0.239 0.028 0.231 0.808 D 0.203 0.028 0.218 0.830
ND: non-dominant hand side; D: dominant hand side.
Handgrip strength is expressed in N; all other muscle function are expressed in N.m. Height is expressed in cm. SD is the residual standard deviation of the regression. The equation takes the form: log(MVIC) = a + b.height, a and b being the regression coefficients given in the table. Knowing the height of the subject, this equation can be easily used by computing the theoretical strength as: MVIC = exp(a + b.height).
Hogrel et al. BMC Musculoskeletal Disorders 2012, 13:176 Page 6 of 9
our study, while Moleenar et al. [24] reported a SEM of about 11 N. The difference may be due to the larger age range, hence the larger range of strengths, of the chil-dren in our study. Indeed, when normalized to the mean of the measurements, the relative SEMs for the two
studies are similar (10% and 9%, respectively). Meldrum et al. [25] used the same QMT measurement system with adults, and the standard error of the difference be-tween test and retest reported can be used to compute the relative SEM: the relative SEM was between 3.9 and
handgrip elbow flexion elbow extension knee flexion knee extension 0 10 20 30 40 50 60 70 80 100 120 140 160 180 200 height (cm) s tren g th (N m ) 0 10 20 30 40 50 60 100 120 140 160 180 200 height (cm) s tren g th (N m ) 0 50 100 150 200 250 300 100 120 140 160 180 200 height (cm) s tren g th (N m ) 0 40 50 60 height (cm) s tren g th (N m) 10 20 30 100 120 140 160 180 200 height (cm) 0 20 40 60 80 100 120 100 120 140 160 180 height (cm) stren g th (N m) 200 0 50 100 150 200 250 300 100 120 140 160 180 height (cm) s tren g th (N m ) 200 0 10 20 30 40 50 60 70 80 100 120 140 160 180 200 height (cm) st re n g th (N m ) 0 20 40 60 80 100 120 100 120 140 160 180 200 height (cm) stren g th (N m) Girls Boys
non-dominant hand side dominant hand side
0 100 200 300 400 500 600 100 120 140 160 180 200 height (cm) stren g th (N) 0 100 200 300 400 500 600 100 120 140 160 180 200 height (cm) stren g th (N)
Figure 2 Muscle strength related to body height for boys and girls (n = 96 subjects).
Hogrel et al. BMC Musculoskeletal Disorders 2012, 13:176 Page 7 of 9
12.8% in adults, to be compared to 9.8 to 15.1% for chil-dren in our study. This suggests lower reliability of strength measurement in children than adults possibly due to their poorer concentration or motivation through successive visits. However, strength measurement reli-ability has not yet been formally compared between chil-dren and adults.
As underlined by Jaric [26] in the field of sports medi-cine, "the primary goal of strength testing has often been to assess the objective value of muscle function inde-pendent of possible confounding factors". This is all the more true in the clinical field when the aim is to evalu-ate neuromuscular involvement in a disease. Moreover, when considering children, early or late maturation needs to be taken into account due to the direct link be-tween body stature and muscle strength. This connec-tion seems also to apply to adults as recently demonstrated by the close relationship between hand circumference, as an indicator of body stature, and grip strength [27].
In this study, we used a paediatric population aged from 5 to 17 years to develop models to predict hand-grip strength and elbow and knee flexion and extension torque. Several authors have reported strong correlations between strength and height and have proposed models linking the two variables [2,17,19]. Similarly, Van den Beld et al. [3] observed that "height proved to be a better predictor for handgrip strength than age in children aged 4–11 years".
Our paediatric population counted a rather small number of children and was not necessarily representa-tive of the general population of French children. Reli-ability was assessed by several indicators. First, there are limitations to using ICC, particularly its interpretation when the data include large inter-individual variability, which is the case for groups of children covering a wide range of growth/maturation stages. In such situations, ICC is only a rough indicator of reproducibility. Second, standard error of measurement (SEM) was used to quantify absolute agreement between test and retest values. Although our results indicate a satisfactory re-producibility between test and re-test results, some chil-dren were clearly less motivated during the second evaluation visit than the first. This behaviour could have led to an overestimation of the SEM. This also indicates that evaluation sessions for children should not be com-plicated, boring or long such that motivation and atten-tion are maintained.
We report here strength values for muscle functions in particular protocol conditions (dynamometer type, body segment positions, number of attempts, maximal value scoring). The predictive equations proposed here are re-liable only in the conditions specified. For informative comparisons, test conditions must be the same in patient
populations to be assessed and in the normative control population. Note also that the strength values were established for isometric contractions and do not apply to dynamic (concentric or eccentric) contractions. Conclusions
This work provides strength values for several muscle functions in a paediatric population. It reveals the direct relationship between body height, hence physical matur-ation, and the strength generation capacity of children. Thus, as muscle strength depends on stature, chrono-logical age should not be used as a single variable to pre-dict normal strength. The prepre-dictive equations we report here could be used to evaluate muscle strength loss in children suffering from chronic disease, as possible growth retardation due to the disease can be taken into account. Short stature can be observed in diseases affect-ing directly body stature (genetic disorders, hormonal deficiency), in the case of prolonged pharmacological treatment such as glucocorticoid therapy or in the case of malnutrition or mistreatment. As a clinical applica-tion, the present work will help in assessing the effect of growth hormone on steroid myopathy in children with chronic diseases.
Abbreviations
MVIC: Maximal voluntary isometric contraction; QMT: Quantitative Muscle Testing; ICC: Intraclass Correlation Coefficient; SEM: Standard error of measurement.
Competing interests
The authors declare that they have no competing interest. Authors’ contributions
JYH designed the experiments, analysed the data and drafted the manuscript. VD, AC and GO performed the experiments and drafted the manuscript. CA and EJ analysed the data and drafted the manuscript. IT organized the experiments, analysed the data and drafted the manuscript. DS was the principal investigator of the study and designed the
experiments, analysed the data and drafted the manuscript. All authors read and approved the final version of the manuscript.
Acknowledgments
This study was supported by the Association Française contre les Myopathies (AFM) and grants from Pfizer. None was involved in the study design, data collection, manuscript preparation and publishing decisions. We express our gratitude to the children willing to participate in the study.
Author details
1Institut de Myologie, UPMC UM 76, INSERM U 974, CNRS UMR 7215, Paris
Cedex 13 75651, France.2AP-HP, Hôpital Robert Debré, Unité d’Epidémiologie Clinique, Paris 75019, France.3Université Paris Diderot,
Sorbonne Paris Cité, Paris 75019, France.4Inserm, CIE 5, Paris 75019, France.
5
AP-HP, Hôpital Robert Debré, Service d’Endocrinologie Pédiatrique, Paris 75019, France.
Received: 13 April 2012 Accepted: 13 September 2012 Published: 18 September 2012
References
1. Hager-Ross C, Rosblad B: Norms for grip strength in children aged 4– 16 years. Acta Paediatr 2002, 91(6):617–625.
2. Rauch F, Neu CM, Wassmer G, Beck B, Rieger-Wettengl G, Rietschel E, Manz F, Schoenau E: Muscle analysis by measurement of maximal isometric
Hogrel et al. BMC Musculoskeletal Disorders 2012, 13:176 Page 8 of 9
grip force: new reference data and clinical applications in pediatrics. Pediatr Res2002, 51(4):505–510.
3. van den Beld WA, van der Sanden GA, Sengers RC, Verbeek AL, Gabreels FJ: Validity and reproducibility of hand-held dynamometry in children aged 4–11 years. J Rehabil Med 2006, 38(1):57–64.
4. Eek MN, Kroksmark AK, Beckung E: Isometric muscle torque in children 5 to 15 years of age: normative data. Arch Phys Med Rehabil 2006, 87(8):1091–1099.
5. Hosking JP, Bhat US, Dubowitz V, Edwards RH: Measurements of muscle strength and performance in children with normal and diseased muscle. Arch Dis Child1976, 51(12):957–963.
6. Backman E, Odenrick P, Henriksson KG, Ledin T: Isometric muscle force and anthropometric values in normal children aged between 3.5 and 15 years. Scand J Rehabil Med 1989, 21(2):105–114.
7. Crompton J, Galea MP, Phillips B: Hand-held dynamometry for muscle strength measurement in children with cerebral palsy. Dev Med Child Neurol2007, 49(2):106–111.
8. Stuberg WA, Metcalf WK: Reliability of quantitative muscle testing in healthy children and in children with Duchenne muscular dystrophy using a hand-held dynamometer. Phys Ther 1988, 68(6):977–982. 9. Holm I, Fredriksen P, Fosdahl M, Vollestad N: A normative sample of
isotonic and isokinetic muscle strength measurements in children 7 to 12 years of age. Acta Paediatr 2008, 97(5):602–607.
10. Wood LE, Dixon S, Grant C, Armstrong N: Elbow flexion and extension strength relative to body or muscle size in children. Med Sci Sports Exerc 2004, 36(11):1977–1984.
11. Escolar DM, Henricson EK, Mayhew J, Florence J, Leshner R, Patel KM, Clemens PR: Clinical evaluator reliability for quantitative and manual muscle testing measures of strength in children. Muscle Nerve 2001, 24(6):787–793.
12. Buyse GM, Goemans N, Henricson E, Jara A, van den Hauwe M, Leshner R, Florence JM, Mayhew JE, Escolar DM: CINRG pilot trial of oxatomide in steroid-naive Duchenne muscular dystrophy. Eur J Paediatr Neurol 2007, 11(6):337–340.
13. Wong B, Hynan L, Iannaccone S, the American Spinal Muscular Atrophy Randomized Trials (AmSMART) Group: A randomized, placebo-controlled trial of creatine in children with Spinal Muscular Atrophy. J Clin Neuromusc Dis2007, 8(3):101–110.
14. Molenaar HM, Selles RW, Zuidam JM, Willemsen SP, Stam HJ, Hovius SE: Growth diagrams for grip strength in children. Clin Orthop Relat Res 2010, 468(1):217–223.
15. Niempoog S, Siripakarn Y, Suntharapa T: An estimation of grip strength during puberty. J Med Assoc Thai 2007, 90(4):699–705.
16. Hogrel JY, Payan CA, Ollivier G, Tanant V, Attarian S, Couillandre A, Dupeyron A, Lacomblez L, Doppler V, Meininger V, Tranchant C, Pouget J, Desnuelle C: Development of a French isometric strength normative database for adults using quantitative muscle testing. Arch Phys Med Rehabil2007, 88(10):1289–1297.
17. Jurimae T, Hurbo T, Jurimae J: Relationship of handgrip strength with anthropometric and body composition variables in prepubertal children. Homo2009, 60(3):225–238.
18. Parker DF, Round JM, Sacco P, Jones DA: A cross-sectional survey of upper and lower limb strength in boys and girls during childhood and adolescence. Ann Hum Biol 1990, 17(3):199–211.
19. Semproli S, Brasili P, Toselli S, Ventrella AR, Jurimae J, Jurimae T: The influence of anthropometric characteristics to the handgrip and pinch strength in 6-10-year old children. Anthropol Anz 2007, 65(3):293–302. 20. Newman DG, Pearn J, Barnes A, Young CM, Kehoe M, Newman J: Norms for
hand grip strength. Arch Dis Child 1984, 59(5):453–459.
21. Sartorio A, Lafortuna CL, Pogliaghi S, Trecate L: The impact of gender, body dimension and body composition on hand-grip strength in healthy children. J Endocrinol Invest 2002, 25(5):431–435. 22. Forbes GB: Relation of lean body mass to height in children and
adolescents. Pediatr Res 1972, 6(1):32–37.
23. Luna-Heredia E, Martin-Pena G, Ruiz-Galiana: Handgrip dynamometry in healthy adults. Clin Nutr 2005, 24:250–258.
24. Molenaar HM, Zuidam JM, Selles RW, Stam HJ, Hovius SE: Age-specific reliability of two grip-strength dynamometers when used by children. J Bone Joint Surg Am2008, 90(5):1053–1059.
25. Meldrum D, Cahalane E, Keogan F, Hardiman O: Maximum voluntary isometric contraction: investigation of reliability and learning effect. Amyotroph Lateral Scler Other Motor Neuron Disord2003, 4(1):36–44. 26. Jaric S: Muscle strength testing: use of normalisation for body size. Sports
Med2002, 32(10):615–631.
27. Li K, Hewson DJ, Duchene J, Hogrel JY: Predicting maximal grip strength using hand circumference. Man Ther 2010, 15(6):579–585.
doi:10.1186/1471-2474-13-176
Cite this article as: Hogrel et al.: Stature is an essential predictor of muscle strength in children. BMC Musculoskeletal Disorders 2012 13:176.
Submit your next manuscript to BioMed Central and take full advantage of:
• Convenient online submission
• Thorough peer review
• No space constraints or color figure charges
• Immediate publication on acceptance
• Inclusion in PubMed, CAS, Scopus and Google Scholar
• Research which is freely available for redistribution
Submit your manuscript at www.biomedcentral.com/submit
Hogrel et al. BMC Musculoskeletal Disorders 2012, 13:176 Page 9 of 9