HAL Id: inserm-00573856
https://www.hal.inserm.fr/inserm-00573856
Submitted on 5 Mar 2011HAL is a multi-disciplinary open access archive for the deposit and dissemination of sci-entific research documents, whether they are pub-lished or not. The documents may come from
L’archive ouverte pluridisciplinaire HAL, est destinée au dépôt et à la diffusion de documents scientifiques de niveau recherche, publiés ou non, émanant des établissements d’enseignement et de
Simultaneous MEG and intracranial EEG recordings
during attentive reading.
Sarang Dalal, Sylvain Baillet, Claude Adam, Antoine Ducorps, Denis
Schwartz, Karim Jerbi, Olivier Bertrand, Line Garnero, Jacques Martinerie,
Jean-Philippe Lachaux
To cite this version:
Sarang Dalal, Sylvain Baillet, Claude Adam, Antoine Ducorps, Denis Schwartz, et al.. Simultaneous MEG and intracranial EEG recordings during attentive reading.. NeuroImage, Elsevier, 2009, 45 (4), pp.1289-304. �10.1016/j.neuroimage.2009.01.017�. �inserm-00573856�
Simultaneous MEG and intracranial EEG
recordings during attentive reading
Sarang S. Dalal
a, Sylvain Baillet
b, Claude Adam
b,
Antoine Ducorps
b, Denis Schwartz
b, Karim Jerbi
a,c,
Olivier Bertrand
a, Line Garnero
b, Jacques Martinerie
b,
Jean-Philippe Lachaux
a,baDynamique C´er´ebrale et Cognition, INSERM Unit´e 821, Lyon, France; Institut
F´ed´eratif des Neurosciences, Lyon, France; Universit´e Lyon 1, France
bLaboratoire de Neurosciences Cognitives et Imagerie C´er´ebrale, CNRS
UPR640-LENA, Hˆopital de la Salpˆetri`ere, Paris, France; UPMC Univ. Paris 06,
Paris, France
cLaboratoire de Physiologie de la Perception et de l’Action, CNRS UMR 7152,
Coll`ege de France, Paris, France
Abstract
The relationship between neural oscillations recorded at various spatial scales re-mains poorly understood partly due to an overall dearth of studies utilizing si-multaneous measurements. In an effort to study quantitative markers of attention during reading, we performed simultaneous magnetoencephalography (MEG) and intracranial EEG (iEEG) recordings in four epileptic patients. Patients were asked to attend to a specific color when presented with an intermixed series of red words and green words, with words of a given color forming a cohesive story. We analyzed alpha, beta, and gamma band oscillatory responses to the word presentation and compared the strength and spatial organization of those responses in both elec-trophysiological recordings. Time-frequency analysis of iEEG revealed a network of clear attention-modulated high gamma band (50–150 Hz) power increases and alpha/beta (9–25 Hz) suppressions in response to the words. In addition to analy-ses at the sensor level, MEG time-frequency analysis was performed at the source level using a sliding window beamformer technique (Dalal et al., 2008). Strong al-pha/beta suppressions were observed in MEG reconstructions, in tandem with iEEG effects. While the MEG counterpart of high gamma band enhancement was diffi-cult to interpret at the sensor level in two patients, MEG time-frequency source reconstruction revealed additional activation patterns in accordance with iEEG re-sults. Importantly, iEEG allowed us to confirm that several sources of gamma band modulation observed with MEG were indeed of cortical origin rather than EMG or ocular artifact.
electroencephalography, electrocorticography, epilepsy surgery, gamma band, source localization, beamformer
1 Introduction
An increasing body of evidence gathered over the last fifteen years suggests that most cognitive functions, from sensory and motor processing to language or memory, involve the formation of local neural assemblies characterized by synchronous oscillations in the gamma band, i.e., at frequencies starting at 40 Hz (for reviews, see Singer, 1999; Tallon-Baudry and Bertrand, 1999). In-terestingly, the formation of such assemblies seems to depend upon the degree of attention allocated by subjects or animals to the task at hand (Bauer et al., 2006; Bichot et al., 2005; Fries et al., 2001; Gruber et al., 1999; Steinmetz et al., 2000; Tallon-Baudry et al., 2005), which suggests that monitoring gamma band activity could provide a quantitative measure reflecting attention. Indeed, in a recent intracerebral EEG study, which manipulated explicitly the attention of subjects in a verbal working memory task, we found that gamma band re-sponses were stronger for attended stimuli, later recalled, than for unattended ones (Mainy et al., 2007).
We have all experienced the effect of attention fluctuations on performance in the context of reading, sometimes having the sensation of “flying over” entire pages without truly absorbing their meaning. The previously mentioned studies led us to hypothesize that it may be possible to monitor the degree of attention during reading by measuring the spectral power in the alpha, beta, and gamma bands. Testing this hypothesis in healthy individuals assumes that attention-related power modulations in the lower alpha and beta bands as well as those in the gamma band can be detected with noninvasive recordings such as MEG or scalp level EEG. The present study tackles this issue by investigating the degree and precision by which gamma band power (and to a lesser extent, alpha and beta band) modulations of cortical activity can be recovered at the scalp level in individual subjects during attentive reading. The ability of surface-level electrophysiological measurements to detect gamma band responses (GBR) is still a matter of debate. Although it has been more than a decade since the first reports of gamma band power modulations at t he scalp level with EEG (e.g., Tallon-Baudry et al., 1996; Tallon-Baudry
and Bertrand, 1999; Rodriguez et al., 1999; M¨uller et al., 2000), with MEG
reports arriving more recently (e.g., Kaiser et al., 2002, 2004; Osipova et al., 2006; Vidal et al., 2006; Guggisberg et al., 2008; Dalal et al., 2008a), those
responses have mostly been detected through population-level statistics. The relatively limited number of such reports has so far impeded the use of GBR as a research or clinical index even though increasing results from intracranial EEG suggest that high gamma band modulations could be used as functional markers (Lachaux et al., 2005, 2006; Sederberg et al., 2003; Szurhaj et al., 2005; Tallon-Baudry et al., 2005; Tanji et al., 2005) tightly related to task-related hemodynamic variations measured by fMRI (Kim et al., 2004; Niessing et al., 2005; Lachaux et al., 2007). In contrast, other important electrophysiological indices such as the N100 evoked potential and mismatch negativity (MMN) are routinely used for both research and clinical purposes. The absence of GBR from clinical use thus cannot be fully explained by the younger age of the field and certainly not to a lack of interest by the EEG/MEG community; more likely, it is due to acknowledged methodological difficulties associated with extracting gamma response components from noninvasive recordings (Trujillo et al., 2005; Hoogenboom et al., 2006).
Moreover, the failure to detect EEG/MEG GBR in a given subject can be a source of confusion. For example, the technical limitations of EEG/MEG could have prevented detection, due to a low signal to noise ratio in the gamma band or insufficient spatial resolution. Alternatively, it could have been the result of individual subject differences. For example, a subject may have employed a different strategy or been less attentive than the others, and therefore em-ployed different cortical mechanisms that may not have involved GBR. To evaluate our ability to noninvasively recover cortical GBR, and their mod-ulation by attention during reading, we designed an experiment to simultane-ously record MEG and intracerebral EEG (iEEG) responses in epileptic pa-tients implanted with depth electrodes and subdural strips for clinical reasons. Such simultaneous recordings provided a unique way to compare the spectral content of the scalp traces of GBR, as well as lower-frequency modulations, to those recorded directly from the cortex via the implanted depth electrodes. It was considered more advantageous to record iEEG simultaneously with MEG as opposed to scalp EEG, due to the difficulty recording from EEG electrode caps in patients with intracerebral electrodes, as well as the likely considerable changes in electric field propagation caused by the implants and craniotomies (Kirchberger et al., 1998).
We simultaneously recorded both MEG and iEEG data in four patients while they performed a simple reading task with variable levels of attention de-pending on instructions on whether to attend to the narratives formed by the words. In addition to being a proof of concept of simultaneous MEG and iEEG data acquisition, this study presents and discusses the MEG correlates of strong intracerebral alpha, beta, and gamma power modulations generated by word stimuli in temporal, occipital, and parietal lobes. The experimental design is the same used in a comprehensive iEEG study from our group (Jung
et al., 2008), and originally implemented by Nobre et al. (1998) for an fMRI experiment.
Previous human studies have described simultaneous acquisition of MEG and iEEG to evaluate high-amplitude epileptiform spikes (Mikuni et al., 1997; Sutherling et al., 2001; Shigeto et al., 2002; Oishi et al., 2002). However, to our knowledge, this experiment comprises the first successful simultaneous recordings to study cognitive function.
2 Methods
2.1 Subjects
Simultaneous MEG and iEEG recordings were obtained from four patients with intractable epilepsy (referred to as Pt1–Pt4) who were candidates for resective surgery. Table 1 summarizes their clinical, neuroimaging, and video-EEG characteristics. Intracranial electrodes were implanted in these patients for preresection seizure localization and functional mapping of critical lan-guage and motor areas. Electrode implants were guided strictly by clinical indications and research recordings were approved by the local institutional review board. Upon informed consent, the experiments were conducted while each patient was alert and on minimal medication. All patients were implanted with depth electrodes and, in the case of Pt1, additionally with subdural strips placed on the cortical surface. Depth electrodes were inserted stereotactically through the aid of a Leksell frame using an “orthogonal” approach; electrode strips were placed via burr holes, also precisely positioned using sterotactic coordinates (Dormont et al., 1997). The brain regions explored were bilateral temporal in Pt1, the whole right temporal lobe with its basal and posterior part in Pt2, the whole left temporal lobe with its junction to the occipital and parietal lobes in Pt3, and anterior temporal and frontal regions in the right hemisphere of Pt4.
2.2 Electrode implantation
Each patient was implanted with 7 to 9 linear electrode arrays. Each depth electrode array had a diameter of 1 mm. Both depth electrode arrays and subdural strips contained 4 to 8 cylindrical contacts of 2.3 mm length, 10 mm apart center-to-center (Ad-Tech Medical, Racine, WI, USA). Therefore, var-ious mesial and lateral cortical areas were evaluated, including sulcal cortex. A total of 174 sites were recorded from the four patients, with 68 in the left
Table of Patient Characteristics Patient Gender/
Age
Surface Video-EEG (seizure onset)
MRI Intracranial Location of Seizure Onset
Surgical Outcome (Engel’s class*) Pt1 F/33 R and L temporal n.l. R and L neocortical
temporal (MTG) not resected Pt2 F/28 R temporal (mostly anterior) n.l. R mid-temporal basal IIIa Pt3 M/45 L posterior tempo-ral and occipital
n.l. L posterior temporal basal
IV
Pt4 M/39 R anterior frontal and temporal
n.l. R temporal pole not resected Table 1
Abbreviations: L= left; R = right; MTG = middle temporal gyrus; n.l.= no lesion. *from Engel (1987)
hemisphere and 106 in the right hemisphere. The electrode contacts were iden-tified directly on the patients’ MRI, then segmented and 3D-rendered using BrainVisa (http://brainvisa.info) and in-house MATLAB code.
2.3 Paradigm
An experimental paradigm similar to Nobre et al. (1998) was used, modified with slightly longer interstimulus intervals to adjust for the late latencies of the attentional modulations reported in that study. In each block of the ex-periment, the subjects were presented with 400 words shown individually at a rapid rate (words presented for 100 ms with an interstimulus interval of 800±100 ms) on a black computer screen. 200 words were presented in green and the other 200 presented in red, with words of a given color forming a meaningful and simple short story in French. The subjects were instructed to read the story presented with a specified target color and be prepared to an-swer questions about the narrative after the block. The distribution of colors within the 400-word series was randomized, so that subjects could not predict whether or not the subsequent word was to be attended; the randomization was constrained to avoid series of more than 3 consecutive words with the same color. There were 6 blocks in total, and the target color was varied between blocks.
After each block, subjects were asked questions about the relevant story that could not have been answered from general knowledge. They were also asked to recount the presented story to the best of their ability. The analysis compared brain responses to attended words (i.e., words of the target color: TARGETS) versus brain responses to unattended words (i.e., words of the non-target color: DISTRACTORS).
The experimental procedure took place in the shielded MEG testing room. Stimuli were presented to the participants on a 17” computer screen at a
90 cm viewing distance, and the average word subtended 3◦ of visual angle.
Note that this particular paradigm had several important advantages for the present study: a) it was short (less than 30 minutes) and could fit in the tight MEG experimental schedule of the patients, b) it provided a large number of trials during that short time window, typically yielding over 200 trials for each condition, even after removing trials contaminated by artifacts such as epileptiform spikes or eye blinks, c) it was interesting for the patients and well-suited to maintain their attention, despite the large number of trials, d) finally, the task involved a widely distributed cortical network, which could likely be captured via a variety of implantation schemes, in contrast with, e.g., a purely motor task whose activated network could have only been studied in patients with motor cortex implants.
2.4 Recording and data analysis
2.4.1 MEG Recordings
The experiment was conducted at the Centre MEG of the Hˆopital de la Salpˆetri`ere, Paris, France. MEG recording was performed using a whole-head MEG system (VSM MedTech, Coquitlam, BC, Canada) with 151 radial gra-diometers over the scalp and 29 reference gragra-diometers and magnetometers for ambient field correction. Signals were digitized at a sampling rate of 1250 Hz (0–200 Hz bandwidth) during epochs lasting 5 s, beginning 1 s prior to stimu-lus onset. Eye movements were monitored with four ocular electrodes (Viasys Healthcare, Madison, WI, USA). Trials were rejected offline for eye blinks, eye movements, head movement, muscular, epileptiform, or electromagnetic arti-facts. MEG data were coregistered with the structural MRI of each patient using BrainStorm (http://neuroimage.usc.edu/brainstorm).
2.4.2 Intracerebral EEG recordings
Intracerebral recordings were conducted using an EEG monitoring system (Micromed, Treviso, Italy), which allowed the simultaneous recording of 63 iEEG channels sampled at 1024 Hz (0.1–200 Hz bandwidth) during the ex-perimental paradigm. A contact site in white matter was chosen as the ref-erence electrode in each patient. This refref-erence was ensured to have similar impedance to the other contact sites; in addition, it was verified to be free of contamination from eye movement artifacts and electromyographic activity from subtle muscle contractions. However, all electrodes were re-referenced to an adjacent electrode (1 cm away) to form a bipolar montage. We used
this montage to enhance the spatial resolution of the recordings and to ensure that the recorded activity was generated locally to the electrodes. In total, there were 44 such bipolar pairs for Pt1, 14 for Pt2, 27 for Pt3, and 23 for Pt4. Recording sites showing epileptiform activities were excluded from the analysis, and among the remaining sites, monopolar, and bipolar data were systematically inspected (first unfiltered, then highpass filtered at 15 Hz), and any trial showing epileptic spikes in any of those traces was discarded. Note that this highpass filtering was done only for artifact rejection; all analyses shown in this paper were done with the raw, unfiltered signals.
Prior to signal analysis, all trials were sorted into two categories: targets (words to be attended) and distractors (words not to be attended) irrespective of their colors. In the final dataset after artifact rejection, we adjusted the size of the trial sets so that each trial category (target and distractor) would contain an equal number of red and green words.
2.4.3 Evoked response analysis
Evoked potentials and fields were computed by averaging each channel over all the trials of a given type (target or distractor), subtracting the mean of
the baseline of period of −200 to−50 ms.
2.4.4 Time-frequency analysis
For each single trial, bipolar derivations computed between adjacent electrode contacts were analyzed in the time-frequency (TF) domain by convolution with complex Morlet’s wavelets (Tallon-Baudry et al., 1996), thus providing a
TF power map P (t, f ) = |w(t, f) ∗ s(t)|2
, where for each time t and frequency
f , w(t, f ) was a complex Morlet’s wavelet w(t, f ) = A e−t2/2σ2t e2πif t, with
A = (σt√π)−1/2 and σt= (27πf )−1.
2.5 Statistical analysis
2.5.1 Comparison with baseline level within a single condition
For a given stimulus type (targets or distractors), significant spectral energy modulations (SSEM) caused by the stimuli (i.e., energy increase or decrease relative to pre-stimulus level) were detected using Wilcoxon matched paired nonparametric tests. We compared the total energy in a given time-frequency window with that of a tile of the same frequency extent across trials, but
covering a [−200 to −50 ms] pre-stimulus baseline period. The result of a
baseline for the chosen time-frequency tile. Wilcoxon tests were also used to draw statistical TF maps of Z values representing the effects of stimulation in
multiple adjacent [40 ms × 8 Hz] TF tiles covering a large [−200 to 600 ms]
× [1–200 Hz] TF domain) (see Figures 2–6): such maps allow the direct visu-alization of SSEM in time and frequency for a given recording site. Z values can be directly converted into p values to quantify the risk associated with rejecting the null hypothesis of no change relative to baseline (p being only function of Z, independent of the number of trials). To correct for multiple testing (number of sites × number of non-overlapping TF tiles), we applied
a Bonferroni correction yielding p values for significance less than 3 × 10⁻⁶
(Pt1), 9 × 10⁻⁶ (Pt2), 5 × 10⁻⁶ (Pt3), and 6 × 10⁻⁶ (Pt4).
Since our goal was to test whether iEEG SSEM were visible in MEG, our strat-egy for analysis of MEG data consisted of 1 ) defining, from the previous anal-ysis, TF windows with iEEG SSEM, and then 2 ) for those TF windows, test at each MEG sensor whether the MEG energy level was different from base-line level using Wilcoxon matched paired nonparametric tests. The outcome of the iEEG analysis (see Results) led us to investigate SSEM in MEG data in
two TF windows ([+
200 to+
500 ms] × [9–25 Hz] for alpha/beta suppressions
(ABS) and [+
100 ms to+
400 ms] × [50–100 Hz] for GBR). Wilcoxon tests were performed with and without Bonferroni correction [uncorrected threshold of p = 0.05, and corrected threshold of p = 0.05/(2 × 151) to account for 2 TF windows and 151 sensors].
2.5.2 Comparison between responses to targets and distractors
Differences between responses to targets and distractors were evaluated statis-tically in the TF plane using Mann-Whitney nonparametric tests using ELAN Pack, EEG/MEG analysis software developed by the INSERM U821 labora-tory (http://www.lyon.inserm.fr/821/). For MEG data, there was one test for each sensor and each of the two TF windows defined above, again with two sig-nificance thresholds: uncorrected p = 0.05, and corrected p = 0.05/(2 × 151). For iEEG data, there was one test for each recording site and each of the two TF windows defined above, with significance thresholds of p = 0.05 uncor-rected, and p = 0.05/M coruncor-rected, where M is the number of recording sites (M = 44 for Pt1, 14 for Pt2, 27 for Pt3, and 23 for Pt4).
2.5.3 Cross-sites synchrony analysis
Cross-sites synchrony was evaluated using wavelet-based estimation measur-ing the degree of phase-lockmeasur-ing between certain spectral components of the response (alpha, beta, and gamma responses) (Lachaux et al., 2002). In short, the analysis extracts the time course of the instantaneous phase-difference
be-tween two signals in each trial around a frequency of interest (as computed using Morlet’s wavelets), and estimates the circular variance of that difference on a sliding window the duration of which depends on the analyzed frequency (8 cycles of oscillations). This circular variance is a time-varying measure of phase-locking between 0 (no phase-locking) and 1 (complete synchrony) which is averaged across trials to provide an average measure of synchrony between signals.
2.5.4 GBR dipole moment estimation
The dipole moment of GBR sources detected with iEEG was coarsely esti-mated via a standard source-field model and the Hilbert transform. First, for each single trial, the bipolar iEEG data was bandpass filtered to 50–100 Hz (100–150 Hz for Pt4) and Hilbert transformed to extract the GBR envelope. These envelopes were then averaged across trials. The maximum value over the 300–700 ms interval for each bipolar channel was then noted.
The relationship between recorded voltage and dipole moment is given by the following equation (Malmivuo and Plonsey, 1995):
Φ ≈ p cos θ4πσr2, (1)
where Φ is the measured voltage potential at a given electrode, p is the dipole moment, r is the distance between the dipole and electrode, θ is the angle between the dipole axis and the electrode location, and σ is the tissue conduc-tivity. For the purpose of this estimate, we assume that a bipolar iEEG pair records a dipole located at the midpoint between the two locations and ori-ented along their axis (i.e., r = 5 mm and θ = 0). Then, applying Equation 1 to the difference of the two (opposite) voltages:
Φ1− Φ2 ≈
2p
4πσ(0.005)2 (2)
Finally, rearranging to solve for the dipole moment p, we obtain:
p ≈ 2πσ(0.005)2
(Φ1 − Φ2) (3)
We use σ = 0.285 S/m, from the in vivo conductivity of human gray matter reported by Latikka et al. (2001).
2.5.5 MEG source reconstruction
We used NUTMEG (Dalal et al., 2004) to perform MEG source reconstruc-tion. A multisphere head model (Huang et al., 1999) was computed for each patients’ sensor configuration and head geometry.
The timecourses of the neural generators of the evoked fields were recon-structed using a minimum variance beamformer (Van Veen et al., 1997). Beam-former weights were computed from the sample covariance of the unaveraged data and subsequently applied to the averaged sensor data to yield timecourses over a grid of voxels spanning the head volume. The results near electrode lo-cations were compared with intracranial ERPs to assess data quality.
Separately, the oscillatory dynamics of the sources were reconstructed using a related time-frequency beamformer technique (Dalal et al., 2008a). This method outputs a spectrogram for each of the voxels spanning the head vol-ume. The power bands chosen were 4–9 Hz, 9–25 Hz, 25–45 Hz, 55–95 Hz, 105–145 Hz, and 155–195 Hz. The power line frequency of 50 Hz and its harmonics at 100 Hz and 150 Hz were avoided to reduce noise. As with the iEEG and sensor MEG spectrograms, post-stimulus power modulations were contrasted relative to the baseline period using Wilcoxon Z-scores.
2.5.6 MEG sensitivity
Finally, the multisphere head model was applied in order to estimate the sen-sitivity of MEG to locations probed with intracranial electrodes using the following procedure: A simulated unit dipole was placed at the midpoint be-tween each bipolar electrode pair. As the orientation of sources detected with iEEG is generally uncertain – yet has a profound impact on MEG signal – we
simulated a distribution of orientations, from − π
2 to +π
2 radians of elevation
and −π to +π radians of azimuth, sampled every π
36 radians. The head model
was used to calculate the theoretical MEG sensor distribution for each orien-tation at each brain location. The estimated magnetic fields for each sensor were then normalized by the maximum magnetic field (generated by a unit dipole anywhere in the brain) that could be detected by that sensor, yield-ing relative sensitivity (Malmivuo and Plonsey, 1995). Finally, for each dipole orientation at each brain location, the maximum relative sensitivity (i.e., the relative sensitivity at the most sensitive MEG sensor) was determined.
3 Results
3.1 Evoked potentials and fields
Figure 1 displays the event-related fields (MEG ERFs), beamformer source reconstructions, and potentials (iEEG ERPs) obtained by averaging directly the raw MEG and iEEG signals across trials for each condition. At all three levels of recording, evoked responses were clear and reproducible across
condi-tions, with perhaps Pt2’s source reconstruction suffering from increased noise. Intracerebral ERPs measured directly in the occipital and temporal lobes are shown together with the corresponding MEG scalp topographies, and the ERF trace at the sensor showing maximal response, for each patient and for both targets and distractors. In patients Pt1, Pt3, and Pt4, two consecutive bipo-lar pairs recorded ERPs with opposite pobipo-larities, indicating local sources. In all four patients, the MEG topography at the peak latency showed a clear amplitude peak over occipital sensors, consistent with the occipito-temporal responses found in iEEG.
3.2 Stimulus-induced spectral energy modulations
To compare oscillatory responses at the cortical and MEG level, we used a simple two-step strategy: a) use iEEG data to detect possible alpha, beta, and gamma band responses at the cortical level, and b) test for similar effects at the sensor level, at the same latencies and frequency range. At both levels, responses were defined as significant energy increases or decreases relative to
the [−200 to−50 ms] pre-stimulus baseline (using Wilcoxon tests, as explained
in the Methods section).
3.2.1 iEEG recordings
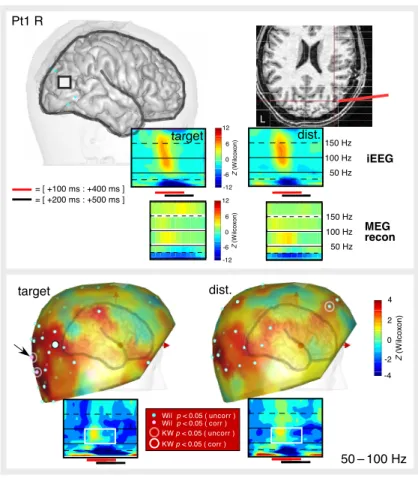
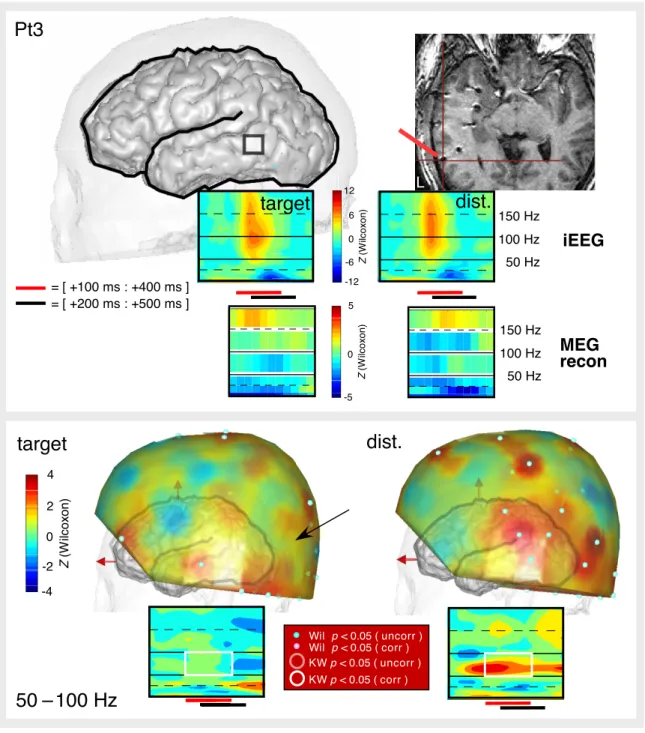
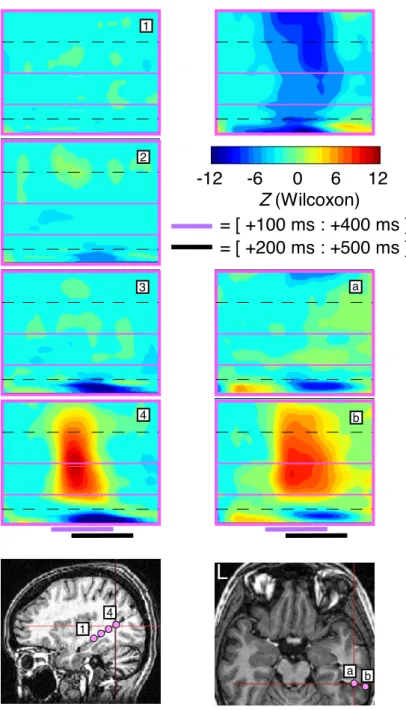
Clear gamma band responses (GBRs) to target words were observed in all four patients, distributed over the temporal, occipital, and parietal cortex, in both hemispheres (note that there were no electrodes in the frontal lobes) (Pt1: GBR in 14 out of 44 bipolar pairs; Pt2: 1/14; Pt3: 3/27; Pt4: 2/23) (see Figures 2–6 and S1 for the precise locations of GBRs for target words on indi-vidual 3D MRI renderings). The time and frequency extents of those responses were remarkably consistent across sites and patients with their highest energy concentrated in the [100–400 ms] time window. Some of those responses (Pt1: 6/14; Pt2: 0/1; Pt3: 2/3; Pt4: 0/2) were stronger for targets than for distrac-tors (KW, p < 0.05, corrected), while the reverse effect did not occur. Also, we found no cortical site producing GBRs solely for distractors; however, we observed some negative GBRs, i.e., gamma band suppressions (see Figure 7). Frequencies in the alpha and beta bands (9–25 Hz) were characterized by a common pattern opposite to GBRs, with energy decreases between 200 ms and 500 ms (see Figures S2–S6). For statistical analysis, all frequencies in that range were pooled together, and significant energy reductions relative to the baseline were called alpha/beta suppressions (ABS). There was strong spatial correspondence between GBR and ABS: we found ABS in all cortical sites with 0–100 Hz GBR in addition to some adjacent sites (Pt1: 18/44;
Pt2: 1/14; Pt3: 4/27; Pt4: 3/23, Wilcoxon p < 0.05, corrected). As shown in Figures 7 and S1, along the same electrode probe, ABS typically extended 1–2 cm beyond the GBR. In Pt1, we observed that ABS was stronger for targets than for distractors in all locations showing ABS (Pt1: 18/44; KW p < 0.05, corrected); there were no such effects in the other three patients.
The gamma band and the alpha/beta bands differed also in their synchro-nization properties: in patient Pt1, in which intracerebral GBR and ABS were found in several distant cortical sites, we compared the level of syn-chrony across those sites in the gamma and alpha/beta bands: A first test,
which compared the mean synchrony value in a large [−200 to+500 ms] time
window for the 9–25 Hz vs. the 50–100 Hz range (cross-site synchrony be-ing calculated and averaged across all 39 pairs of non-adjacent iEEG sites in this patient) revealed a higher synchrony in the 9–25 Hz range (Wilcoxon Z = 4.71, p < 0.001). Yet, one may reasonably argue that synchrony should be measured for each frequency band when that band is really active (that is, post-stimulus for the gamma range, and pre-stimulus for the alpha/beta range, since ABS correspond to the disappearance of strong baseline oscilla-tions). Therefore, we performed a second test, similar to the first one, but
comparing the synchrony measured a) for the 9–25 Hz range, in the [−200 to
−50 ms] baseline time-window vs. b) for the 50–100 Hz range in a window
of same duration but chosen during maximal GBR: [200 to 350 ms]. Again, synchrony was higher in the 9–25 Hz range (Wilcoxon Z = 3.21, p = 0.001). This result may partly explain the differences between MEG gamma band and alpha/beta band responses described below.
3.2.2 MEG sensor spectrograms
TF analysis of MEG data tested whether GBRs and ABS seen with iEEG were visible with MEG. Since iEEG responses were concentrated in the [100 to 400 ms] time window (for GBR) and in the [200 to 500 ms] time window (for ABS), the analysis evaluated differences in TF energy between the baseline and those two time windows, in both frequency ranges. Note that while iEEG GBRs extended over a broad range (50–150 Hz), visual inspection revealed that MEG GBRs were most evident in a narrower range (50–100 Hz), in agreement with previous MEG studies (Hoogenboom et al., 2006; Vidal et al., 2006). For this reason, 50–100 Hz was chosen for MEG GBR analyses, with the exception of patient Pt4, who only exhibited significant iEEG GBR in the 100–150 Hz range.
Figures 2–6 show topographical representations of the statistical energy varia-tions relative to baseline (Wilcoxon Z-values) for MEG GBR. (See Figures S2– S6 for ABS.) These figures also indicate sensors with significant energy varia-tions using both uncorrected and Bonferroni-corrected thresholds (p < 0.05).
Clear MEG GBRs were observed in the first patient, Pt1, over both hemi-spheres (50/151 sensors, uncorr., 26/151, corr.) and predominantly over the occipital sensors but extending over temporal and frontal regions (Figures 2– 3). This topography was compatible with the cortical sources found around the temporo-parieto-occipital junction in this patient. In two other patients, Pt2 and Pt3, gamma band energy increases were much weaker, reaching sig-nificance level (uncorrected) in a relatively small number of sites (Pt2: 26/151, Pt3: 16/151). In patient Pt4, strong occipital MEG GBR was observed in the 50–100 Hz range (Figure S6) as well as 100–150 Hz (Figure 6), but intracranial electrodes covered frontal and anterior temporal regions.
Uncorrected statistical comparison between conditions revealed stronger GBR for targets in two patients (Pt1, 8/151 sensors, Pt2, 5/151 sensors); but one right frontal sensor in Pt1 had a stronger GBR for distractors. There was no difference between conditions in Pt3 and Pt4.
ABS was stronger than GBR at the MEG level. In all four patients, we found significant ABS, predominantly over the occipital sensors, in good agreement with the MEG suppression previously reported in the same frequency range (Hoogenboom et al., 2006) in response to visual stimuli. In contrast with GBR, most ABS were significant at both corrected and uncorrected thresholds. In three patients (Pt1, Pt2, and Pt4), ABS were also stronger for targets than for distractors (with both thresholds). This effect was not observed in Pt3, whose electrode placement did not allow a head position with full coverage of occipital regions.
Although strongest ABS and GBR were observed over the posterior sensors, we also found frontal responses (consistent with the involvement of frontal language areas, such as Broca’s area, in reading). Focal GBR was observed over left frontal sensors in patients Pt1 and Pt4, spatially coinciding with ABS. In patient Pt3, we also found an increase of alpha/beta activity (alpha/beta activation) over those regions in response to distractors, consistent with a deactivation of this region with less attention.
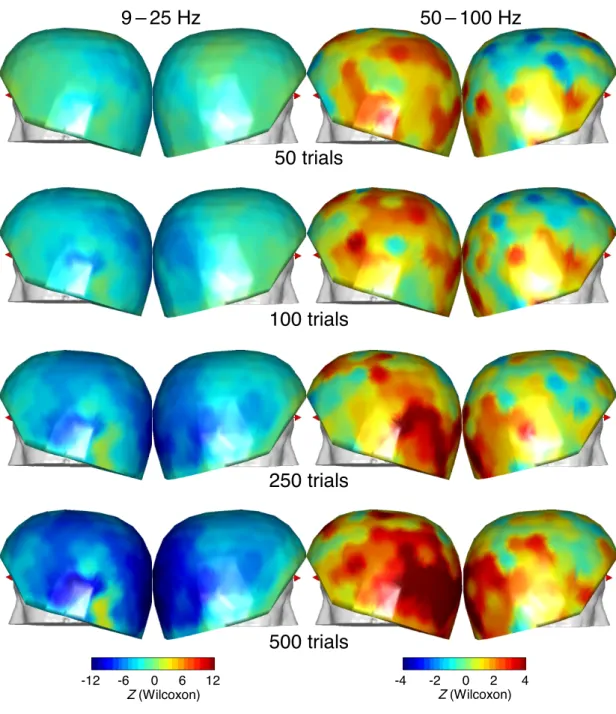
Since the strongest GBR were obtained in the patient with the largest number of analyzed trials (Pt1, 530 trials per condition compared to 210, 365, and 300 for the other three patients), we tested whether the number of trials may have had an effect on the GBR/ABS estimation. We checked whether strong GBRs were also apparent in this patient with less trials analyzed (Figure 8). Wilcoxon tests performed with 50, 100, 250, and 500 trials revealed that for both ABS and GBR, Wilcoxon Z values increased with the number of trials, which was expected for mathematical reasons. However, the topography of Z values varied considerably with the number of trials, especially for frontal GBR, even between 250 and 500 trials. Therefore, the number of trials in Pt2 (210 trials per condition) and Pt3 (365 per condition) may have been too small
for stable GBR to emerge in the MEG topography given the SNR conditions in those patients. In contrast, this instability of the Z-score topography was not as pronounced for ABS.
3.2.3 MEG source spectrograms
Next, a time-frequency beamformer source reconstruction was applied to the MEG responses. All four subjects displayed strong, focal occipital GBR and ABS with a latency of 200–250 ms, but only Pt1 had intracranial electrodes near this region.
Therefore, the brain location which showed the strongest GBR in iEEG were probed with the time-frequency beamformer for each patient. As with the iEEG and MEG sensors, the time-frequency maps reflect the statistical energy variations relative to baseline with Wilcoxon Z values. GBR in the 55–95 Hz band was successfully recovered for the strongest GBR responses found in both the right and left hemispheres. This activity was not significantly mod-ulated between the two conditions for the right hemisphere location (located in occipital cortex), in agreement with the iEEG results (Figure 2). In the left hemisphere, at a location in the posterior temporal lobe near the temporo-occipital junction, displayed modulation of GBR with attention (Figure 3), also in agreement with iEEG results. (The GBR appeared to start earlier com-pared to the iEEG, but this activity was in fact spatial spread from the strong occipital GBR.) In both cases, significant activity was found in 55–95 Hz, but not in higher frequency bands.
In patient Pt2, 55–95 Hz GBR was detected with a somewhat noisy time course (Figure 4), and in patient Pt3, not at all (Figure 5). Unexpectedly, a striking correspondence was found with iEEG in even higher frequency bands — 105–145 Hz for Pt2 and 145–195 Hz for Pt3. Significant GBR in the 105– 145 Hz range was also found for the target condition in Pt4, in accordance with the iEEG results; however, the distractor responses appeared noisy and activity above 55 Hz was not found to be significant.
In all patients, significant ABS with frequency and duration in agreement with iEEG results were detected (Figures S2–S6). Additionally, significant GBR and ABS source reconstructions agreed with spatiotemporal patterns observed in a parallel 10-subject iEEG study from our group (see movie in Supplementary Material and Jung et al., 2008), providing corroborating evidence for brain locations that were not sampled by iEEG in the present study.
3.2.4 MEG sensitivity
As a partial exploration of the mechanisms behind the strength of MEG GBR with respect to observed iEEG GBR, we estimated the MEG sensitivity for iEEG GBR locations (see Figure 9). Each column of the plot depicts the histogram distribution of MEG sensitivity over all possible source orientations for a given brain location known to exhibit GBR in iEEG. The half-sensitivity volume (HSV) is a common quantifier of MEG detectability, and includes the brain volume for which the relative sensitivity is greater than 0.5 for a given MEG sensor.
In Pt1, 5 of 14 GBR locations (identified with iEEG) fell within the half-sensitivity volume (HSV) for at least one MEG sensor, indicating favorable conditions for MEG detection. (Of the remaining electrodes, five were in deep locations in temporal cortex on probes ultimately reaching the hippocampi.) Interestingly, electrode TePg2-1 (near the left occipital pole) recorded the strongest dipole moment (see below) and was placed in the most MEG-sensitive location; further exploration of the sensitivity analysis showed that left occipital and left posterior temporal sensors would be most sensitive to this source, in accordance with the observed results shown in Figure 3. While iEEG detected only one significant GBR location in Pt2, this location was on the cortical surface, with a high median MEG sensitivity of 0.71. Even though very specific source orientations would considerably reduce the MEG sensitivity, the distribution shows that sensitivities were heavily concentrated above 0.6 over the range of all possible orientations.
Median MEG sensitivities for the 3 GBR locations found in Pt3 were all low, ranging from 0.33–0.43, with only the “luckiest” possible orientations yielding sensitivities slightly over 0.5. As such, the difficulty in resolving GBR with Pt3 may be partly explained by this low sensitivity.
Finally, the orbitofrontal location in Pt4 showing 100-150 Hz activity also had a relatively low median sensitivity of 0.24.
3.2.5 GBR dipole moment estimation
While the density of the iEEG electrodes was not sufficient to allow for a precise determination of current source density or dipole strength, we never-theless attempted to obtain an estimate of the source magnitudes involved using Equation 3. The estimated GBR dipole moments ranged from 0.04– 0.65 nAm (see Figure 9, red diamonds), an order of magnitude below dipole moments estimated for averaged ERPs from the same data. Dipole strengths for gamma sites from Pt2, Pt3, and Pt4 were particularly low, compared to several sites from Pt1. While the iEEG dipole moments cannot be directly
evaluated in the context of the magnetic field strength observed with MEG, we note that MEG sensor amplitudes were also an order of magnitude lower for GBR relative to averaged ERFs for all patients.
4 Discussion
Our primary objective was to test whether attention-related modulation of GBR and ABS observed with intracerebral measurements during a reading task could also be detected noninvasively with MEG. We found that this was indeed the case for the alpha/beta suppression, which was robust and consistent between the two attention conditions in all four patients, and was strengthened by attention in three patients in whom the occipital lobe was properly sampled by the MEG sensors (for practical reasons, one patient had to be positioned lower relative to the MEG helmet). By contrast, the GBR recorded in MEG and its modulation by attention, were not as strong and robust as those found in the simultaneously acquired intracerebral data.
4.1 MEG gamma band responses
GBR were clear at the sensor level in two patients, Pt1 and Pt4, reaching above the significance threshold even after Bonferroni correction. In another patient, Pt2, the responses were weaker and more sparse, always below the Bonferroni-corrected significance threshold; results were significantly stronger for targets in only two sensors, but more encouraging with the beamformer source reconstruction with more robust responses in the 105–145 Hz range. The evoked fields and corresponding source reconstructions were also much noisier for this patient than the others. In the remaining patient, Pt3, GBR seemed slightly stronger for distractors at the sensor level, although the sta-tistical analysis revealed no significant difference between the two conditions; source reconstruction appeared to reveal modulations at unexpectedly high frequencies (155–195 Hz), but surprisingly not between 50–150 Hz. These re-sults, together with the lack of resemblance between the gamma band topog-raphy in the two experimental conditions, indicate that we were dealing with effects barely above noise level in two out of four patients.
Two recent studies have called into question the origin of GBR in scalp EEG, with one attributing it to EMG of scalp muscles (Whitham et al., 2008) and the other to miniature saccades (Yuval-Greenberg et al., 2008). MEG is assumed to be subject to the same types of physiological noise. Since the present MEG data was simultaneously acquired with intracranial EEG, our results strongly suggest that no “false” GBR in regions with dense electrode coverage, i.e.,
MEG responses unexplained by iEEG. Furthermore, beamformer methods in particular do not assume cortical origin for all signals, and have indeed been shown to be robust in the presence of physiological noise sources external to the brain (Bardouille et al., 2006; Cheyne et al., 2006, 2007).
The technical difficulty of detecting GBR at the scalp level has been acknowl-edged and discussed thoroughly in recent studies (Trujillo et al., 2005; Hoogen-boom et al., 2006). Still, a long list of EEG and more recently MEG studies
on gamma band responses (i.e., Bauer et al., 2006; D¨uzel et al., 2003; Hall
et al., 2005; Hoogenboom et al., 2006; Kaiser et al., 2004, 2002; Osipova et al., 2006; Sokolov et al., 1999; Vidal et al., 2006; Dalal et al., 2008a) attests that such difficulties can be overcome, given certain precautions that remain to be formalized. What can we learn from the present experiment? In their study, Hoogenboom et al. (2006) listed a series of reasons explaining why gamma band responses have been difficult to find in noninvasive recordings. Those reasons fall into two categories, related either to the experimental design (use of transient static stimuli non-optimal for generating GBR, paradigms which do not require the subject’s sustained attention) or to the recording/analysis techniques (inadequate spectral analysis methods or recording apparatus). The authors proposed and clearly demonstrated, that with the proper paradigm and method, and with stimuli known to generate strong GBR at the cortical level in the primary visual cortex (e.g., high contrast, slow moving grids pre-sented foveally under the subjects focused attention), MEG GBR were robust over the occipital sensors.
Conversely, one might propose that suboptimal stimuli (i.e., transient static stimuli) may fail to generate strong scalp EEG/MEG GBR simply because they do not generate strong GBR at the cortical level. Still, using stimuli quite different from Hoogenboom et al. (2006), and common to many ERP experiments with short and transient stimuli repeated at short intervals, we found strong GBR at the cortical level for two patients, but GBR was less clear in MEG. The weakness of those MEG GBR could therefore not be attributed to the first category of reasons mentioned by Hoogenboom et al. (2006) for weak scalp GBR. In fact, we also used the same MEG system as their group, with analysis techniques proven to be efficient to detect GBR in both scalp EEG (Tallon-Baudry et al., 1996) and MEG (Vidal et al., 2006; Dalal et al., 2008a), so the failure to detect clear MEG GBR in some of our data cannot be due to the reasons listed by Hoogenboom et al. (2006).
Several additional reasons can be proposed: a) choice of threshold for sta-tistical significance, b) contamination of the gamma band by biological noise such as EMG, c) limited spatial extent of the GBR over the cortical surface and lack of synchrony between gamma band sources, d ) source characteristics, such as strength, location, and orientation, e) existence of “negative” GBR, f ) insufficient number of trials, g) frequency-dependent transmission of cortical
signals, and h) sensor coverage and subject position in the MEG helmet. Let us discuss those possible explanations:
a) statistical threshold : the Bonferroni correction used in this study is known to be too conservative, since statistical tests on neighbor sensors are far from be-ing independent considerbe-ing the limited spatial resolution of MEG. But, still, one source of dissatisfaction with MEG GBR was the lack of reproducibil-ity, in terms of topography, between the two attention conditions in Pt2 and Pt3. Attention is known to modulate the activity within the networks pro-cessing sensory information, but not to change radically the organization of those networks; therefore, the general shape of the gamma band topography was expected to be similar between the two attention conditions, as for the intracranial evoked potentials.
b) biological noise: frequency-wise, gamma band responses overlap with sev-eral sources of noise, mostly from muscular origin, which do not affect the intracerebral signal. Since the degree of contamination of the MEG signals by muscle activity varies across patients, this might explain why MEG GBR were more visible in certain patients than others, according to their ability to relax this muscle activity. We therefore advocate the systematic use of simple biofeedback techniques (i.e., display of muscular activity) prior to the experi-ment to help subjects reduce this source of noise.
c) spatial extent and synchrony: since MEG signals arise from the summated activity of large cortical populations, they are, like scalp EEG, very sensitive to the degree of synchrony between those neural activities: synchronous oscil-lations summate into macro-osciloscil-lations at the sensor level, while uncorrelated or delayed-phase oscillations tend to cancel (Pfurtscheller and Cooper, 1975). Our synchrony analysis revealed that the degree of synchrony in the gamma range was indeed significantly smaller than in the alpha and beta range, where MEG oscillations were much more visible. Also, we showed that GBR tend to be less widespread than alpha and beta responses; this may constitute a problem for GBR produced by sources radial with respect to the skull surface, due to the reduced contribution to external magnetic fields.
d) GBR source characteristics: the magnitude of high-gamma band signal is generally 1–2 orders of magnitude smaller than the dominating content in lower frequencies. While this may still provide sufficient signal for intracranial recordings, the associated electric and magnetic fields decay with distance. Therefore, deeper, low-amplitude, and/or suboptimally oriented GBR sources, combined with interference from neighboring cortical patches, will reduce the likelihood of noninvasive detection. In our particular data, MEG was partic-ularly sensitive to several of the locations where GBR was found in Pt1, and additionally the GBR sources appeared to have stronger dipole moments. In
comparison, while the sensitivity to Pt2’s GBR site was rather high, its ap-parent dipole moment was very low; in Pt3, both factors may have been at play, as the estimated dipole strength was relatively low in addition to being poorly situated for MEG detection.
e) gamma band suppression: our observation of decreased gamma band re-sponses could constitute another reason for weak GBR in MEG, as localized decrease in gamma power would partially cancel, at the scalp level, gamma band enhancements. Gamma band suppression has been repeatedly observed in EEG, especially at the intracranial level (Lachaux et al., 2005).
f ) number of trials: the strongest MEG GBR were observed with the dataset containing the largest number of viable trials (Pt1, 530 trials), while the results were not apparent when the analyses were instead conducted with less than 250 trials. In contrast, there were 210 and 365 analyzed trials in patients Pt2 and Pt3 respectively. Therefore, the number of trials was likely a strong factor in the different GBR results across our three subjects.
These results suggest that for static transient stimuli the detection of GBR may require more trials than sustained stimuli (in this case, over 500; the ex-perimental design in Hoogenboom et al. (2006) used six blocks of 75 trials). Those numbers differ markedly from those found in classic ERP experimental designs, and may seem impracticably large when testing several experimental conditions. A common alternative to using such large numbers of trials is to perform group statistics across several subjects, as most EEG/MEG studies do (Kaiser et al., 2004; Vidal et al., 2006). Such group statistics can reveal patterns of GBR recurrent across several individuals, not necessarily apparent in all the individual subjects because of low SNR. However, this strategy was ill-suited for the present study, which aimed to provide quantitative measures of attention in individual subjects. Alternatively, new signal processing tech-niques may be able to resolve neural signals, including GBR, from a fewer number of trials (Zumer et al., 2007).
g) frequency-dependent propagation: It is commonly stated that the skull and scalp effectively act as a lowpass filter, thereby passing lower frequency signals with more gain than higher frequency signals. A handful of studies have at-tempted to quantify and explain the frequency dependence of cortex-to-scalp signal transmission. Some studies conclude that various head tissues have sig-nificant reactivity, i.e., the conductivity of various head tissues are frequency-dependent even in the range of interest for EEG/MEG, with higher frequencies generally having higher conductivities than lower frequencies (Gabriel et al., 1996; Stinstra and Peters, 1998; Akhtari et al., 2003). The implications of this relationship for cortex-to-scalp signal transmission are not clear, but the sim-ulations of Stinstra and Peters (1998) demonstrate that higher conductivities counterintuitively result in lower gains with a spherical head model, perhaps
due to the effects of volume conduction. However, a study by Pfurtscheller and Cooper (1975) provides convincing evidence that the lowpass filter effect is pri-marily due to polyphasic summation, i.e., the phase variance of an activated cortical patch results in greater attenuation of higher-frequency signals when spatially averaged by a scalp EEG/MEG sensor. Unfortunately, such analy-sis of phase variance over cortical patches was not feasible with our electrode spacing and coverage.
h) sensor coverage and head position: An MEG system with denser sensor spacing may also increase the likelihood of recovering GBR, though this re-mains to be demonstrated; we are investigating the possibility of further si-multaneous recordings of MEG and iEEG with a 275-channel system. Ad-ditionally, the weakest GBR were obtained for patient Pt3 whose brain was especially low relative to the helmet. For this patient, it is possible that cov-erage of the occipital and inferior temporal regions was incomplete, making the topography of both ABS and GBR difficult to interpret at the sensor level and reducing the SNR at the source level. This stressed the need to check the distance between the brain and the sensors before the experiment, a somewhat trivial, yet useful, precaution.
4.2 ABS
The topography of ABS was consistent across conditions, and the statistical differences between conditions were strong. Considering the difficulty some-times associated with extracting MEG GBR, one can wonder why ABS were so much more clear than GBR in MEG data. The main reason is that the problems listed above for GBR do not apply to ABS. First, the signal to noise ratio in the alpha and beta bands is much better than in the gamma band, in part because the signal is stronger; it is well known that the spectrum energy of EEG and MEG data roughly decreases as frequency increases following a 1/f law. Furthermore, noise sources are weaker, e.g., the spectrum of EMG artifact rarely extends below 25 Hz (Tallon et al., 1995). In addition, we showed that the synchrony level between distant sites was higher in the alpha/beta range than in the gamma range, in agreement with previous experimental (Tallon-Baudry et al., 2001; Lachaux et al., 2005) and theoretical studies (Kopell et al., 2000). Massively synchronous oscillations of this kind sum together in macro-scopic MEG signals and are more visible at the sensor level; consequently, the post-stimulus suppression or desynchronization of these oscillations is also more visible in MEG signals. Finally, our data showed that ABS extended over wider cortical areas than GBR, a result consistent with previous intracranial studies (Crone et al., 1998a,b), and also found at the MEG level (Hoogenboom et al., 2006; Dalal et al., 2008a). This may also explain why the alpha/beta band modulations were more visible at the MEG level. ABS therefore
consti-tutes a noninvasive index of attention during reading, which can be reliably measured even in single subjects. This further supports the role of ABS as a quantitative marker of attention (Palva and Palva, 2007; Hanslmayr et al., 2007).
A further interesting feature of ABS is that they often coincide with GBR at the cortical level. The precise nature of this relationship remains to be under-stood: most of the time, GBR seems to occur simultaneously with ABS (Crone et al., 1998a,b; Lachaux et al., 2005, 2006; Mainy et al., 2007), but the con-verse is not necessarily true, as shown here. Also, the reactivity of GBR and ABS to experimental manipulation seems to be somewhat different (Lachaux et al., 2005), but to an extent that is still undetermined. If the correlation is found to be systematic in certain cortical structures and experimental sit-uations, ABS may constitute a convenient “tip of the iceberg” easily visible from scalp recordings and signaling the presence of underlying, less accessible GBR.
4.3 Validation of MEG head models and source reconstruction algorithms
The present data also provides a unique opportunity to test the relative perfor-mance of oscillatory source reconstruction algorithms. One important problem common to all methods is the accuracy of the head models used to estimate the lead field. We are currently investigating using these simultaneous record-ings to empirically calculate the lead field and evaluate its impact on source reconstruction accuracy (Dalal et al., 2008b).
Finally, over the last few years, several algorithms have been proposed to re-construct such sources and have been demonstrated to recover GBR in primary sensory cortices (Gross et al., 2001; David et al., 2003; Hall et al., 2005; Dalal et al., 2008a). Applications of these algorithms to more complex networks, while encouraging (van Wassenhove and Nagarajan, 2007; Guggisberg et al., 2008; Van Der Werf et al., 2008), are thus far scant. We have seen that the sources of gamma band responses in our task were multiple and widespread across the occipital, temporal, and parietal cortices; they should also involve language-related frontal areas, such as Broca’s area and the precentral gyrus (Jung et al., 2008; Mainy et al., 2008). It would be particularly compelling to evaluate various MEG source reconstruction methodologies in the context of these complex activations.
5 Acknowledgments
The authors would like to thank Florence Bouchet, Jean-Claude Bourzeix, and Laurent Hugueville for their technical help. JPL was supported by a grant from the Fondation Fyssen. SSD was supported by a Bourse Chateaubriand from the Government of France and a Marie Curie Fellowship from the European Commission.
References
Akhtari, M., Bryant, H. C., Emin, D., Merrifield, W., Mamelak, A. N., Flynn, E. R., Shih, J. J., Mandelkern, M., Matlachov, A., Ranken, D. M., Best, E. D., DiMauro, M. A., Lee, R. R., Sutherling, W. W., 2003. A model for frequency dependence of conductivities of the live human skull. Brain Topogr 16, 39–55.
Bardouille, T., Picton, T. W., Ross, B., 2006. Correlates of eye blinking as deter-mined by synthetic aperture magnetometry. Clin Neurophysiol 117, 952–958. Bauer, M., Oostenveld, R., Peeters, M., Fries, P., 2006. Tactile spatial attention
en-hances gamma-band activity in somatosensory cortex and reduces low-frequency activity in parieto-occipital areas. J Neurosci 26, 490–501.
Bichot, N. P., Rossi, A. F., Desimone, R., 2005. Parallel and serial neural mecha-nisms for visual search in macaque area V4. Science 308, 529–534.
Cheyne, D., Bakhtazad, L., Gaetz, W., 2006. Spatiotemporal mapping of cortical activity accompanying voluntary movements using an event-related beamforming approach. Hum Brain Mapp 27, 213–229.
Cheyne, D., Bostan, A. C., Gaetz, W., Pang, E. W., 2007. Event-related beam-forming: a robust method for presurgical functional mapping using MEG. Clin Neurophysiol 118, 1691–1704.
Crone, N. E., Miglioretti, D. L., Gordon, B., Lesser, R. P., 1998a. Functional map-ping of human sensorimotor cortex with electrocorticographic spectral analysis. II. Event-related synchronization in the gamma band. Brain 121, 2301–2315. Crone, N. E., Miglioretti, D. L., Gordon, B., Sieracki, J. M., Wilson, M. T.,
Ue-matsu, S., Lesser, R. P., 1998b. Functional mapping of human sensorimotor cor-tex with electrocorticographic spectral analysis. I. Alpha and beta event-related desynchronization. Brain 121, 2271–2299.
Dalal, S. S., Guggisberg, A. G., Edwards, E., Sekihara, K., Findlay, A. M., Canolty, R. T., Berger, M. S., Knight, R. T., Barbaro, N. M., Kirsch, H. E., Nagarajan, S. S., 2008a. Five-dimensional neuroimaging: Localization of the time-frequency dynamics of cortical activity. NeuroImage 40, 1686–1700.
Dalal, S. S., Jerbi, K., Bertrand, O., Garnero, L., Baillet, S., Martinerie, J., Lachaux, J.-P., June 2008b. Experimental calculation of magnetic lead fields using MEG simultaneously acquired with intracranial EEG [abstract]. In: Proceedings of the 14th Annual Meeting of the Organization for Human Brain Mapping.
Dalal, S. S., Zumer, J. M., Agrawal, V., Hild, K. E., Sekihara, K., Nagarajan, S. S., 2004. NUTMEG: A neuromagnetic source reconstruction toolbox. Neurol Clin Neurophysiol, 52.
David, O., Cosmelli, D., Hasboun, D., Garnero, L., 2003. A multitrial analysis for re-vealing significant corticocortical networks in magnetoencephalography and elec-troencephalography. NeuroImage 20, 186–201.
Dormont, D., Cornu, P., Pidoux, B., Bonnet, A. M., Biondi, A., Oppenheim, C., Hasboun, D., Damier, P., Cuchet, E., Philippon, J., Agid, Y., Marsault, C., 1997. Chronic thalamic stimulation with three-dimensional MR stereotactic guidance. AJNR Am J Neuroradiol 18, 1093–1107.
D¨uzel, E., Habib, R., Schott, B., Schoenfeld, A., Lobaugh, N., McIntosh, A. R., Scholz, M., Heinze, H. J., 2003. A multivariate, spatiotemporal analysis of electro-magnetic time-frequency data of recognition memory. NeuroImage 18, 185–197. Engel, J., 1987. Outcome with respect to epileptic seizures. In: Engel, J. (Ed.),
Surgical Treatment of the Epilepsies. Raven Press, New York, pp. 553–71. Fries, P., Reynolds, J. H., Rorie, A. E., Desimone, R., 2001. Modulation of oscillatory
neuronal synchronization by selective visual attention. Science 291, 1560–1563. Gabriel, S., Lau, R. W., Gabriel, C., 1996. The dielectric properties of biological
tissues: II. Measurements in the frequency range 10 Hz to 20 GHz. Phys Med Biol 41, 2251–2269.
Gross, J., Kujala, J., H¨am¨al¨ainen, M., Timmermann, L., Schnitzler, A., Salmelin, R., 2001. Dynamic imaging of coherent sources: Studying neural interactions in the human brain. Proc Natl Acad Sci U S A 98, 694–699.
Gruber, T., M¨uller, M. M., Keil, A., Elbert, T., 1999. Selective visual-spatial atten-tion alters induced gamma band responses in the human EEG. Clin Neurophysiol 110, 2074–2085.
Guggisberg, A. G., Dalal, S. S., Findlay, A. M., Nagarajan, S. S., 2008. High-frequency oscillations in distributed neural networks reveal the dynamics of hu-man decision making. Front Hum Neurosci 1, 14.
Hall, S. D., Holliday, I. E., Hillebrand, A., Singh, K. D., Furlong, P. L., Hadjipapas, A., Barnes, G. R., 2005. The missing link: Analogous human and primate cortical gamma oscillations. NeuroImage 26, 13–17.
Hanslmayr, S., Aslan, A., Staudigl, T., Klimesch, W., Herrmann, C. S., B¨auml, K.-H., 2007. Prestimulus oscillations predict visual perception performance between and within subjects. NeuroImage 37, 1465–1473.
Hoogenboom, N., Schoffelen, J.-M., Oostenveld, R., Parkes, L. M., Fries, P., 2006. Localizing human visual gamma-band activity in frequency, time and space. Neu-roImage 29, 764–773.
Huang, M. X., Mosher, J. C., Leahy, R. M., 1999. A sensor-weighted overlapping-sphere head model and exhaustive head model comparison for MEG. Phys Med Biol 44, 423–440.
Jung, J., Mainy, N., Kahane, P., Minotti, L., Hoffmann, D., Bertrand, O., Lachaux, J.-P., 2008. The neural bases of attentive reading. Hum Brain Mapp 29, 1193– 1206.
Kaiser, J., B¨uhler, M., Lutzenberger, W., 2004. Magnetoencephalographic gamma-band responses to illusory triangles in humans. NeuroImage 23, 551–560.
Kaiser, J., Lutzenberger, W., Ackermann, H., Birbaumer, N., 2002. Dynamics of gamma-band activity induced by auditory pattern changes in humans. Cereb Cortex 12, 212–221.
relationship between neuronal activity and BOLD functional MRI. NeuroImage 21, 876–885.
Kirchberger, K., Hummel, C., Stefan, H., 1998. Postoperative multichannel mag-netoencephalography in patients with recurrent seizures after epilepsy surgery. Acta Neurol Scand 98, 1–7.
Kopell, N., Ermentrout, G. B., Whittington, M. A., Traub, R. D., 2000. Gamma rhythms and beta rhythms have different synchronization properties. Proc Natl Acad Sci U S A 97, 1867–1872.
Lachaux, J.-P., Fonlupt, P., Kahane, P., Minotti, L., Hoffmann, D., Bertrand, O., Baciu, M., 2007. Relationship between task-related gamma oscillations and BOLD signal: New insights from combined fMRI and intracranial EEG. Hum Brain Mapp 28, 1368–1375.
Lachaux, J.-P., George, N., Tallon-Baudry, C., Martinerie, J., Hugueville, L., Minotti, L., Kahane, P., Renault, B., 2005. The many faces of the gamma band response to complex visual stimuli. NeuroImage 25, 491–501.
Lachaux, J.-P., Hoffmann, D., Minotti, L., Berthoz, A., Kahane, P., 2006. Intrac-erebral dynamics of saccade generation in the human frontal eye field and sup-plementary eye field. NeuroImage 30, 1302–1312.
Lachaux, J.-P., Lutz, A., Rudrauf, D., Cosmelli, D., Le Van Quyen, M., Martinerie, J., Varela, F., 2002. Estimating the time-course of coherence between single-trial brain signals: an introduction to wavelet coherence. Neurophysiol Clin 32, 157– 174.
Latikka, J., Kuurne, T., Eskola, H., 2001. Conductivity of living intracranial tissues. Phys Med Biol 46, 1611–1616.
Mainy, N., Jung, J., Baciu, M., Kahane, P., Schoendorff, B., Minotti, L., Hoffmann, D., Bertrand, O., Lachaux, J.-P., 2008. Cortical dynamics of word recognition. Hum Brain Mapp 29, 1215–1230.
Mainy, N., Kahane, P., Minotti, L., Hoffmann, D., Bertrand, O., Lachaux, J.-P., 2007. Neural correlates of consolidation in working memory. Hum Brain Mapp 28, 183–193.
Malmivuo, J., Plonsey, R., 1995. Bioelectromagnetism—Principles and Applications of Bioelectric and Biomagnetic Fields. Oxford University Press, New York. Mikuni, N., Nagamine, T., Ikeda, A., Terada, K., Taki, W., Kimura, J., Kikuchi, H.,
Shibasaki, H., 1997. Simultaneous recording of epileptiform discharges by MEG and subdural electrodes in temporal lobe epilepsy. NeuroImage 5, 298–306. M¨uller, M. M., Gruber, T., Keil, A., 2000. Modulation of induced gamma band
activity in the human EEG by attention and visual information processing. Int J Psychophysiol 38, 283–299.
Niessing, J., Ebisch, B., Schmidt, K. E., Niessing, M., Singer, W., Galuske, R. A. W., 2005. Hemodynamic signals correlate tightly with synchronized gamma oscillations. Science 309, 948–951.
Nobre, A. C., Allison, T., McCarthy, G., 1998. Modulation of human extrastriate visual processing by selective attention to colours and words. Brain 121 ( Pt 7), 1357–1368.
Oishi, M., Otsubo, H., Kameyama, S., Morota, N., Masuda, H., Kitayama, M., Tanaka, R., 2002. Epileptic spikes: Magnetoencephalography versus simultaneous electrocorticography. Epilepsia 43, 1390–1395.
Osipova, D., Takashima, A., Oostenveld, R., Fern´andez, G., Maris, E., Jensen, O., 2006. Theta and gamma oscillations predict encoding and retrieval of declarative memory. J Neurosci 26, 7523–7531.
Palva, S., Palva, J. M., 2007. New vistas for alpha-frequency band oscillations. Trends Neurosci 30, 150–158.
Pfurtscheller, G., Cooper, R., 1975. Frequency dependence of the transmission of the EEG from cortex to scalp. Electroencephalogr Clin Neurophysiol 38, 93–96. Rodriguez, E., George, N., Lachaux, J. P., Martinerie, J., Renault, B., Varela, F. J.,
1999. Perception’s shadow: Long-distance synchronization of human brain activ-ity. Nature 397, 430–433.
Sederberg, P. B., Kahana, M. J., Howard, M. W., Donner, E. J., Madsen, J. R., 2003. Theta and gamma oscillations during encoding predict subsequent recall. J Neurosci 23, 10809–10814.
Shigeto, H., Morioka, T., Hisada, K., Nishio, S., Ishibashi, H., Kira, D.-i., Tobimatsu, S., Kato, M., 2002. Feasibility and limitations of magnetoencephalographic de-tection of epileptic discharges: Simultaneous recording of magnetic fields and electrocorticography. Neurol Res 24, 531–536.
Singer, W., 1999. Neuronal synchrony: a versatile code for the definition of relations? Neuron 24, 49–65, 111.
Sokolov, A., Lutzenberger, W., Pavlova, M., Preissl, H., Braun, C., Birbaumer, N., 1999. Gamma-band MEG activity to coherent motion depends on task-driven attention. NeuroReport 10, 1997–2000.
Steinmetz, P. N., Roy, A., Fitzgerald, P. J., Hsiao, S. S., Johnson, K. O., Niebur, E., 2000. Attention modulates synchronized neuronal firing in primate somatosensory cortex. Nature 404, 187–190.
Stinstra, J. G., Peters, M. J., 1998. The volume conductor may act as a temporal filter on the ECG and EEG. Med Biol Eng Comput 36, 711–716.
Sutherling, W. W., Akhtari, M., Mamelak, A. N., Mosher, J., Arthur, D., Sands, S., Weiss, P., Lopez, N., DiMauro, M., Flynn, E., Leah, R., 2001. Dipole localiza-tion of human induced focal afterdischarge seizure in simultaneous magnetoen-cephalography and electrocorticography. Brain Topogr 14, 101–116.
Szurhaj, W., Bourriez, J.-L., Kahane, P., Chauvel, P., Maugui`ere, F., Derambure, P., 2005. Intracerebral study of gamma rhythm reactivity in the sensorimotor cortex. Eur J Neurosci 21, 1223–1235.
Tallon, C., Bertrand, O., Bouchet, P., Pernier, J., 1995. Gamma-range activity evoked by coherent visual stimuli in humans. Eur J Neurosci 7, 1285–1291. Tallon-Baudry, C., Bertrand, O., 1999. Oscillatory gamma activity in humans and
its role in object representation. Trends Cogn Sci 3, 151–162.
Tallon-Baudry, C., Bertrand, O., Delpuech, C., Pernier, J., 1996. Stimulus specificity of phase-locked and non-phase-locked 40 Hz visual responses in human. J Neurosci 16, 4240–4249.
Tallon-Baudry, C., Bertrand, O., Fischer, C., 2001. Oscillatory synchrony between human extrastriate areas during visual short-term memory maintenance. J Neu-rosci 21:RC177, 1–5.
Tallon-Baudry, C., Bertrand, O., H´enaff, M.-A., Isnard, J., Fischer, C., 2005. Atten-tion modulates gamma-band oscillaAtten-tions differently in the human lateral occipital cortex and fusiform gyrus. Cereb Cortex 15, 654–662.
Tanji, K., Suzuki, K., Delorme, A., Shamoto, H., Nakasato, N., 2005. High-frequency gamma-band activity in the basal temporal cortex during picture-naming and lexical-decision tasks. J Neurosci 25, 3287–3293.
Trujillo, L. T., Peterson, M. A., Kaszniak, A. W., Allen, J. J. B., 2005. EEG phase synchrony differences across visual perception conditions may depend on record-ing and analysis methods. Clin Neurophysiol 116, 172–189.
Van Der Werf, J., Jensen, O., Fries, P., Medendorp, W. P., 2008. Gamma-band activity in human posterior parietal cortex encodes the motor goal during delayed prosaccades and antisaccades. J Neurosci 28, 8397–8405.
Van Veen, B. D., van Drongelen, W., Yuchtman, M., Suzuki, A., 1997. Localiza-tion of brain electrical activity via linearly constrained minimum variance spatial filtering. IEEE Trans Biomed Eng 44, 867–880.
van Wassenhove, V., Nagarajan, S. S., 2007. Auditory cortical plasticity in learning to discriminate modulation rate. J Neurosci 27, 2663–2672.
Vidal, J. R., Chaumon, M., O’Regan, J. K., Tallon-Baudry, C., 2006. Visual group-ing and the focusgroup-ing of attention induce gamma-band oscillations at different frequencies in human magnetoencephalogram signals. J Cogn Neurosci 18, 1850– 1862.
Whitham, E. M., Lewis, T., Pope, K. J., Fitzgibbon, S. P., Clark, C. R., Loveless, S., Delosangeles, D., Wallace, A. K., Broberg, M., Willoughby, J. O., 2008. Thinking activates EMG in scalp electrical recordings. Clin Neurophysiol 119, 1166–1175. Yuval-Greenberg, S., Tomer, O., Keren, A. S., Nelken, I., Deouell, L. Y., 2008.
Transient induced gamma-band response in EEG as a manifestation of miniature saccades. Neuron 58, 429–441.
Zumer, J. M., Attias, H. T., Sekihara, K., Nagarajan, S. S., 2007. A probabilistic algorithm integrating source localization and noise suppression for MEG and EEG data. NeuroImage 37, 102–115.
e v e n t-re la te d fi e ld (f T ) time (ms)
*
e v e n t-re la te d fi e ld (f T ) time (ms)*
e v e n t-re la te d fi e ld (f T ) time (ms)*
*
-200 0 200 400 600 60 40 20 0 -20 -40 -60 time (ms) e v e n t-r e la te d fi e ld (fT ) -200 0 200 400 600 -50 0 50 100 n o rm a li ze d a m p li tu d e (-1 0 0 to 1 0 0 ) Pt3*
e v e n t-re la te d p o te n ti a l (µ V ) time (ms) targets*
targets*
-100 100 fi e ld (f T ) 0*
time (ms)*
Pt4*
-200 0 200 400 600 -100 -50 0 50 100 time (ms) e v e n t-r e la te d p o te n ti a l (µ V) -200 0 200 400 600 -50 0 50 time (ms) n o rm a li ze d a m p li tu d e (-1 0 0 to 1 0 0 )*
targets -200 0 200 400 600 -30 -20 -10 0 10 20 30 40 n o rm a li ze d a m p li tu d e (-1 0 0 to 1 0 0 ) -200 0 200 400 600 -30 -20 -10 0 10 20 30 n o rm a li ze d a m p li tu d e (-1 0 0 to 1 0 0 ) targets*
-70 70 fi e ld (f T ) 0 Pt1 Pt2*
e v e n t-re la te d p o te n ti a l (µ V ) time (ms) targets*
targets*
240 -240 fi e ld (f T ) 0 time (ms)*
) e v e n t-re la te d p o te n ti a l (µ V targets time (ms)*
*
*
time (ms) -60 60 fi e ld (f T ) 0 targets*
t = 210 ms t = 380 ms t = 280 ms t = 330 msFig. 1. MEG ERFs, MEG ERF beamformer reconstructions, and intracerebral ERPs. The sensor maps in the left column show the topography of the MEG evoked fields at the peak latency, for targets and distractors, together with the time series of the evoked fields measured at the peak sensor. The righthand column shows the evoked potential recorded at the intracerebral level in response to targets and dis-tractors at sites highlighted on the 3D brain rendering. Finally, the middle column