HAL Id: inserm-00868821
https://www.hal.inserm.fr/inserm-00868821
Submitted on 2 Oct 2013
HAL is a multi-disciplinary open access
archive for the deposit and dissemination of
sci-entific research documents, whether they are
pub-lished or not. The documents may come from
teaching and research institutions in France or
abroad, or from public or private research centers.
L’archive ouverte pluridisciplinaire HAL, est
destinée au dépôt et à la diffusion de documents
scientifiques de niveau recherche, publiés ou non,
émanant des établissements d’enseignement et de
recherche français ou étrangers, des laboratoires
publics ou privés.
LeView: automatic and interactive generation of 2D
diagrams for biomacromolecule/ligand interactions.
Ségolène Caboche
To cite this version:
Ségolène Caboche. LeView: automatic and interactive generation of 2D diagrams for
biomacro-molecule/ligand interactions.. Journal of Cheminformatics, Chemistry Central Ltd. and BioMed
Central, 2013, 5 (1), pp.40. �10.1186/1758-2946-5-40�. �inserm-00868821�
S O F T W A R E
Open Access
LeView: automatic and interactive generation
of 2D diagrams for biomacromolecule/ligand
interactions
Ségolène Caboche
1,2Abstract
2D diagrams are widely used in the scientific literature to represent interactions between ligands and
biomacromolecules. Such schematic diagrams are very helpful to better understand the chemical interactions and biological processes in which ligands are involved. Here, a new tool for automatic and interactive generation of 2D diagrams for biomacromolecule/ligand interactions is presented. LeView (Ligand-Environment Viewer) produces customised and high-quality figures, with a good compromise between a faithful representation of the 3D data (structures and interactions) and aesthetic criteria. LeView can be freely downloaded at http://www.pegase-biosciences.com/tools/leview/.
Keywords: Ligand, Interaction, Tool, Display, 2D diagram
Background
Non-covalent interactions, such as hydrogen bonds, between ligands and biomacromolecules forming a com-plex provide important clues in the understanding of biological processes and the design of compounds with desirable binding properties. Schematic 2D diagrams are widely used to visualise the binding interactions of lig-ands, which can provide important clues about their role and function. A lot of software packages are available for visualising structure in 3D, but only a handful exists for generating 2D protein/ligand interaction diagrams. LIG-PLOT [1] is the most commonly used and its successor LigPlot+ [2] includes a new interface, superposition of related diagrams and links to PyMOL and RasMol. Pose-View [3] automatically generates structure diagrams of molecular complexes. A module of the commercial soft-ware MOE - Molecular Operating Environment - [4] generates schematic diagrams for protein-ligand com-plexes, and other commercial software vendors offer sim-ilar tools. In this paper, LeView (Ligand-Environment Viewer) is introduced. This new tool automatically detects Correspondence: [email protected]
1Protein Data Bank in Europe, EMBL-EBI, Wellcome Trust Genome Campus, Hinxton, Cambridge CB10 1SD, UK
2Present address: IFR142 Molecular and Cellular Medecine, INSERM, CNRS, Institut Pasteur de Lille and Univ Lille Nord de France, Lille, France
ligands in a PDB file, generates 2D diagrams for biomacro-molecule/ligand interactions and allows the user to cus-tomise diagrams through an interactive and intuitive graphical interface. LeView is written in Java and dis-tributed as an executable file (source code is also available under GNU Public Licence, Additional file 1) in two ver-sions: a version with an interactive graphical interface and a command-line version for use in pipelines. LeView does not require any special installation steps, can be run on all operating systems.
Implementation
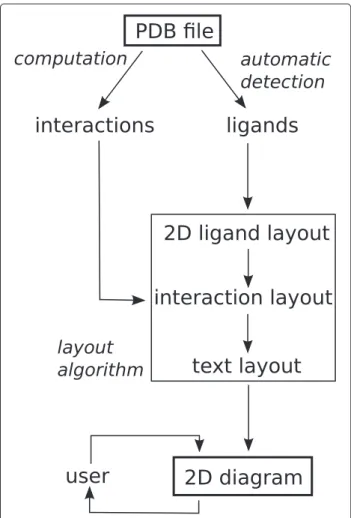
LeView was written in Java in order to be environment-independent, it is open-source and can be freely down-loaded (GNU Public Licence). Figure 1 shows the main steps of the LeView implementation. In a first step LeView automatically identifies ligands and metal ions directly from the PDB file with an algorithm based on the method used in PDBSum [5]. Explicit residues, i.e. residues explic-itly connected to the ligand in the PDB file, are also identified. For a ligand, the layout algorithm is then used to obtain the 2D diagram with which the user can interact via a graphical interface to customise it. The layout algo-rithm is divided into three steps: first, the 2D coordinates of the ligand atoms are computed, then the interactions
© 2013 Caboche; licensee Chemistry Central Ltd. This is an Open Access article distributed under the terms of the Creative Commons Attribution License (http://creativecommons.org/licenses/by/2.0), which permits unrestricted use, distribution, and reproduction in any medium, provided the original work is properly cited.
Caboche Journal of Cheminformatics 2013, 5:40 Page 2 of 7 http://www.jcheminf.com/content/5/1/40
Figure 1 Main steps of the LeView implementation.
are calculated from the PDB file and placed around the ligand and finally residue names are added to the diagram.
Ligand layout
In LeView, ligands are encoded by undirected labelled graphs in which nodes represent atoms, edges corre-spond to chemical bonds and labels are atom names. A graph mapping algorithm is used to map each lig-and residue with the corresponding PDBeChem cif file to obtain the bond order as PDB files do not contain this information. The ligand layout algorithm is then applied to obtain the 2D coordinates. First, the ligand is parti-tioned into structural elements: rings (the smallest set of smallest rings), chains containing at least 3 connected non-terminal atoms (i.e. C, N, O, S), isolated atoms and terminal atoms. Figure 2a shows the partitioning of epoxy succinyl inhibitor (EPO) of PDB entry 1CSB [6]. Once the ligand has been partitioned a set of rules are applied to each structural element in order to obtain an aesthetic diagram, i.e. bond lengths and angles following chemical conventions. For example, angles located in chains are set to 120 degrees and in rings angles and bond lengths are
fixed to obtain regular polygons with internal angle equal to 360 degrees divided by the number of atoms in the ring. When none of atoms including in the processed structural element is fixed in a previous step, the initial orientation is kept, for example, atom groups bound to a ring.
For each structural element, all the atoms and their neighbours are recursively placed. The recursive algo-rithm starts with the longest chain or with the larger ring otherwise. In the case of EPO (Figure 2a), algorithm starts with CG1 atom, one of the terminal atom of the longest chain, keeping the initial orientation of the chain. CB, one of the CG1 neighbours, is then processed fol-lowed by its neighbours (CG2 and CA). All the chain atoms are recursively processed with their neighbours (C, N, C4, O4, C3, C2, O2, C1, O1, O5, C5, C6 and CG1). The following atom in the call stack is C: 2D coordi-nates of C atom are previously calculated and are then calculated for its neighbours O and N2 atoms. when N2 atom, which is included in a ring, is processed the next step place all the ring atoms (CD3, CG3, CB1, and CA1). C7 atom is finally placed with their neighbours OXT and O3. Figure 2b shows the simple orthographic projection of the 3D structure of EPO and Figure 2c shows the resulting EPO coordinates obtained with the ligand layout algorithm.
Keeping the initial orientation of structural elements could lead to atom clashes and bond crossings. For exam-ple, Figure 2c shows that some conflicts occur. The next step of the ligand layout algorithm tries to resolves con-flicts. A conflict is detected when the distance between two atoms is less than 0.4 Å. In this case, all torsion angles which do not imply ring atoms are flipped (0 to 180 degrees) if this change reduces the overlaps in the molecule. An explicit residue, the cystein 29 of chain A (CYS29) is connected to the ligand in the PDB entry 1CSB through a LINK record wich specify connectiv-ity between residues that is not implied by the primary structure. The ligand layout algorithm is applied to the explicit residue CYS29. Once the residue 2D coordinates are obtained, the residue is randomly placed on a cir-cle with a radius of the real 3D distance. The number of bond crossings and atoms overlaps with the ligand are calculated for each position obtained by rotating the residue through 10 degrees each time. The returned position is the position minimising the number of bond crossings and atom overlaps. Figure 2d shows the result-ing conflict-free layout of EPO and the explicit residue CYS29.
During LeView implementation, a special attention has been paid to macro-cycles, i.e. large rings with smaller rings fused or bridged to them. Macro-cycles are detected and atoms forming the macro-cycle are first processed in order to form a regular polygon to produce a clear dia-gram. Finally the smaller rings and the others structural
e
f
c
d
a
b
Figure 2 Step-by-step diagram production. Figure 2 shows the diagram production for epoxy succinyl inhibitor (EPO) in PDB entry 1CSB [6]. a shows the partitioning of EPO into structural elements. Chains are boxed in green, rings in blue, isolated atoms in red. The simple orthographic projection of the 3D structure of EPO is shown in b. c presents the ligand layout after the first step of the ligand layout algorithm. A conflict occurs with several atom overlaps and bond crossings. d shows the ligand layout (in black) obtained after the conflict resolution step and the processing of the explicit residue (Cystein 29 - chain A). The explicit residue appears in grey and the connection in red. e is the diagram obtained after the interaction layout algorithm. Hydrogen bonds are in blue and nearby residues are represented by ovals coloured depending on hydrophobic properties (polar residues in pink, non-polar in green and other in grey). For each residue the chain ID encoding in the PDB file is given in brackets. f is the final diagram produced by LeView, containing the residue names.
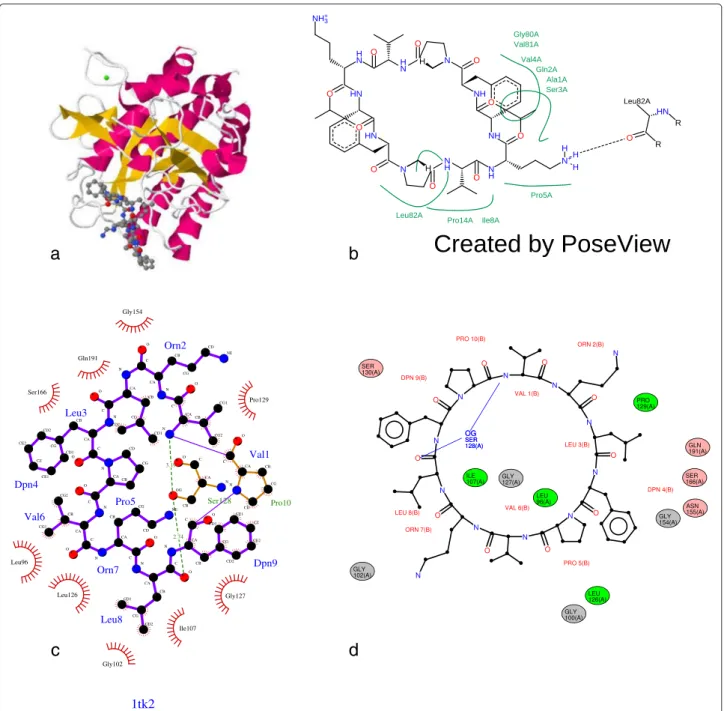
elements are processed. Figure 3d shows the diagram produced by LeView for the gramicidin S (1TK2 PDB entry) containing a macro-cycle.
Interaction layout
A list of neighbouring residues that have at least one non-hydrogen atom within a cut-off distance of 4 Å by
Caboche Journal of Cheminformatics 2013, 5:40 Page 4 of 7 http://www.jcheminf.com/content/5/1/40
a
b
c
d
Figure 3 Diagrams produced by LigPlot+, PoseView and LeView for Gramicidin S (PDB entry 1TK2). a shows the 3D coordinates at the interface ligand/protein for PDB entry 1TK2. The corresponding diagram produced by the website version of PoseView is shown in b, by LigPlot+ using default settings in c and by LeView using default settings in d.
default from any ligand atom is constructed. Hydrogen-bond donor and acceptor atoms in residues on this list that lie within a cut-off distance to a ligand atom are identified. Donor and acceptor atoms are also identified in the ligand. For each pair of donor(D)/acceptor (A) atoms, a hydrogen bond is created if an angle (D,A,aa) is less than 90 degrees exists (with aa, an acceptor’s neigh-bour atom). For water-mediated hydrogen bonds, water molecules within 3.3 Å of the donor/acceptor atoms in the ligand are identified as well as all paths between a ligand
atom and a residue atom containing between one and four water molecules. Neighbouring residues are defined as biomacromolecule residues which have at least one heavy atom approaching within a cut-off distance to the ligand. Once all interactions are identified, the next step is to place all interactions around the ligand, minimising bond crossings and overlapping graphical elements. The same method is used for placing all interaction types. The inter-acting element is randomly placed on a circle with a radius of the real 3D distance. The number of bond crossings and
nearby atom, i.e. atoms approaching within a distance less than 0.4 Å are calculated for each position obtained by rotating the interacting element through 5 degrees steps. The best position is that which minimises the number of bond crossings. If several positions show the same min-imum number of bond crossings, the selection is made based on the position that has minimal close interactions. LeView first places the hydrogen bonds, then the nearby residues and finally any water-mediated hydrogen bonds. LeView starts to place hydrogen bonds because they are represented by lines implying a higher probability of atom overlaps and bond crossings than nearby residues which are represented by ovals and placed in second. Water-mediated hydrogen bonds are not displayed by default and when the user add one, the coordinates are calculed to include it on the existing diagram. Figure 2e shows the lay-out of hydrogen bonds and nearby residues in the example of EPO ligand.
Text layout
The finally step of the layout algorithm is to add text on the diagram. The name of each residue component of the ligand and the name of explicit residues are placed on the diagram in order to minimise overlaps with other diagram elements. The residue name is randomly placed on a circle with the centre being the centroid of the residue which is the arithmetic mean position of all the residue atoms and a radius of Max(distance(centroid, i))+ 0.5 with i the residue atoms, i.e. the distance between the centroid and the further residue atom plus 0.5 Å. The number of nearby elements approaching within a distance less than 2 Å is calculated for each position obtained by rotating the text through 10 degrees each time. The position minimising the number of nearby elements is kept. Figure 2f shows the final diagram generated with default settings by LeView for EPO in the PDB entry 1CSB.
Results and discussion
LeView automatically detects biomacromolecules, ligands and metal ions in a PDB file and shows the user a complete list of these. Composite ligands can also be user specified by entering the appropriate residue range. It is possi-ble to create an interactive 2D diagram for each ligand and metal ion and this shows ligands, metals, hydrogen bonds and nearby residues. Nearby residues are defined as biomacromolecule residues (i.e. in proteins, DNA or RNA) which have at least one heavy atom approaching within a cut-off distance to the ligand. LeView allows the user to display several ligands and metal ions from the same or from several different PDB entries, which makes it easy to compare diagrams. Figure 2f shows the 2D diagram produced by LeView using default settings for EPO in PDB entry 1CSB. LeView offers the user a highly functional and intuitive interactive graphical interface to
customise the 2D diagram. The user can change the cut-off distance for hydrogen bonds and nearby residues by sliding the corresponding distance cut-off bar. Possible water-mediated interactions involving the ligand or ion, with up to four bridging water molecules, are not dis-played by default but can be added to the diagram through the menu. A number of display options are available as well. Atom labels (e.g. C15 ) can be displayed or hidden and the user can choose between standard colours (e.g. red for oxygen) or plain-colour mode, i.e. ligand atoms appear in the same colour than the ligand chemical bonds while several colour schemes are available for nearby residues. Colour can be used to represent hydrophobic-ity/hydrophilicity, standard amino acid properties similar to the Shapely scheme available in RasMol [7], charge or secondary structure type. The colour of every element in the diagram can be changed via the colour menu. Hydro-gen bonds can be represented by solid lines (default) or arrows from donor to acceptor, and hydrogen-bond dis-tances additionally displayed. LeView allows the user to reposition all the graphical elements in the diagram at will. If desired, individual hydrogen bonds and nearby residues can be deleted from the diagram, by a right click on it. Finally, the diagram can be exported in a variety of raster and vector graphics formats: PNG, GIF, JPG, PDF, SVG and EPS. For the latter three formats, LeView uses the Vec-torGraphics package of the FreeHEP Java Library (http:// java.freehep.org). The list of the interactions represented in the diagram, with the atoms involved and the associated distance, can also be exported as a flat text.
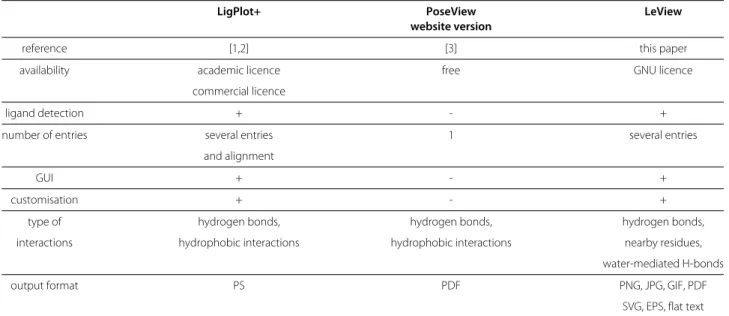
Table 1 shows the main features of the non-commercial programs to generate 2D diagrams of protein-ligand inter-actions. These include LigPlot+, the website version of PoseView and LeView. LeView is the only program dis-tributed under GNU General Public Licence and free for both academic and non-academic users. It is also the only tool with a wide range of output formats. LigPlot+ and LeView are able to automatically detect ligands from the PDB file whereas PoseView need a distinct ligand file. Figure 3 shows the diagrams produced by the three programs for gramicidin S (PDB entry 1TK2) which is composed of ten residues forming a macro-cycle. In this example, LigPlot+ does not correctly detect the entire lig-and: the proline (residue 10 of chain B) is detected as an explicit residue (Figure 3c) whereas LeView correctly identified all residues make up gramicidin S (Figure 3d). Contrary to other tools, LeView pays a special attention to macro-cycles makes the resulting diagram very clear as shown in Figure 3d. The graphical user interface imple-mented in LeView makes it very easy to use and allows the user to customise the diagram. Figure 4 is an example of user-customised diagram produced by LeView for the the PDE5 inhibitor sildenafil (PDB entry 1UDT [8]). Hydro-gen bonds are represented by arrows and the distance is
Caboche Journal of Cheminformatics 2013, 5:40 Page 6 of 7 http://www.jcheminf.com/content/5/1/40
Table 1 Main features of non-commercial programs to generate 2D diagrams of protein-ligand interactions
LigPlot+ PoseView LeView
website version
reference [1,2] [3] this paper
availability academic licence free GNU licence
commercial licence
ligand detection + - +
number of entries several entries 1 several entries
and alignment
GUI + - +
customisation + - +
type of hydrogen bonds, hydrogen bonds, hydrogen bonds,
interactions hydrophobic interactions hydrophobic interactions nearby residues,
water-mediated H-bonds
output format PS PDF PNG, JPG, GIF, PDF
SVG, EPS, flat text
This table shows exclusively non-commercial programs. A commercial standalone version of PoseView is available but only the free website version of PoseView is considered here. GUI means Graphical User Interface.
Figure 4 Example of user-customised diagram produced by LeView. Figure 4 shows an example of diagram generated by LeView for the PDE5 inhibitor sildenafil (PDB entry 1UDT [8]) after user customisation. The ligand appears in black. Hydrogen bonds are represented by blue arrows from donor to acceptor and the distance is displayed. Nearby residues are represented by ovals coloured depending on charge properties (non-polar residues in grey, acidic residues in red, basic residues in blue and uncharged polar residues in purple). Two water-mediated hydrogen bonds appear in green. The number of water molecules is indicated by the number of H2O.
shown. LeView is the only program that can display water-mediated hydrogen bonds through the graphical interface. Two of them are shown in Figure 4. LeView software uses the Java compile once and run everywhere paradigm and can produce high-quality and clear diagrams which are useful and easily understood by scientist without an expert knowledge of structural biology or chemistry.
Conclusion
LeView produces customisable and high-quality figures often necessary for scientific publications, in several pop-ular formats. It is able to work with a wide range of complex ligands and environments not possible with existing tools. This tool can be freely downloaded and easily used without installation and offers the user an interactive graphical interface with numerous options to customise the figure such as: varying the cut-off dis-tances, changing the diagram element colours, moving and deleting elements. The diagrams are a good com-promise between a faithful representation of the 3D data (structures and interactions) and aesthetic criteria. Lig-and, hydrogen bonds and nearby residues are included and the list of possible water-mediated interactions is also available.
Availability and requirements
Project name:LeView
Project home page: http://www.pegase-biosciences. com/tools/leview/
Operating system(s):Platform independent
Programming language:Java
Other requirements:Java 1.5 or higher
License:GNU General Public Licence
Any restrictions to use by non-academics:no restric-tions
Additional file
Additional file 1: The following additional data are available with the online version of this paper. Additional data file 1 is an archive of the
source code of the current version of LeView.
Competing interests
The author declared that she has no competing interest.
Authors’ contributions
SC has developed and maintains the LeView software.
Acknowledgements
The author gratefully acknowledges the EBI for funding and Protein Data Bank in Europe (PDBe; http://pdbe.org) staff for help, testing and discussions. The author thanks Gerard Kleywegt and Tom Oldfield for advice and for manuscript proof reading and Roman Laskowski for his help in ligand detection from PDB files. This work was supported by the European Bioinformatics Institute, part of the EMBL. Funding for publication charge: IFR142
Received: 23 June 2013 Accepted: 28 August 2013 Published: 29 August 2013
References
1. Wallace AC, Laskowski RA, Thornton JM: LIGPLOT: a program to
generate schematic diagrams of protein-ligand interactions. Protein
Eng 1995, 8(2):127–134.
2. Laskowski RA, Swindells MB: LigPlot+: multiple ligand-protein
interaction diagrams for drug discovery. J Chem Inf Model 2011, 51(10):2778–2786.
3. Stierand K, Maass PC, Rarey M: Molecular complexes at a glance:
automated generation of two-dimensional complex diagrams.
Bioinformatics 2006, 22(14):1710–1716.
4. Clark AM, Labute P: 2D depiction of protein-ligand complexes. J Chem
Inf Model 2007, 47(5):1933–1944.
5. Laskowski RA, Hutchinson EG, Michie AD, Wallace AC, Jones ML, Thornton JM: PDBsum: a Web-based database of summaries and
analyses of all PDB structures. Trends Biochem Sci 1997, 22(12):488–490.
6. Turk D, Podobnik M, Popovic T, Katunuma N, Bode W, Huber R, Turk V:
Crystal structure of cathepsin B inhibited with CA030 at 2.0-A resolution: a basis for the design of specific epoxysuccinyl inhibitors.
Biochem 1995, 34(14):4791–4797.
7. Sayle RA, Milner-White EJ: RASMOL: biomolecular graphics for all.
Trends Biochem Sci 1995, 20(9):374.
8. Sung BJ, Hwang KY, Jeon YH, Lee JI, Heo YS, Kim JH, Moon J, Yoon JM, Hyun YL, Kim E, Eum SJ, Park SY, Lee JO, Lee TG, Ro S, Cho JM: Structure of
the catalytic domain of human phosphodiesterase 5 with bound drug molecules. Nature 2003, 425(6953):98–102.
doi:10.1186/1758-2946-5-40
Cite this article as: Caboche: LeView: automatic and interactive generation
of 2D diagrams for biomacromolecule/ligand interactions. Journal of
Cheminformatics 2013 5:40.
Open access provides opportunities to our colleagues in other parts of the globe, by allowing
anyone to view the content free of charge.
Publish with
Chemistry
Central and every
scientist can read your work free of charge
W. Jeffery Hurst, The Hershey Company. available free of charge to the entire scientific community peer reviewed and published immediately upon acceptance cited in PubMed and archived on PubMed Central yours you keep the copyright
Submit your manuscript here:
![Figure 2 Step-by-step diagram production. Figure 2 shows the diagram production for epoxy succinyl inhibitor (EPO) in PDB entry 1CSB [6].](https://thumb-eu.123doks.com/thumbv2/123doknet/14616748.546456/4.892.86.808.131.882/figure-diagram-production-figure-diagram-production-succinyl-inhibitor.webp)