HAL Id: hal-02304386
https://hal-univ-rennes1.archives-ouvertes.fr/hal-02304386
Submitted on 10 Jul 2020
HAL is a multi-disciplinary open access
archive for the deposit and dissemination of
sci-entific research documents, whether they are
pub-lished or not. The documents may come from
teaching and research institutions in France or
abroad, or from public or private research centers.
L’archive ouverte pluridisciplinaire HAL, est
destinée au dépôt et à la diffusion de documents
scientifiques de niveau recherche, publiés ou non,
émanant des établissements d’enseignement et de
recherche français ou étrangers, des laboratoires
publics ou privés.
Distributed under a Creative Commons Attribution| 4.0 International License
and neck cancers
J Beaumont, O Acosta, A Devillers, X Palard-Novello, E Chajon, R de
Crevoisier, J Castelli
To cite this version:
J Beaumont, O Acosta, A Devillers, X Palard-Novello, E Chajon, et al.. Voxel-based identification of
local recurrence sub-regions from pre-treatment PET/CT for locally advanced head and neck cancers.
EJNMMI Research, SpringerOpen, 2019, 9 (1), pp.90. �10.1186/s13550-019-0556-z�. �hal-02304386�
O R I G I N A L R E S E A R C H
Open Access
Voxel-based identification of local
recurrence sub-regions from pre-treatment
PET/CT for locally advanced head and neck
cancers
J. Beaumont
1, O. Acosta
1, A. Devillers
1,2, X. Palard-Novello
1,2, E. Chajon
2, R. de Crevoisier
1,2and J. Castelli
1,2*Abstract
Background: Overall, 40% of patients with a locally advanced head and neck cancer (LAHNC) treated by
chemoradiotherapy (CRT) present local recurrence within 2 years after the treatment. The aims of this study were to characterize voxel-wise the sub-regions where tumor recurrence appear and to predict their location from pre-treatment
18
F-fluorodeoxyglucose (FDG) positron emission tomography (PET) images.
Materials and methods: Twenty-six patients with local failure after treatment were included in this study. Local recurrence volume was identified by co-registering pre-treatment and recurrent PET/CT images using a customized rigid registration algorithm. A large set of voxel-wise features were extracted from pre-treatment PET to train a random forest model allowing to predict local recurrence at the voxel level.
Results: Out of 26 expert-assessed registrations, 15 provided enough accuracy to identify recurrence volumes and were included for further analysis. Recurrence volume represented on average 23% of the initial tumor volume. The MTV with a threshold of 50% of SUVmax plus a 3D margin of 10 mm covered on average 89.8% of the recurrence and 96.9% of the initial tumor. SUV and MTV alone were not sufficient to identify the area of recurrence. Using a random forest model, 15 parameters, combining radiomics and spatial location, were identified, allowing to predict the recurrence sub-regions with a median area under the receiver operating curve of 0.71 (range 0.14–0.91).
Conclusion: As opposed to regional comparisons which do not bring enough evidence for accurate prediction of recurrence volume, a voxel-wise analysis of FDG-uptake features suggested a potential to predict recurrence with enough accuracy to consider tailoring CRT by dose escalation within likely radioresistant regions.
Keywords: Radiotherapy, Locally advanced head and neck cancers, Recurrence prediction, Radiomics, Voxel-based analysis
Introduction
Chemoradiotherapy (CRT) is a standard treatment for non-resected or unresectable locally advanced head and neck cancers (LAHNC) [1–3]. Radiotherapy (RT) com-bined with cetuximab has been established as a potential alternative standard treatment, especially useful when concomitant chemotherapy cannot be applied [4]. Overall
survival of these patients is highly correlated with the loco-regional recurrence, which arises in 20% to 40% of cases [5–9].
Dose escalation within the tumor may increase local control, although limited by the risk of toxicities [10,
11]. Positron emission tomography (PET) with18 F-fluor-odeoxyglucose (FDG) can play a major role in guiding local dose escalation allowing to determine regions prone to be radioresistant and thus can be likely at the origin of the recurrence [12, 13]. Thus, the prescribed dose can be homogeneously delivered within the 18-FDG-subvolume (dose painting by contour) [14] or
© The Author(s). 2019 Open Access This article is distributed under the terms of the Creative Commons Attribution 4.0 International License (http://creativecommons.org/licenses/by/4.0/), which permits unrestricted use, distribution, and reproduction in any medium, provided you give appropriate credit to the original author(s) and the source, provide a link to the Creative Commons license, and indicate if changes were made.
* Correspondence:j.castelli@rennes.unicancer.fr
1Univ Rennes, CLCC Eugène Marquis, INSERM, LTSI - UMR 1099, 35000
Rennes, France
2Department of Radiotherapy, Centre Eugene Marquis, avenue de la Bataille
heterogeneously planned thereby appearing as a function of the signal intensity at each voxel in the biologic image (dose painting by numbers) [15]. However, recent stud-ies which assessed the outcomes of dose painting in head and neck cancers suggested that there is no strong evidence of a correlation between recurrence and the standard uptake value (SUV) [14–21]. Other volumetric PET parameters such as metabolic tumor volume (MTV) and total lesion glycolysis (TLG) have been cor-related with overall survival and local control [22, 23]. Particularly, the MTV may be useful in the identification of a global recurrence volume.
A recent study, based on 42 patients with a local failure after a radiotherapy treatment, showed that the MTV computed with a threshold of 50% of the max-imum SUV of the tumor plus a margin of 10 mm (MTV50 + 10) covers the majority of the recurrence
[24]. This volume closely corresponds to the gross tumor volume (GTV), limiting the use of dose escal-ation strategies. Chaput et al. and Legot et al. [25, 26] also investigated the location based on a spatial align-ment of the MTV with the recurrence region suggest-ing that hypermetabolic sub-regions are likely within the relapse volume. Nevertheless, MTV is a rather global feature which does not allow to individually identify voxels or local sub-regions likely responsible for the relapse. There is nowadays a lack of fine characterization of local recurrence at a voxel level able to accurately predict the sub-regions likely re-sponsible of recurrence thus enabling the tailoring of the prescribed dose. This problem is not solved partly because in head and neck, the identification of com-mon regions in both pre- and post-treatment images via registration is not an easy task. Indeed, important anatomical modifications may arise between both time points due not only to weight loss and tumor regres-sion but also to the different anatomic position and the presence of image artifacts. Characterization of PET images may go beyond simple voxel-wise SUV values, but rather including other radiomics-like [27– 29] features, which may capture both global and local FDG-PET uptake characteristics. Radiomics features may help unraveling the underlying structure of the tumor and therefore add fundamental quantitative in-formation to the characterization of those voxels. The advantage is that each voxel is characterized by a set of hand-crafted features encompassing multiscale information.
In this context, the aims of this study were (i) to iden-tify the volume of tumor recurrence, (ii) to characterize it in terms of global and local features, and (iii) to build a voxel-wise machine learning model able to predict, from ptreatment PET images, sub-regions where re-currence is likely to occur.
Materials and Methods
Inclusion criteria
All consecutive patients treated in our center with de-finitive concurrent CRT or RT and cetuximab for LAHNC between January 2012 and December 2015 were retrospectively reviewed. Inclusion criteria were an age between 18 and 75 years, T3-4 or N+ stage, no surgery before RT, no history of cancer, a PET/CT performed within 8 weeks prior to the start of RT, no metastasis at diagnosis, a minimal follow up of 6 months, and a local recurrence confirmed by PET/CT as primary event. Patients and treatment characteristics
This retrospective study enrolled 26 patients. All patients underwent intensity modulated radiotherapy (IMRT) using a total dose of 70 Gy (2 Gy/fraction/day, 35 frac-tions), with simultaneous integrated boost technique [30] and concomitant chemotherapy or cetuximab [20] if the patients were not fit for chemotherapy. The protocol for planning and treatment was the same as previously de-scribed [21].
Physical evaluation and laryngoscopy were performed after RT every 3 months for the first 2 years and then every 6 months thereafter. A PET/CT was systematically performed between 3 and 6 months after treatment. Dur-ing follow up, a PET/CT was also performed for patients with clinical recurrence.
Median time to recurrence after treatment was 4 months (ranging from 3 to 22 months).
PET/CT acquisition
All patients underwent FDG PET/CT for staging before treatment. The patient lasted at least 4 h prior to the in-jection of 4 MBq/kg of 18F-FDG. If not contraindicated, intravenous contrast agents were administered before CT scanning. After a 60-min uptake period of rest, pa-tients were imaged with a PET/CT imaging system Dis-covery ST (General Electric Medical Systems; General Electric Healthcare, Milwaukee, Wis). First, a CT (120 kV, 80 mA, 0.8-s rotation time, slice thickness 3.75 mm) was acquired. A PET scan was performed immediately after the acquisition of the CT. Images were acquired from the base of the skull to the midthigh (3 min/bed position). PET images were reconstructed by using an ordered-subset expectation maximization iterative re-construction (two iterations, 28 subsets) and an iterative fully three-dimensional image. CT data were used for at-tenuation calculation. The same protocol was used for follow-up. The study was approved by the institutional review board.
Recurrence volume identification
The primary tumor was segmented on both pre-treatment and recurrence PET/CT. A rigid co-registration step was
then performed between pre-treatment and recurrence PET/CT (Fig. 1) using a customized method based on common structures. After co-registration, two different sub-regions were labeled: (i) the recurrence volume (GTVfailure), defined as the anatomical region where the pre-treatment and the recurrent primary tumors inter-sected; (ii) the responder volume (GTVresponder), defined as the anatomical region where no overlap existed be-tween the pre-treatment tumor and the recurrent tumor.
The customized rigid registration method was based on a block matching algorithm [31, 32] devised to ad-dress the issues arising when registering head and neck anatomies between two endpoints after radiotherapy.
Specifically, the weight loss and tumor regression in-duced by the chemo-radiotherapy treatment may lead to important changes in patients’ anatomies, as shown in Fig. 2. Patient positions and differences in contrast agents can also hamper the registration process. To ac-count for these anatomical changes, the registration was performed on distance maps computed from bony struc-tures [31]. Thus, bone segmentations were firstly ob-tained by thresholding CT images with a value of 200 HU followed by an Euclidean distance map computation [33]. This step was followed by a finer registration of bony structures within manually selected ROIs encom-passing the pre-treatment tumor.
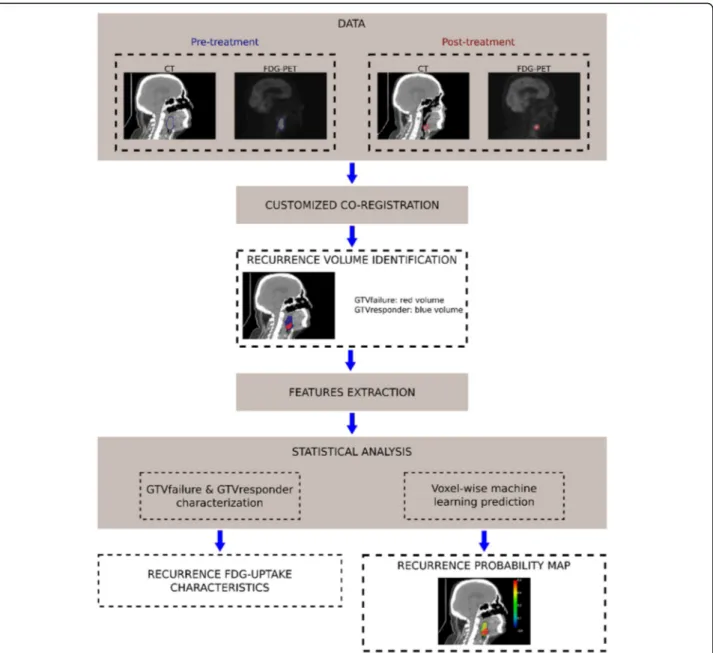
Fig. 1 Workflow of the study. (i) Intra-individual registration of post-treatment data to the pre-treatment space allows the definition of both the region of recurrence volume (GTVfailure) and the responder volume (GTVresponder). This step is followed by (ii) a regional analysis allowing to characterize the recurrence and (iii) a voxel-wise analysis (feature extraction and classification) which yields a probability map of recurrence
The matching of the bony structures was first quanti-tatively assessed using the dice score but eventually the registrations were qualitatively assessed by a senior radi-ation oncologist. Patients with inaccurate visual registra-tion of the tumor area were excluded from the study. In a second time, four physicians also reviewed the registra-tions. Inter-rater reliability was evaluated using Fleiss’s Kappa method.
Features extraction
FDG-uptake features were extracted from pre-treatment PET images at different spatial scales. A first regional approach was used to globally characterize both GTVfai-lure and GTVresponder with different thresholds, while a voxel-wise analysis was performed to characterize local properties of these regions. These features were then used to train a model able to predict the GTVfailure vol-ume as depicted in Fig.1.
Features from recurrence and responder volumes
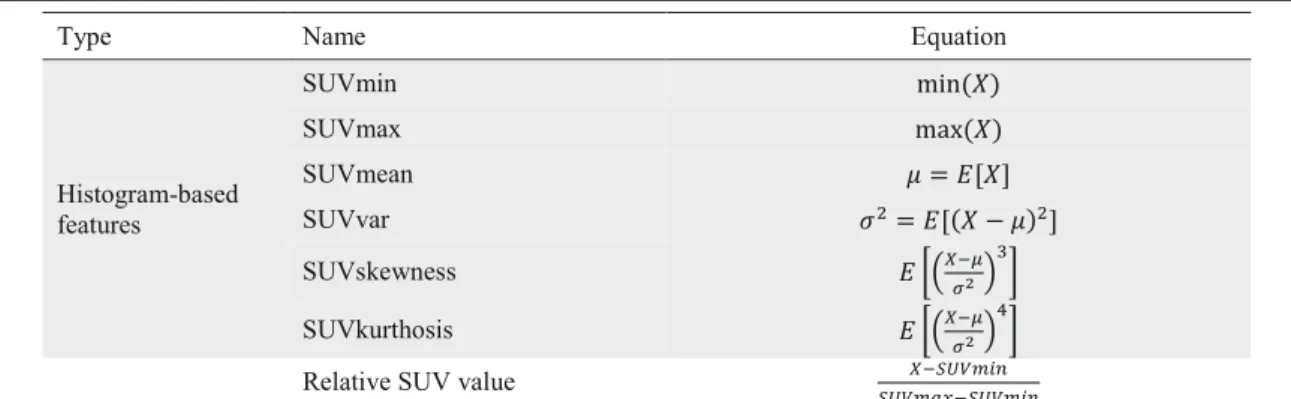
Histogram features were extracted from pre-treatment PET images for both GTVresponder and GTVfailure re-gions as presented in Table1.
Based on pre-treatment PET, the MTV of the primary tumor was computed with thresholds ranging from 0 to 100% (step− size = 1 % ) of the maximum SUV (SUVmax). The coverage of both GTVfailure and GTVresponder by the MTV was then computed for each threshold.
Voxel-wise analysis
The primary tumor was characterized at the voxel level by different geometric and image features [34]. Thus, for each voxel v, the features extracted were the relative
SUV value of v; the Euclidean distance [33] between v and vMax, with vMax the voxel with the highest aver-aged SUV value (computed within the 26 neighborhood); the Euclidean distance between v and vMin, with vMin the voxel with the lowest averaged SUV value (computed within the 26 neighborhood); the Euclidean distance be-tween v and vSurf, with vSurf the closest voxel within the primary tumor surface; Haralick texture features [35], computed within a neighborhood of two voxels; the Laplacian of Gaussian (LoG) value of v; the location of the voxel v within the pre-treatment tumor; the inclu-sion of the voxelv within the MTV50+10volume; and the
overall tumor characteristics: 3D shape descriptors, MTV50, TLG50, and tumor location (oropharynx,
hypo-pharynx,…). In order to deal with rotation invariant tex-ture featex-tures, PET images were resampled to isotropic voxel size. Haralick texture features were computed on normalized grey level co-occurrence matrix with 64 bins. Those features were implemented as presented Table1, thereby obtaining 22 features per voxel in total.
Statistical analysis
Recurrence and responder volume characterization
Wilcoxon signed-rank test [36] was used to assess whether global histogram features computed within GTVfailure were significantly different (p value ≤ 0.05) from those computed within GTVresponder.
Voxel-wise prediction of the recurrence volume
A random forest (RF) model [37, 38] was trained with voxel-wise features. The probability of belonging to the GTVfailure for each voxel was computed as the super-vised output by dividing the number of trees which pre-dicted that a voxel belonged to GTVfailure by the total number of trees of the model.
The RF was trained using ranger [39], a C++ software tool that implements the probability random forest algo-rithm [38]. The training was performed using a leave-one-out cross-validation framework with ranger default parameters, excepted for the number of trees, which was set to 10,000.
The mean out-of-bag (OOB) prediction error [40] was computed to assess the performance of the model on the training data set, while the area under the receiver operating curve (AUC) was used to assess these perfor-mances on the testing data. It should be noted that the relation between the OOB prediction error and the AUC isOOB = 1 − AUC.
The Mean Decrease Gini Index (MDGI), yielded by ranger, allowed to assess the importance of each feature within the RF. To improve the performance of the model, the variables with the lower MDGI were recur-sively removed until the value of the OOB prediction
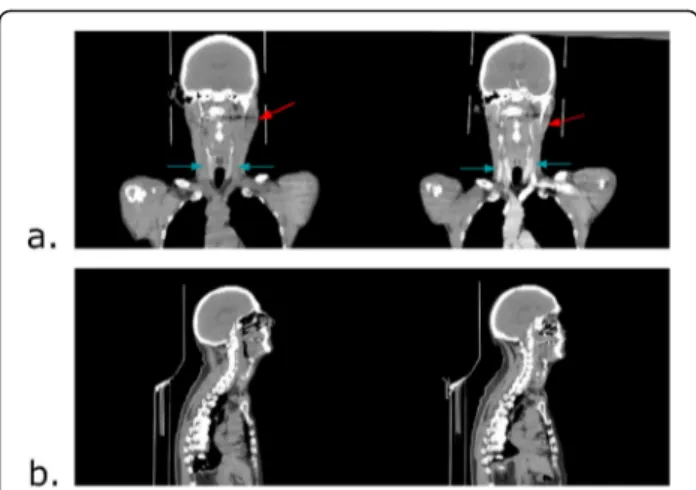
Fig. 2 Intra-individual differences that can be found in CT images acquired at different time points. Left: pre-treatment CT. Right: post-treatment CT. a Red arrow: changes of patient anatomy after the treatment. Blue arrow: intensity differences due to the injection of a contrast agent in the post-treatment CT (right). b Differences in the position of the patient between pre- and post-treatment CT. Here, the inclination of the head has changed
Table 1 Equations of radiomics features used to characterize the recurrence volume (grey background) and to train the random forest
error measured on the training dataset reached its lowest value [41].
Results
Recurrence volume identification
The mean dice score measured on bones segmentations in the ROI used to perform the registration was 0.70 ± 0.14. After a qualitative assessment, 15 pairwise registra-tions out of 26 proved to be anatomically accurate enough to identify and characterize recurrence volume. Among these patients, tumor localization was distrib-uted as oropharynx for six patients, hypopharynx for four patients, oral cavity for three patients, and larynx for two patients. Examples of accurate and inaccurate structures matching are presented in Fig.3. The Fleiss’s
Kappa for inter-observer agreement was 0.66.
The inter-rater reliability, computed using the Fleiss's Kappa for inter-observer agreement was 0.66. Within the 15 accurate identifications, recurrence volume represented on average 23% of the GTV (standard deviation =12%). Recurrence and responder volume characterization Table2presents the histogram-based features computed within both GTVresponder and GTVfailure. The mini-mum SUV (SUVmin) and the mean SUV (SUVmean) were significantly different between GTVfailure and GTVresponder.
The MTV covers a higher percentage of GTVfailure than GTVresponder (Fig. 4). The MTV50+10 covered on
average 89.8% (range 48.6–100) of the recurrence volume and 96.9% (range 82.1–100) of the pre-treatment GTV. Voxel-wise prediction of the recurrence volume
Figure5presents the mean importance of features within the leave-one-out RF models, according to the MDGI.
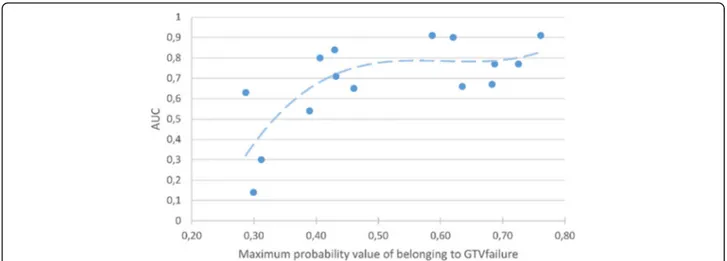
Fifteen features out of 22 were kept as relevant to train the RF after recursive suppression of the less important features. Mean OOB prediction error on the training dataset was 0.041 (median = 0.040, range 0.039–0.045), and the mean AUC on the testing dataset was 0.68 (me-dian = 0.71, range 0.14–0.91). Fig. 6shows that a strong correlation (r = 0.64) exists between the value of the voxel with the maximum probability of belonging to GTVfailure and the AUC of the corresponding probabil-ity map. Fig. 7 presents an example of probability map generated by the model trained with the 15 retained features.
Discussion
To our knowledge, our study is the first to locally com-pute the probability of a voxel to belong to a recurrence region within the GTV. This study was based on voxel-wise features extracted from pre-treatment PET/CT. The prediction model was validated using a leave-one-out scheme. A spatial characterization allowed to de-scribe sub-regions likely responsible of recurrence origin which may be then used to guide dose tumor painting. In this manner, the obtained model provides a way for-ward to predict recurrence regions by only using the pre-treatment PET/CT.
A customized rigid co-registration method was imple-mented to identify recurrence volume. 3D Euclidean dis-tances were computed on bone segmentations helping to steer the registration algorithm and allowing to ac-count for changes in soft tissues anatomies due to the CRT treatment. The performance of the block-matching algorithm was increased compared to CT intensity based registration of regions with similar intensities [31].
Fig. 3 Examples of both inaccurate and accurate structures matching. Left: pre-treatment CT. Right: post-treatment CT. a Inaccurate structures matching. Although the skull, the jaw, and the top of the spinal cord are aligned, the tongue of the patient appears in a different position between the two scans, leading to a misalignment of pertinent structures for tumor recurrence analysis. b Accurate structures matching. The skull, jaw and spinal cord are aligned and no anatomical differences between the soft tissues were found nearby the tumor. Blue: pre-treatment tumor. Red: post-treatment tumor
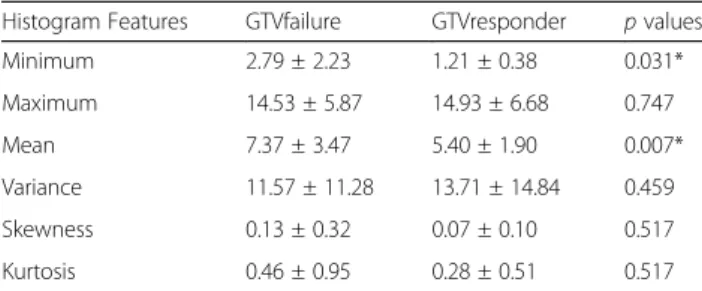
Table 2 Mean histogram feature comparison between GTVfailure and GTVresponder, with associated Wilcoxon signed-rank test p values
Histogram Features GTVfailure GTVresponder p values Minimum 2.79 ± 2.23 1.21 ± 0.38 0.031* Maximum 14.53 ± 5.87 14.93 ± 6.68 0.747 Mean 7.37 ± 3.47 5.40 ± 1.90 0.007* Variance 11.57 ± 11.28 13.71 ± 14.84 0.459 Skewness 0.13 ± 0.32 0.07 ± 0.10 0.517 Kurtosis 0.46 ± 0.95 0.28 ± 0.51 0.517
GTVfailure: recurrence volume within the primary tumor, GTVresponder: responder volume within the primary tumor
Fig. 4 Percentage of GTVfailure (red line) and GTVresponder (blue line) covered by the MTV as a function of % SUVmax. The MTV covers a higher percentage of GTVfailure than GTVresponder for threshold values ranging from 15% to 80%. However, no threshold value allowed to cover most of GTVfailure without covering most of GTVresponder. GTVfailure recurrence volume within the primary tumor, GTVresponder responder volume within the primary tumor, MTV metabolic tumor volume, SUVmax maximum standard uptake value
Fig. 5 Mean Decreasing Gini Index (MDGI) of features used to train the random forest (RF). The most important variables in the RF have the higher MDGI value, here, the cluster shade, the distance to vmax, the spatial position (x,y), Haralick Correlation. etc. The red box indicates the features kept to train the RF after the recursive suppression of the less important features
The average dice score obtained on bone segmenta-tions after registration was low. This may be explained by the changes in patients’ position between two image acquisitions. The dice score is sensitive to the size of the defined ROI, which is different for every patient in the current study and might be too small in certain cases to obtain high dice score values. However, the aim of the registration was to identify the origin of recurrence in pre-treatment scans. Thus, the quality of this identifica-tion cannot be measured using similarity metrics and the value of the dice score could not be used to validate registration results in the current study.
Currently, the gold standard method to identify head and neck cancer recurrence origin is to propagate the
center of mass of the post-treatment tumor to the pre-treatment scan using non-rigid registration methods. GTVfailure has been defined by adding a 4 mm radius margin to this center of mass, to account for registration and delineation uncertainties. Although, this procedure allows the identification of a global recurrence origin even in the case of important anatomy changes between scans, the identification of GTVfailure is not accurate enough to perform a voxel-wise analysis.
Thus, we privileged the use of a rigid registration method for preserving anatomical correspondences des-pite intra-patient changes and to select patients with ac-curate identification of GTVfailure. The accuracy of recurrence volume identification was manually assessed by a senior radiation oncologist. Eleven patients were therefore excluded from the study considering that rigid registration did not allow to identify the recurrence vol-ume with enough accuracy, in the cases where the anat-omy of the subject was different between the pre- and post-treatment PET/CT.
A regional characterization of FDG-uptake features showed that the mean FDG-uptake (SUVmean) was signifi-cantly higher in GTVfailure than in GTVresponder. However, the recurrence volume was not entirely covered by MTV50and the SUVmax was not a predictor of
recur-rence volume location, suggesting that histogram-based FDG-uptake features are not the best suited to guide dose-escalation strategies. These results are in line with Mohamed et al. [24], who suggested to add a margin of 10 mm to the MTV50 to cover the majority of recurrences.
Nonetheless, the MTV50+10 also covers most of the GTV.
Thus, this feature also limits the use of dose escalation strategies as it is not able to provide a precise identification of the radio-resistant regions likely to trigger recurrence.
Fig. 6 Area under the curve (AUC) of probability maps plotted against their corresponding maximum probability value of belonging to GTVfailure. A strong correlation between the AUC and the value of the voxel with the maximum probability of belonging to GTVfailure was found across the predictions performed in this study, suggesting that the reliability of the prediction can be assessed using the maximum probability value of belonging to GTVfailure
Fig. 7 Example of probability map of recurrence, generated with random forest, overlaid on the treatment CT. Black contour: pre-treatment GTV. Red contour: GTVfailure
Regional FDG-uptake features appear as inaccurate predictors of recurrence volume. As opposed to re-gional approaches, we performed voxel-wise analysis of FDG-uptake using radiomics features via a random forest machine learning strategy. Thus, each voxel be-comes informative and relevant to build a relapse re-gion by its progressive aggregation when they are likely recurrent. The use of radiomics features was of particular interest as it allowed to extract both global and local information on the spatial relations between FDG-uptakes computed on small volumes, in addition to the FDG-uptake information itself [27, 42]. More-over, textural analysis provides prognostic information on pre-treatment FDG PET/CT in HNSCC [43]. It should be noted that the parameters used to compute radiomics in this study were chosen in agreement with the Image Biomarker Standardization Initiative [34].
The predictive capability of each feature was assessed using a leave-one-out cross-validation RF, with MDGI computation. The ranking of features using the MDGI showed that radiomics and voxel location features were the most predictive features of recurrence volume. The first feature directly linked with histogram-based FDG-uptake is the relative SUV, ranked as 13th according to the MDGI. The feature importance ranking also showed that the inclusion of voxels within the MTV50+10volume
is not relevant for recurrence volume prediction at the voxel level. This was expected as the MTV50+10covers a
large area of the GTV and is rather a global characteristic. A backward feature selection strategy was used to im-prove the prediction of the model. However, the model obtained did not provide acceptable results for a clinical use. A strong correlation was found between the value of the voxel with the maximal probability of belonging to GTVfailure and the AUC of the corresponding prob-ability map, suggesting that the maximal probprob-ability of belonging to GTVfailure can be used to assess the pre-diction reliability of the model.
Our study exhibits some limitations. The accuracy of the registration was qualitatively assessed by a single expert. Inter-observer variability can however arise, impacting the reproducibility of the experiments. A po-tential weakness of this approach is the risk of selection of a particular sub-tumor type (i.e., without major ana-tomical variations), or particular radioresistant tumor (as suggested by the median time to recurrence). Further validation of our methodology may require multiple readers at different centers, and an evaluation of the agreement between different experts to identify adequate registrations.
After the registration step, a significant number of pa-tients were excluded from the study to ensure an accur-ate identification of the recurrence volume. Therefore, the prediction of recurrence volume was performed on
15 patients only. However, the training of the RF model was performed at the scale of the voxel, which means that a very high number of samples was used to generate a robust model. Each voxel is a different entity so inde-pendently considered, allowing their aggregation in re-gions which are predictive for the risk of recurrence even with a small number of patients. All patients were scanned using the same PET machine. Then, the model should be also customized for other PET/CT protocol acquisitions.
Due to the limited number of patients, no external val-idation was performed. Internal valval-idation by leave-one-out already showed a reliable performance, suggesting that a voxel-wise machine learning approach, trained with the appropriate features and number of patients, may help identifying the location of radio-resistant re-gions within the pre-treatment GTV to guide dose escal-ation strategies. FDG PET has a poor resolution at the voxel level, which can complicate the analysis. However, the correlation between the maximal probability of be-longing to GTVfailure and the reliability of the predic-tion provided by the model would help to determine a sub-region of high risk of recurrence.
Textural analysis was extracted from GTV, which was manually defined by a radiation oncologist. Due to the impact of the segmentation method on the textural ana-lysis [43], there is a risk of variability in applying the model in another center. However, several studies did not find significant difference in inter-observer GTV de-lineation of head and neck cancers [44,45].
The algorithm was not obviously evaluated on tumors that do not fail therapy. However, our model aims to identify tumor sub-regions where recurrence is likely to occur, rather than predicting the risk of recurrence. It is possible that the algorithm might identify regions at risk for recurrence in tumors that would be adequately treated with standard therapy. We therefore propose that a prognostic model [23, 43] be used first to identify tumors at risk for local recurrence prior to applying our methodology.
Conclusion
Voxel-wise analysis based on both radiomics and spatial location within the tumor seems to be very promising to identify recurrence origin. The recurrence was not cor-related with FDG-uptake alone, which raises concern on the suitability of using dose tumor painting by numbers. However, a voxel-based prediction of recurrence volume may be of interest to develop instead a new approach of dose tumor painting by recurrence risk. Supplementary data are nevertheless required to confirm the potential of the approach presented in this study to predict the re-currence volume.
Acknowledgements
We thank Loïg Duvergé, Nicolas Jaksic, and Mathias Perazzi for reviewing the registrations.
Authors’ contributions
All authors read and approved the final manuscript. AD, XPN, EC, RdC, and JC were involved in the treatment of the patient and in the acquisition of the images used in the study. JB, OA, RdC, and JC performed the analysis of the data. All authors read and approved the final manuscript.
Funding Not applicable.
Availability of data and materials
The datasets generated and/or analyzed during the current study are available from the corresponding author on reasonable request.
Ethics approval and consent to participate
The study was approved by the ethical research committees OUEST V, Rennes, F-France (reference number: NCT02469922).
Consent for publication
All subjects provided written informed consent prior to be included in the current study.
Competing interests
The authors declare that they have no competing interests.
Received: 27 May 2019 Accepted: 22 August 2019
References
1. Pignon JP, Bourhis J, Domenge C, Designé L. Chemotherapy added to locoregional treatment for head and neck squamous-cell carcinoma: three meta-analyses of updated individual data. MACH-NC Collaborative Group. Meta-Analysis of Chemotherapy on Head and Neck Cancer. Lancet (London, England) [Internet]. 2000 [cited 2017 Dec 30];355(9208):949–955. Available from:http://www.ncbi.nlm.nih.gov/pubmed/10768432
2. Bernier J, Domenge C, Ozsahin M, Matuszewska K, Lefèbvre J-L, Greiner RH, et al. Postoperative irradiation with or without concomitant chemotherapy for locally advanced head and neck cancer. N Engl J Med [Internet]. 2004 [cited 2017 Dec 30]; 350(19):1945–1952. Available from:http://www.ncbi.nlm.nih.gov/pubmed/15128894
3. Bourhis J, Sire C, Graff P, Grégoire V, Maingon P, Calais G, et al. Concomitant chemoradiotherapy versus acceleration of radiotherapy with or without concomitant chemotherapy in locally advanced head and neck carcinoma (GORTEC 99-02): an open-label phase 3 randomised trial. Lancet Oncol [Internet]. 2012 [cited 2017 Dec 30];13(2):145–153. Available from:http:// www.ncbi.nlm.nih.gov/pubmed/22261362
4. Bonner JA, Harari PM, Giralt J, Cohen RB, Jones CU, Sur RK, et al. Radiotherapy plus cetuximab for locoregionally advanced head and neck cancer: 5-year survival data from a phase 3 randomised trial, and relation between cetuximab-induced rash and survival. Lancet Oncol [Internet]. 2010 [cited 2017 Dec 30];11(1):21–28. Available from:http://www.ncbi.nlm.nih.gov/pubmed/19897418
5. Kam MKM, Leung S-F, Zee B, Chau RMC, Suen JJS, Mo F, et al. Prospective randomized study of intensity-modulated radiotherapy on salivary gland function in early-stage nasopharyngeal carcinoma patients. J Clin Oncol [Internet]. 2007 [cited 2017 Dec 30];25(31):4873–4879. Available from:http:// www.ncbi.nlm.nih.gov/pubmed/17971582
6. Nutting CM, Morden JP, Harrington KJ, Urbano TG, Bhide SA, Clark C, et al. Parotid-sparing intensity modulated versus conventional radiotherapy in head and neck cancer (PARSPORT): a phase 3 multicentre randomised controlled trial. Lancet Oncol [Internet]. 2011 [cited 2017 Dec 30];12(2):127– 136. Available from:http://www.ncbi.nlm.nih.gov/pubmed/21236730
7. Pow EHN, Kwong DLW, McMillan AS, Wong MCM, Sham JST, Leung LHT, et al. Xerostomia and quality of life after intensity-modulated radiotherapy vs. conventional radiotherapy for early-stage nasopharyngeal carcinoma: Initial report on a randomized controlled clinical trial. Int J Radiat Oncol [Internet]. 2006 [cited 2017 Dec 30];66(4):981–991. Available from:http://www.ncbi. nlm.nih.gov/pubmed/17145528
8. Feng FY, Kim HM, Lyden TH, Haxer MJ, Worden FP, Feng M, et al. Intensity-modulated chemoradiotherapy aiming to reduce dysphagia in patients with
Oropharyngeal cancer: clinical and functional results. J Clin Oncol [Internet]. 2010 [cited 2017 Dec 30];28(16):2732–2738. Available from:http://www.ncbi. nlm.nih.gov/pubmed/20421546
9. Chajon E, Lafond C, Louvel G, Castelli J, Williaume D, Henry O, et al. Salivary gland-sparing other than parotid-sparing in definitive head-and-neck intensity-modulated radiotherapy does not seem to jeopardize local control. Radiat Oncol [Internet]. 2013 [cited 2017 Dec 30];8:132. Available from:
http://www.ncbi.nlm.nih.gov/pubmed/23721062
10. Zhou J, Fei D, Wu Q. Potential of intensity-modulated radiotherapy to escalate doses to head-and-neck cancers: What is the maximal dose? Int J Radiat Oncol [Internet]. 2003 [cited 2017 Dec 31];57(3):673–682. Available from:https://www.sciencedirect.com/science/article/pii/S0360301603006266
11. Lauve A, Morris M, Schmidt-Ullrich R, Wu Q, Mohan R, Abayomi O, et al. Simultaneous integrated boost intensity-modulated radiotherapy for locally advanced head-and-neck squamous cell carcinomas: II—clinical results. Int J Radiat Oncol [Internet]. 2004 [cited 2017 Dec 31];60(2):374–387. Available from:http://www.ncbi.nlm.nih.gov/pubmed/15380569
12. Pugachev A, Ruan S, Carlin S, Larson SM, Campa J, Ling CC, et al. Dependence of FDG uptake on tumor microenvironment. Int J Radiat Oncol [Internet]. 2005 [cited 2017 Dec 30];62(2):545–553. Available from:https:// www.sciencedirect.com/science/article/pii/S0360301605002956
13. Dirix P, Vandecaveye V, De Keyzer F, Stroobants S, Hermans R, Nuyts S. Dose painting in radiotherapy for head and neck squamous cell carcinoma: value of repeated functional imaging with 18F-FDG PET, 18F-fluoromisonidazole PET, diffusion-weighted MRI, and dynamic contrast-enhanced MRI. J Nucl Med [Internet]. 2009 [cited 2018 Dec 5];50(7):1020–1027. Available from:
http://www.ncbi.nlm.nih.gov/pubmed/19525447
14. Madani I, Duthoy W, Derie C, De Gersem W, Boterberg T, Saerens M, et al. Positron emission tomography-guided, focal-dose escalation using intensity-modulated radiotherapy for head and neck cancer. Int J Radiat Oncol [Internet]. 2007 [cited 2017 Dec 30];68(1):126–135. Available from:http:// www.ncbi.nlm.nih.gov/pubmed/17448871
15. Vanderstraeten B, Gersem W De, Duthoy W, Neve W De, Thierens H. Implementation of biologically conformal radiation therapy (BCRT) in an algorithmic segmentation-based inverse planning approach. Phys Med Biol [Internet]. 2006 [cited 2017 Dec 30];51(16):N277–N286. Available from:
http://www.ncbi.nlm.nih.gov/pubmed/16885610
16. Geets X, Tomsej M, Lee JA, Duprez T, Coche E, Cosnard G, et al. Adaptive biological image-guided IMRT with anatomic and functional imaging in pharyngo-laryngeal tumors: impact on target volume delineation and dose distribution using helical tomotherapy. Radiother Oncol [Internet]. 2007 [cited 2017 Dec 30];85(1):105–115. Available from:http://www.ncbi.nlm.nih. gov/pubmed/17562346
17. Differding S, Sterpin E, Janssens G, Hanin F-X, Lee JA, Grégoire V. Methodology for adaptive and robust FDG-PET escalated dose painting by numbers in head and neck tumors. Acta Oncol (Madr) [Internet] 2016 [cited 2017 Dec 30];55(2): 217–225. Available from:http://www.ncbi.nlm.nih.gov/pubmed/26079436
18. Berwouts D, Olteanu LAM, Duprez F, Vercauteren T, De Gersem W, De Neve W, et al. Three-phase adaptive dose-painting-by-numbers for head-and-neck cancer: initial results of the phase I clinical trial. Radiother Oncol [Internet]. 2013 [cited 2017 Dec 30];107(3):310–316. Available from:http://www.ncbi. nlm.nih.gov/pubmed/23647760
19. Olteanu LAM, Berwouts D, Madani I, De Gersem W, Vercauteren T, Duprez F, et al. Comparative dosimetry of three-phase adaptive and non-adaptive dose-painting IMRT for head-and-neck cancer. Radiother Oncol [Internet]. 2014 [cited 2017 Dec 30];111(3):348–353. Available from:http://www. sciencedirect.com/science/article/pii/S0167814014001297
20. Duprez F, De Neve W, De Gersem W, Coghe M, Madani I. Adaptive dose painting by numbers for head-and-neck cancer. Int J Radiat Oncol [Internet]. 2011 [cited 2017 Dec 30];80(4):1045–1055. Available from:http://www.ncbi. nlm.nih.gov/pubmed/20643512
21. Berwouts D, Madani I, Duprez F, Olteanu AL, Vercauteren T, Boterberg T, et al. Long-term outcome of18F-fluorodeoxyglucose-positron
emission tomography-guided dose painting for head and neck cancer: Matched case-control study. Head Neck [Internet]. 2017 [cited 2017 Dec 30];39(11):2264–2275. Available from:http://www.ncbi.nlm. nih.gov/pubmed/28833829
22. Castelli J, Depeursinge A, Ndoh V, Prior JO, Ozsahin M, Devillers A, et al. A PET-based nomogram for oropharyngeal cancers. Eur J Cancer [Internet]. 2017 [cited 2017 Dec 30];75:222–230. Available from:http://linkinghub. elsevier.com/retrieve/pii/S095980491730076X
23. Castelli J, Depeursinge A, Devillers A, Campillo-Gimenez B, Dicente Y, Prior JO, et al. PET-based prognostic survival model after radiotherapy for head and neck cancer. Eur J Nucl Med Mol Imaging [Internet]. 2018 [cited 2018 Dec 5]; Available from:http://www.ncbi.nlm.nih.gov/pubmed/30132054
24. Mohamed ASR, Cardenas CE, Garden AS, Awan MJ, Rock CD, Westergaard SA, et al. Patterns-of-failure guided biological target volume definition for head and neck cancer patients: FDG-PET and dosimetric analysis of dose escalation candidate subregions. Radiother Oncol [Internet]. 2017 [cited 2017 Oct 3];124(2):248–255. Available from:http://www.ncbi.nlm.nih.gov/ pubmed/28774596
25. Chaput A, Calais J, Robin P, Thureau S, Bourhis D, Modzelewski R, et al. Correlation between fluorodeoxyglucose hotspots on pretreatment positron emission tomography/CT and preferential sites of local relapse after chemoradiotherapy for head and neck squamous cell carcinoma. Head Neck [Internet]. 2017 [cited 2019 Jul 11];39(6):1155–1165. Available from:
http://doi.wiley.com/10.1002/hed.24738
26. Legot F, Tixier F, Hadzic M, Pinto-Leite T, Gallais C, Perdrisot R, et al. Use of baseline 18F-FDG PET scan to identify initial sub-volumes with local failure after concomitant radio-chemotherapy in head and neck cancer. Oncotarget [Internet]. 2018 [cited 2018 Nov 21];9(31):21811–21819. Available from:http://www.ncbi.nlm.nih.gov/pubmed/29774104
27. Lambin P, Rios-Velazquez E, Leijenaar R, Carvalho S, van Stiphout RGPM, Granton P, et al. Radiomics: extracting more information from medical images using advanced feature analysis. Eur J Cancer [Internet]. 2012 [cited 2017 Dec 26];48(4):441–446. Available from:http://www.ncbi.nlm.nih.gov/ pubmed/22257792
28. Gillies RJ, Kinahan PE, Hricak H. Radiomics: images are more than pictures, they are data. Radiology [Internet]. 2016 [cited 2018 Nov 22];278(2):563–577. Available from:http://pubs.rsna.org/doi/10.1148/radiol.2015151169
29. Orlhac F, Nioche C, Soussan M, Buvat I. Understanding changes in tumor texture indices in PET: a comparison between visual assessment and index values in simulated and patient data. J Nucl Med [Internet]. 2017 [cited 2018 Dec 5];58(3):387–392. Available from:http://www.ncbi.nlm.nih.gov/ pubmed/27754906
30. Mohan R, Wu Q, Manning M, Schmidt-Ullrich R. Radiobiological considerations in the design of fractionation strategies for intensity-modulated radiation therapy of head and neck cancers. Int J Radiat Oncol [Internet]. 2000 [cited 2017 Sep 27];46(3):619–630. Available from:http:// www.sciencedirect.com/science/article/pii/S0360301699004381
31. Ourselin S, Roche A, Subsol G, Pennec X, Ayache N. Reconstructing a 3D structure from serial histological sections. Image Vis Comput [Internet]. 2001 [cited 2017 Sep 27];19(1–2):25–31. Available from:http://www.sciencedirect. com/science/article/pii/S0262885600000524
32. Ourselin S, Pennec X, Stefanescu R, Malandain G, Ayache N. Robust registration of multi-modal medical images: towards real-time clinical applications. 2001 [cited 2017 Sep 27]; Available from: https://hal.archives-ouvertes.fr/inria-00072254/
33. Danielsson P-E. Euclidean distance mapping. Comput Graph Image Process [Internet]. 1980 [cited 2017 Dec 22];14(3):227–248. Available from:http:// www.sciencedirect.com/science/article/pii/0146664X80900544
34. Zwanenburg A, Leger S, Vallières M, Löck S, Initiative for the IBS. Image biomarker standardisation initiative. 2016 [cited 2017 Dec 26]; Available from:http://arxiv.org/abs/1612.07003
35. Haralick RM, Shanmugam K, Dinstein I. Textural features for image classification. IEEE Trans Syst Man Cybern [Internet]. 1973 [cited 2017 Oct 2];SMC-3(6):610–621. Available from:http://ieeexplore.ieee.org/ document/4309314/
36. Wilcoxon F. Individual comparisons by ranking methods. Biometrics Bull [Internet]. 1945 [cited 2017 Oct 2];1(6):80. Available from:http://www.jstor. org/stable/10.2307/3001968?origin=crossref
37. Breiman L. Random Forests. Mach Learn [Internet]. 2001 [cited 2017 Oct 2];45(1):5–32. Available from:http://link.springer.com/10.1023/A:1 010933404324
38. Malley JD, Kruppa J, Dasgupta A, Malley KG, Ziegler A. Probability machines: consistent probability estimation using nonparametric learning machines. Methods Inf Med [Internet]. 2012 [cited 2017 Oct 2];51(1):74–81. Available from:http://www.ncbi.nlm.nih.gov/pubmed/21915433
39. Wright MN, Ziegler A. ranger: A Fast Implementation of random forests for high dimensional data in C++ and R. 2015 [cited 2017 Oct 2]; Available from:http://arxiv.org/abs/1508.04409
40. Breiman L. OUT-OF-BAG ESTIMATION. 1996 [cited 2017 Dec 22]; Available from:https://www.stat.berkeley.edu/~breiman/OOBestimation.pdf
41. Díaz-Uriarte R, Alvarez De Andrés S. Variable selection from random forests: application to gene expression data. [cited 2017 Dec 24]; Available from:
http://ligarto.org/rdiaz
42. Parekh V, Jacobs MA. Radiomics: a new application from established techniques. Expert Rev Precis Med drug Dev [Internet]. 2016 [cited 2017 Dec 22];1(2):207–226. Available from:http://www.ncbi.nlm.nih.gov/ pubmed/28042608
43. Guezennec C, Bourhis D, Orlhac F, Robin P, Corre J-B, Delcroix O, et al. Inter-observer and segmentation method variability of textural analysis in pre-therapeutic FDG PET/CT in head and neck cancer. Hutson AD, editor. PLoS One [Internet]. 2019 [cited 2019 Jul 11];14(3):e0214299. Available from:
http://dx.plos.org/10.1371/journal.pone.0214299
44. Breen SL, Publicover J, De Silva S, Pond G, Brock K, O’Sullivan B, et al. Intraobserver and interobserver variability in GTV delineation on FDG-PETCT images of head and neck cancers. Int J Radiat Oncol [Internet]. 2007 [cited 2019 Jul 11];68(3):763–770. Available from:http://www.ncbi.nlm.nih.gov/ pubmed/17379435
45. Gudi S, Ghosh-Laskar S, Agarwal JP, Chaudhari S, Rangarajan V, Nojin Paul S, et al. Interobserver variability in the delineation of gross tumour volume and specified organs-at-risk during IMRT for head and neck cancers and the impact of FDG-PET/CT on such variability at the primary site. J Med Imaging Radiat Sci [Internet]. 2017 [cited 2019 Jul 11];48(2):184–192. Available from:
https://www.sciencedirect.com/science/article/pii/S1939865416301679
Publisher’s Note
Springer Nature remains neutral with regard to jurisdictional claims in published maps and institutional affiliations.