2
3
4
Different molecular assemblies in two new phosphoric triamides with the
5same C(O)NHP(O)(NH)
2skeleton: crystallographic study and Hirshfeld
6surface analysis
78
Anahid Saneei
1, Mehrdad Pourayoubi*
1, Titus A. Jenny
2, Aurelien Crochet
3, Katharina
9
M. Fromm
3, Ekaterina S. Shchegravina
410
11
1
Department of Chemistry, Faculty of Sciences, Ferdowsi University of Mashhad, Mashhad,
12Iran, Tel: +985138805535, Fax: +985138807153, P.O. Box: 9177948974
13
2
Department of Chemistry, University of Fribourg, Rte du Musée 9 Ch-1700 Fribourg,
14Switzerland
15
3
Fribourg Centre for Nanomaterial’s, FriMat, University of Fribourg, Chemin du Musée 3,
16CH-1700 Fribourg, Switzerland
17
4
Department of Organic Chemistry, UNN Lobachevsky State University, Gagarin av., 23,
18Nizhny Novgorod, Russia
19
20
*
Corresponding author, e-mail: [email protected] (Mehrdad Pourayoubi)
21 22
Received [Dates will be filled in by the Editorial office]
2324
2
List of Figures
2728
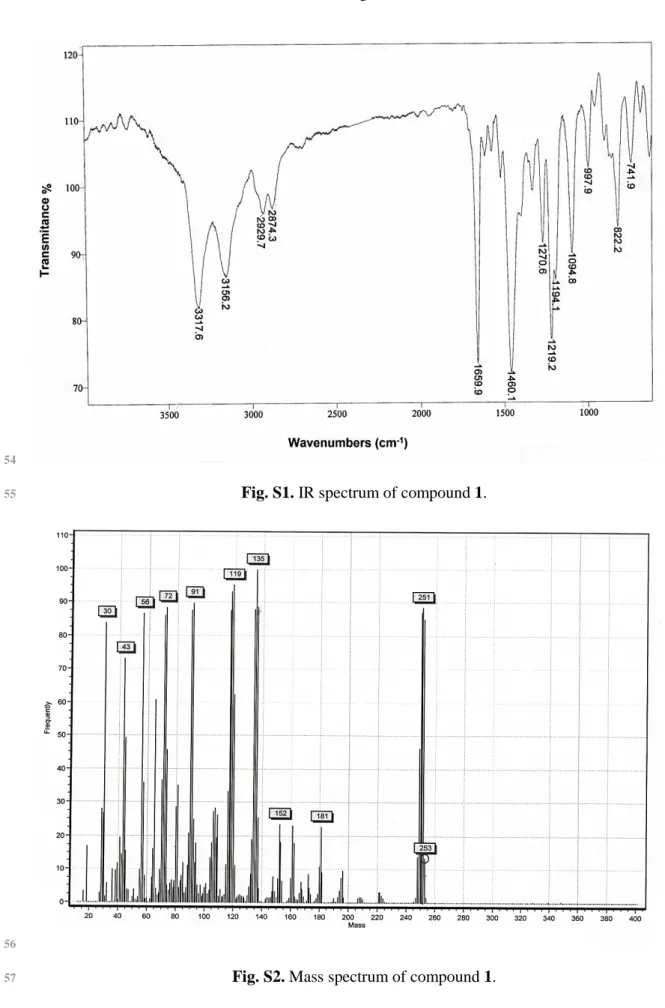
Fig. S1. IR spectrum of compound 1.
29
Fig. S2. Mass spectrum of compound 1.
30
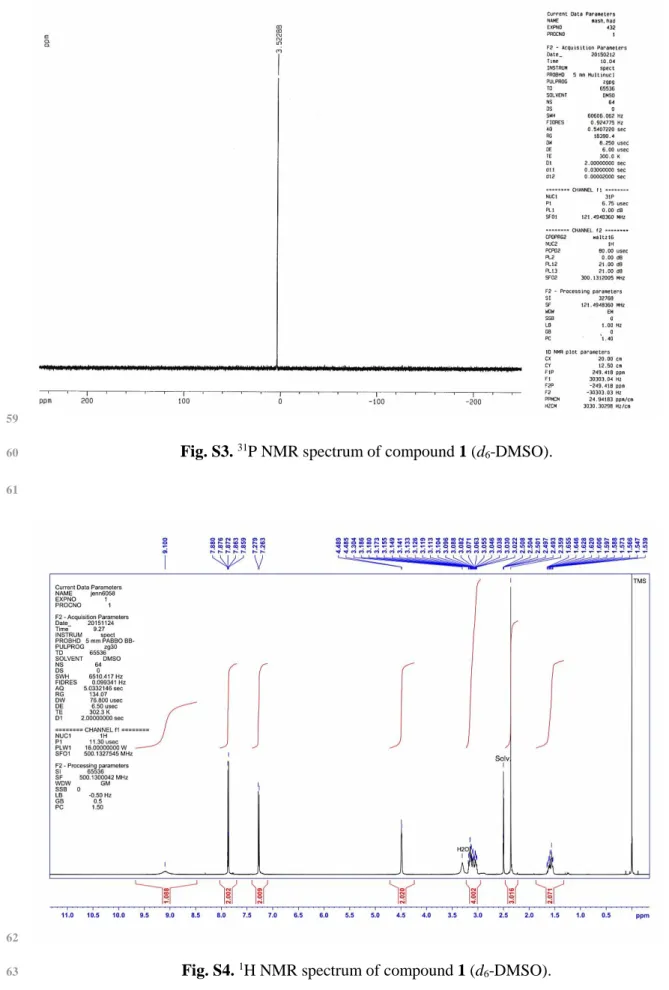
Fig. S3. 31P NMR spectrum of compound 1 (d6-DMSO).
31
Fig. S4. 1H NMR spectrum of compound 1 (d6-DMSO).
32
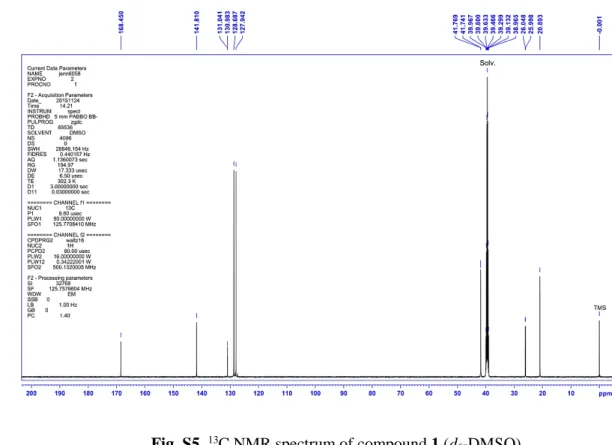
Fig. S5. 13C NMR spectrum of compound 1 (d6-DMSO).
33
Fig. S6. 1H–15N HSQC spectrum of compound 1.
34
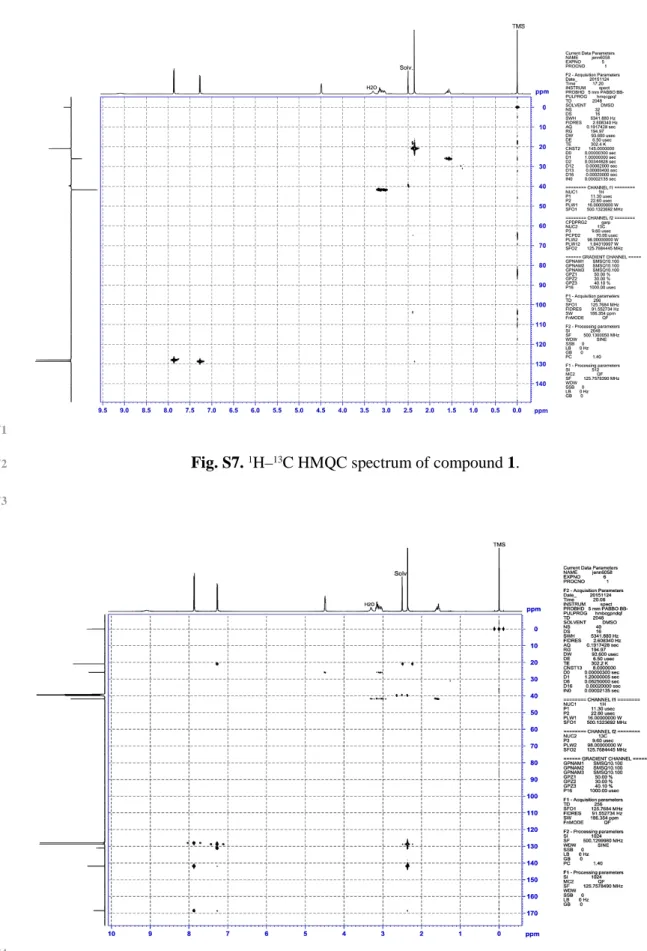
Fig. S7. 1H–13C HMQC spectrum of compound 1. 35
Fig. S8. 1H–13C HMBC spectrum of compound 1. 36
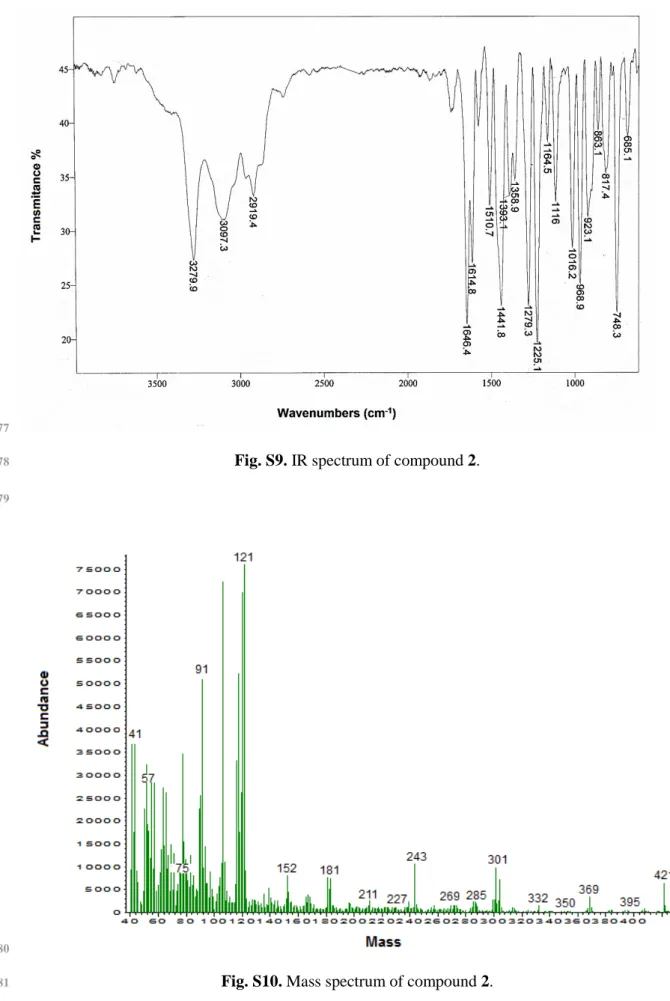
Fig. S9. IR spectrum of compound 2.
37
Fig. S10. Mass spectrum of compound 2.
38
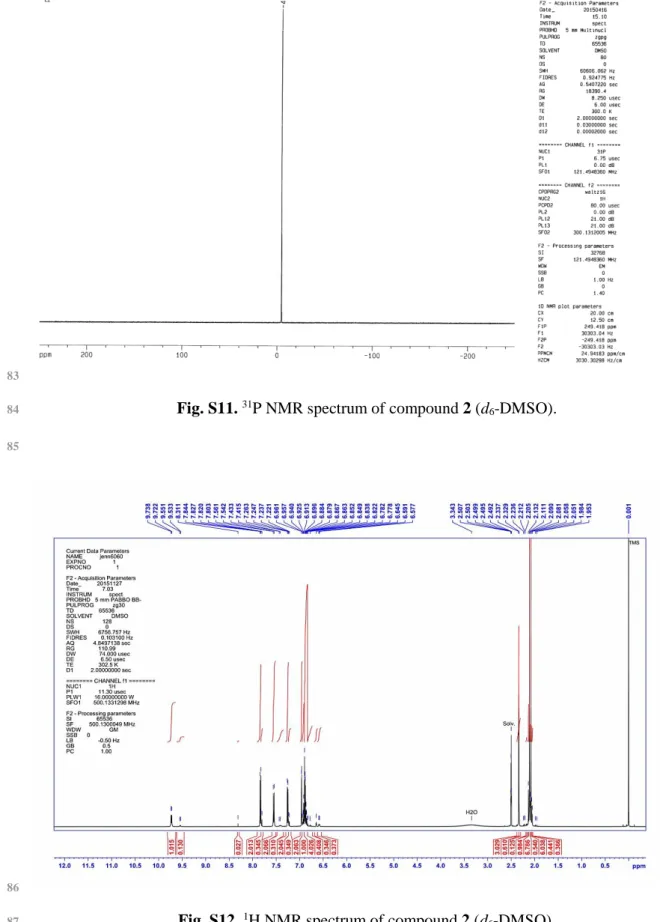
Fig. S11. 31P NMR spectrum of compound 2 (d6-DMSO).
39
Fig. S12. 1H NMR spectrum of compound 2 (d6-DMSO).
40
Fig. S13. 13C NMR spectrum of compound 2 (d6-DMSO).
41
Fig. S14. 1H–15N HSQC spectrum of compound 2.
42
Fig. S15. 1H–13C HMQC spectrum of compound 2.
43
Fig. S16. 1H–13C HMBC spectrum of compound 2.
44 45 46 47 48 49 50 51 52
54
Fig. S1. IR spectrum of compound 1.
55
56
Fig. S2. Mass spectrum of compound 1.
4
59
Fig. S3. 31P NMR spectrum of compound 1 (d6-DMSO).
60
61
62
Fig. S4. 1H NMR spectrum of compound 1 (d6-DMSO).
65
Fig. S5. 13C NMR spectrum of compound 1 (d6-DMSO).
66
67
68
Fig. S6. 1H–15N HSQC spectrum of compound 1.
6
71
Fig. S7. 1H–13C HMQC spectrum of compound 1. 72
73
74
Fig. S8. 1H–13C HMBC spectrum of compound 1. 75
77
Fig. S9. IR spectrum of compound 2.
78
79
80
Fig. S10. Mass spectrum of compound 2.
8
83
Fig. S11. 31P NMR spectrum of compound 2 (d6-DMSO).
84
85
86
Fig. S12. 1H NMR spectrum of compound 2 (d6-DMSO).
89
Fig. S13. 13C NMR spectrum of compound 2 (d6-DMSO).
90
91
Fig. S14. 1H–15N HSQC spectrum of compound 2.
10
94
Fig. S15. 1H–13C HMQC spectrum of compound 2.
95
96
97
Fig. S16. 1H–13C HMBC spectrum of compound 2.