© Japanese Society of Electron Microscopy Journal of Electron Microscopy 49(1): 61-65 (2000)
Full-length paper
HAPNBloch waves and weak-beam imaging of crystals
Helge Heinrich and Gernot Kostorz
ETH Zurich, Institut fur Angewandte Physik, CH-8093 Zurich, Switzerland
HAFN Special Issue
Abstract The influence of the number of diffracted beams on weak-beam contrast simu-lations of thickness contour lines and dislocation images is investigated. For large deviation parameters sj>thickness contour lines from two-beam tions are similar to those from many-beam simulations. In many-beam simula-tions of wedge-shaped bent samples extra thickness contour lines appear at locations with Q, 3g). These extra lines occur between the imaging condition
(g, -g) and (g, 3g). Therefore, in the case of a more symmetrical imaging condition
many-beam simulations are mandatory. In bent samples the contributions of different Bloch waves to weak-beam images change as a function of the imaging conditions (g, x~g). Near (g, 3.5 5) two Bloch waves dominate. In the case of x <3 two other Bloch waves with different wavelengths are most important for the image contrast. The 'classical' (g, 3g) weak-beam condition is not suitable to determine signs and magnitudes of Burgers vectors from terminating thickness contour lines. Higher deviation parameters sj> are necessary, especially for dense dislocation arrangements.
Keywords transmission electron microscopy, Bloch waves, weak-beam imaging, thick-ness contour lines, bending
Received l i December 1998, accepted 26 October 1999
Introduction
The signs and the magnitudes of Burgers vectors can be determined by matching weak-beam contrast simulations to corresponding dislocation images. This method has been successfully applied by Head et al. [I] on dissociated dislocations and dislocation dipoles. Forwood and Clarebrough [2] determined the Burgers vectors of inter-facial dislocations by comparison with computed 'double two-beam' images. Schaublin and Stadelmann [3] showed that, in general, more than two beams have to be consid-ered for weak-beam image simulations. The determination of the directions and the magnitudes of the Burgers vectors is especially important in materials containing ordinary and superdislocations. Dislocations of type 2 [110], [101], andj[112] are present in materials with Ll0
structure, e.g. y-TiAl. Viguier et al. [4] determined the type of faulted dipoles in TiAl by comparing experimental and simulated weak-beam images. In the case of residual contrast and elastically anisotropic materials a full analysis of weak-beam dislocation images by contrast simulations is necessary to determine the Burgers vector [5] from the invisibility criterion (g -~$= 0).
Ishida etal. [6] determined the signs and the magnitudes of Burgers vectors of complete dislocations from the
number of terminating thickness contour lines n = ~g • ~t at the intersection points of the dislocations with the sample surfaces. No image contrast simulations are neces-sary for this procedure, and the Burgers vectors of different dislocations in a sample area can be determined easily, e.g. in TiAl [7]. Alternative imaging methods to determine Burgers vectors are based the asymmetry of the contrast features [8] or on the distortion of extinction bands near a dislocation [9]. Convergent-beam electron diffraction can also be used to determine the magnitudes of Burgers vectors of individual dislocations from the number
n =g • ~S of interruptions of higher-order Laue-zone
lines [10].
In the present work terminating thickness contour lines at the exit points of dislocations are analysed. The effective extinction distance cjjff and therefore the distance of thickness contour lines in an image decreases, if the deviation parameter sj+increases [11]. Especially for dense dislocation arrangements the number of terminating thickness fringes can only be determined unequivocally if the contour lines are closely spaced. In the following it is shown that for a different reason (g, 3g) is not an appropriate weak-beam condition to determine the magnitude of a Burgers vector. Imaging conditions with higher deviation parameters have to be used.
Theory
If a sample is bent, a local lattice tilt du/dz modifies the deviation parameters s; to
dz
where ~g*j are the different scattering vectors. For image contrast simulations of bent wedge-shaped samples the many-beam Howie-Whelan equations [11] are used:
in
dw w in — = M V with Mik =— + 5
d? = — Jk \ JJk * ' • <" In this equation £;;-A is the extinaion length (including an
imaginary pan for absorption) for scattering from the ;-th to the k-th beam. The values have been determined from the EMS package [12]. For a constant lattice tilt contribution
dz t n e amplitudes of the different
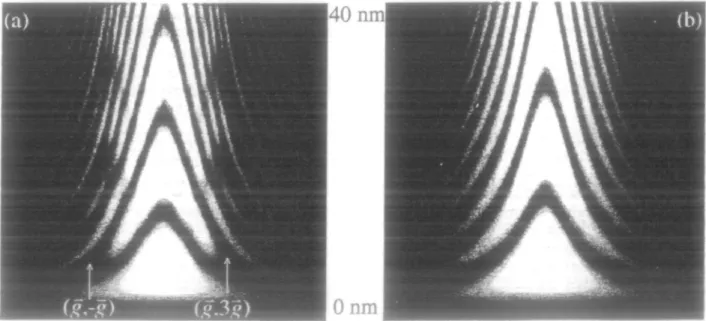
Fig. 1 (a) Thickness contour lines in a bent y-TlAl sample obtained with a JEOL200CX operating at 200 kv. J - l l l , incident beam direction [1.0 -1.6 0.6], (b) Many-beam image simulation of a dislocation with ^[110] Burgers veaor and [ 1 9 - 1 -20] line vector in a wedge-shaped sample with beams -2$ to 5<?.
40 n.
Onm
H. Heinrich and G. Kostorz Block waves and weak-beam imaging 63
beams vy; can be determined using the matrix T of
eigen-vectors of M and the diagonal matrix F containing the eigenvalues K/ of M as diagonal elements of the form
+
(4)• Az) = | F r V ( z ) (2)
The matrix T ~l represents a transformation into thecoordinate system of the Bloch waves y,. The imaginary parts of </ are the magnitudes of the wave vectors of the Bloch waves. The amplitudes and the phases of the Bloch waves are simply altered by exp(K;Az). The matrix T
contains the contributions of the Bloch waves to the different diffracted beams'^.
If distortions by defects are present, the matrix M is not constant along the beam direction z. Thus, the eigenvalues of M have to be determined several times for each position in an image. To reduce the computing time, Head et al. [1] introduced the generalized cross section for parallel dislocations. Here, instead of the lattice tilt ditldz the displacements ~it{z) are used:
in \
—— + bjkisj exp (2m(g}-fk) -"ifa) = (3) Si* '
exp
(-resulting in:
exp
Here, the diagonal matrix L contains the eigen values X;
in the form of exp(X/Az). The eigenvectors N are found in the matrix S. L and S do not depend on local distortions introduced by crystal defects. The matrix U(z) contains only diagonal elements of the form exp (27ri^ • "u*). The equations (1) and (3) are equivalent [13], but contrast calculations of defects using eqn. (4) are much faster as the eigenvalues of N have to be determined only once for a whole image [7] as N is constant. However, in the case of an additional sample bending the eigenvalues of N have to be determined for each position. The displacement field ~t?(z) of dislocations in elastically anisotropic media is determined using the theory of Stroh [14]. Surface relaxation [15] has not been taken into account.
Results
A weak-beam image of a dislocation in a bent y-TiAl sample is shown in Fig. la. At one exit point of the dislocation two terminating thickness fringes are found, whereas on the other side only one contour line terminates. In this case, the magnitude of the Burgers vector can not be determined unequivocally by the method of Ishida et al. [6]. In many-beam image
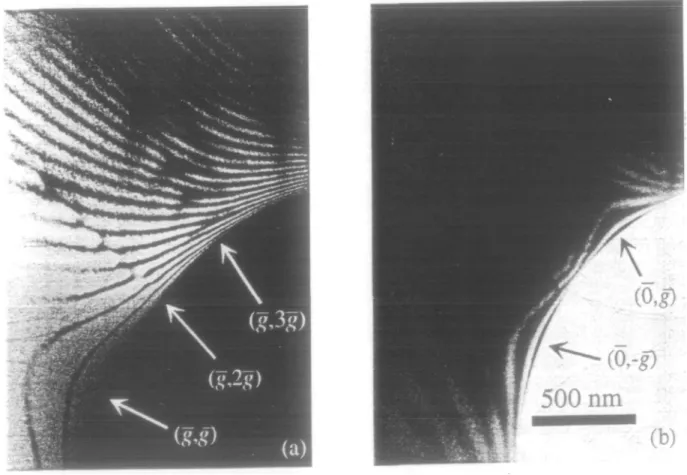
(0,8)
(0,-g)
500 nm ,
(b)
Fig. 3 (a) Dark-field image of thickness contour lines in a bent y-TiAl sample ( H I reflection). (b) Bright-Beld image of the same area. [-43 1 ] beam direction. Between both images no sample tilt exists.
simulations of a bent sample with (Fig. lb) and with-out (Fig. 2a) a dislocation, thickness contour lines dissoci-ate near positions with (§, 3 | ). Extra thickness contour lines appear for low deviation parameters Sf. For weak-beam conditions between ( # , - # ) and Q , 3$ ) , two-beam (Fig. 2b) and many-two-beam simulations (Fig. 2a) of thickness contour lines differ significantly.
Figure 3 shows experimental images of thickness contour lines of a bent sample. A splitting of contour lines appears in dark-field images (Fig. 3a) for a systematic row of excited beams. In bright-field images of bent samples dissociations of thickness contour lines occur, too (Fig. 3b).
The extinction length
271
depends on the difference of the wave vectors Kj and K2
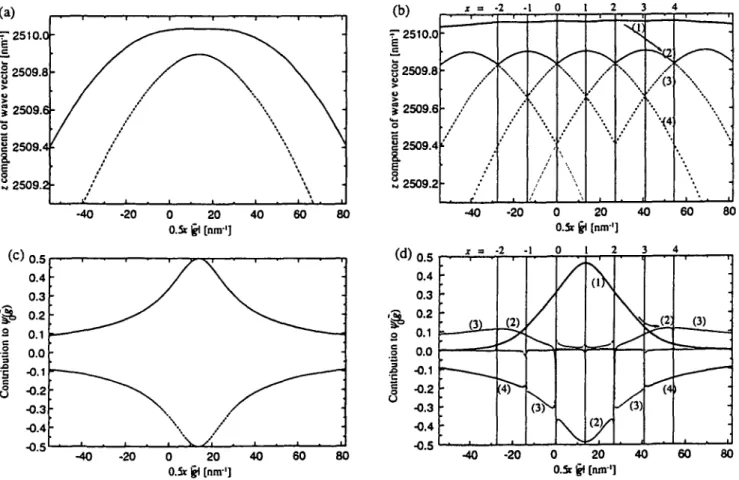
of the two most important Bloch waves for a reflection # . Wave vectors of Bloch waves in a bent sample can be represented in a graph of dispersion surfaces (Figs 4a and 4b). A bending of the sample is equivalent to a shift of the centre of the Ewald sphere parallel to the direaion of the systematic row of beams. Twice its shift corresponds to the index x$ defining the weak-beam condition ( $, x
]) ). The difference of the wave vectors of the two Bloch
waves is smallest for {§ , 1$ ). Therefore, the extinction length is high and the distance of the thickness contour lines in a bent sample shows a maximum at s^ =0 with 4eff= §f (Fig. 2b). For two-beam calculations the
extinction length is smaller than in a many-beam simula-tion with x <3 as the distances of the two most important dispersion surfaces depend on the number of beams. For x > > 3 the extinction length obtained by two-beam calculations is similar to the result of many-beam simu-lations.
In many-beam simulations of bent samples the two most important Bloch waves (Fig. 4d) depend on the imaging condition. At the positions with Q , 2§ ) and ( # , 3$) the two most important Bloch waves change. At ( 3 - 2 | ) the change in the extinction length is small, as the wave vectors of the two Bloch waves (2) and (3) in Fig. 4b are similar. Near ( 5 , 3# ) a change of the importance of the two Bloch waves (1) and (2) occurs (Fig. 4d). Their wave vectors are significantly different (Fig. 4b). The difference between the wave vectors (2) and (4) is smaller than between (1) and (3). Therefore, if the Bloch waves (1) and (3) are the most important ones for the beam # extra thickness contour lines are present. They terminate near ( £ , 3£ ), as for higher deviation parameters, (2) and (4) are the most important Bloch waves. -40 -20 0 20 40 60 80 -40 -20 0 20 40 60 80 (b) £ 2510.0 § 2509.8 Si o § 2509.6 tot \ 1 2509.4
a.
S 2509.2 X = • • / • 2 I ( * ) \ / \ \ 2 / 3 t ' AX
4 I -) 0.5 0.4 0.3°'
2
0.1 o.o -0.1 -0.2 •0.3 •0.4 -0.5 -40 -20 0 20 40 0.5t & [nnr'] 1 60 80-
1°
-(2) /s
• --40 -20 0 20 40 0.5t g( [run1] 60 80Fig. 4 Dispersion surfaces (a) for the two-beam case and (b) for six beams. Contributions of the different Bloch waves to the amplitude of the 111 reflection (c) for the two-beam case and (d) for six beams.
H. Heinrich and G. Kostorz Block waves and weak-beam imaging 65
The effect of a dissociation of thickness contour lines occurs as soon as three beams are taken into account for an image simulation. For three beams only one dissociation occurs, in the case of a systematic row of the beams.5, #, 2 | for $, 3 $), in the case of the beams -#. 9 , 3 for (^ , - 1 ) . Figure 2a shows that the distance of the dissociations for $ , 3$ ) equals the distance of the thickness contour lines for the exact Bragg condition (3 ,
3 ) . The difference of the wave vectors of the Bloch wave
(1) and (2) in Fig. 4b is related to the occurrence of extra thickness contour lines at ( | , 3$) for thicknesses
d = Im 27t - K2
Concluding remarks
The weak-beam condition $ , 3 # ) is not an appropriate imaging condition for the determiation of the magnitude of a Burgers vector from the number of terminating thickness contour lines. Extra thickness contour lines occur if more than two beams are considered in a simula-tion of a bent wedge-shaped sample. In many-beam simulations extra thickness contour lines also terminate at positions with $ ,-#). No further extra thickness contour lines appear for weak-beam conditions Q , x$ ) with x > 3 . Thus, the length of a Burgers vector can only be determined accurately by the method of Ishida et al. [6] if x is considerably larger than 3. Furthermore, a local strain analysis from the shift of thickness contour lines in two different weak-beam images [16] is only possible for x > 3 . Weak-beam images are only easily interpretable for large deviation parameters. For all bent materials the dissociation of thickness contour lines occurs near (#, 3 # ) for weak-beam images using any systematic row of beams. The dissociation is a consequence of the scattering potential V(| ) and therefore the extinction length cj3 .
microscope dislocation images in cubic and non-cubic structures. Mater. Sci. Eng. A 234-236: 347-350.
8 Marukawa K (1979) A new method of Burgers vector identification from electron microscope images. Phil. Mag. A 40: 303-312. 9 Bollmann W (1966) Size and sign of the Burgers vector from
transmission micrographs. Phil. Mag. 13: 935-944.
10 Carpenter R W and Spence J C H (1982) Three-dimensional strain-field information in convergent-beam electron diffraction patterns. Acta Cyst. A 38: 55--61.
11 Howie A and Whelan M J (1961) Diffraction contrast of electron microscope images of crystal lattice defects, n. The development of a dynamical[theory. Proc. R. Soc. A 263: 217-237.
12 Stadelmann P A (1987) EMS - a software package for electron diffraction analysis and HREM image simulation in materials science. Ultramicroscopy 21: 131-146.
13 Hirsch P, Howie A, Nicholson R B, Pashley D W, and Whelan M J (1977) Electron microscopy of thin crystak.(R.E. Krieger Publishing, Malabar, Florida).
14 Stroh A N (1958) Dislocations and cracks in anisotropic elasticity. Phil. Mag. 3: 625-646.
15 Eshelby J D and Stroh A N (1951) Dislocations in thin plates. Phil. Mag. 42: 1401-1405.
16 Heinrich H, Krai F, and Kostorz G (1997) Analysis of interfaces and stress fields in lamellar TiAJ/Ti3Al by transmission electron microscopy. In: Proceedings of the Swiss-Japan Joint Seminar on Electron Microscopy in Material Sciences, eds Shiojiri M, Gunter J R, Nishio K, pp. 53-56, (Nakanishi Printing, Kyoto).
References
1 Head A K, Humble P. Clarebrough L M, Morton A J, and Forwood C T (1973) Computed electron micrographs and defect identification. In: Defects in Crystalline Solids 7, eds Amelinckx S, Gevers R, Nihoul J, (North-Holland, Amsterdam).
2 Forwood C T and Clarebrough L M (1991) Electron Microscopy of Interfaces in Metals and Alloys, (A. Hilger,
Bristol)-3 SchSublin R and Stadelmann P (199Bristol)-3) A method for simulating electron microscope dislocation images. Mater. Sci. Eng. A 164: 373-378.
4 Viguier B, Hemker K J, and Vanderschaeve G (1994) Factors affecting stacking fault contrast in transmission electron microscopy, Comparison with image simulations. Phil. Mag. A 69: 19-32. 5 Douin J, Veyssiere P. and Saada G (1998) Comparison between
simulated weak-beam images: application to the extinction criterion in elastically anisotropic crystals. Phil. Mag. A 77: 1323-1340. 6 Ishida Y, Ishida H, Kohra K, and Ichinose H (1980) Determination
of the Burgers vector of a dislocation by weak-beam imaging in a HVEM. Phil. Mag. A 42: 453-462.