HAL Id: hal-02923778
https://hal.archives-ouvertes.fr/hal-02923778
Submitted on 3 Feb 2021
HAL is a multi-disciplinary open access
archive for the deposit and dissemination of
sci-entific research documents, whether they are
pub-lished or not. The documents may come from
teaching and research institutions in France or
abroad, or from public or private research centers.
L’archive ouverte pluridisciplinaire HAL, est
destinée au dépôt et à la diffusion de documents
scientifiques de niveau recherche, publiés ou non,
émanant des établissements d’enseignement et de
recherche français ou étrangers, des laboratoires
publics ou privés.
Deuterium and oxygen 18 in precipitation: Isotopic
model, including mixed cloud processes
Philippe Ciais, Jean Jouzel
To cite this version:
Philippe Ciais, Jean Jouzel. Deuterium and oxygen 18 in precipitation: Isotopic model, including
mixed cloud processes. Journal of Geophysical Research, American Geophysical Union, 1994, 99
(D8), pp.16793. �10.1029/94JD00412�. �hal-02923778�
JOURNAL OF GEOPHYSICAL RESEARCH, VOL. 99, NO. D8, PAGES 16,793-16,803, AUGUST 20, 1994
Deuterium and oxygen 18 in precipitation:
Isotopic model, including mixed cloud processes
Philippe Ciais I and Jean Jouzel:
Laboratoire de Modelisation du Climat et de l'Environnement, DSM, Gif-sur-Yvette, France
Abstract. Modeling the isotopic ratios of precipitation in cold regions meets the
problem of "switching" from the vapor-liquid transition to the vapor-ice transition at
the onset of snow formation. The one-dimensional model (mixed cloud isotopic model
(MCIM)) described in this paper focuses on the fractionation of water isotopes in
mixed clouds, where both liquid droplets and ice crystals can coexist for a given range
of temperatures. This feature is linked to the existence of specific saturation conditions
within the cloud, allowing droplets to evaporate while the water vapor condensates
onto ice crystals. The isotopic composition
of the different airborne phases and the
precipitation
is calculated throughout
the condensation
history of an isolated air mass
moving over the Antarctic ice sheet. The results of the MCIM are compared to surface
snow data both for the isotopic ratios and the deuterium excesses.
The sensitivity of
the model is compared to previous one-dimensional
models. Our main result is that
accounting
specifically
for the microphysics
of mixed stratiform clouds (Bergeron-
Findesein process) does not invalidate the results of earlier modeling studies.
1. Introduction
The study of the deuterium and oxygen 18 distributions in natural waters proves to be very useful in such fields as cloud physics, climatology, hydrology, and paleoclimate studies. Usually, data acquisition is combined with the modeling of isotopic fractionations occurring at various stages of the water cycle and the interpretation takes advan- tage of the relationships which exist between isotopic distri- butions and various, generally climate-related parameters. The purpose of isotopic models is to predict the global scale deuterium and oxygen 18 distributions in water vapor, clouds, and precipitations. For both isotopes, the isotopic mass ratios (R) are conventionally expressed in the a scale
relative to the SMOW standard:
R - Rs•qow
a = x 1000 (units %0)
Rs•qow
Isotopic models fall in two categories. Dynamically simple models deal with processes occurring in isolated air masses. They are generally based on Rayleigh condensation models assuming immediate removal of precipitation [Dansgaard, 1964; Friedman et al., 1964; Taylor, 1972; Siegenthaler and Matter, 1983; Jouzel and Merlivat, 1984]. Though being indispensable tools in understanding field isotope data and their relationships with climatic variables, these simple models do not account for the complexity of the dynamical
processes involved in the formation of precipitation. To deal
with these latter aspects, the isotopic cycles have been
1Also at Stable Isotope Laboratory, University of Colorado
INSTAAR, Boulder.
2Also at Laboratoire de Glaciologie et de G6ophysique de l'En-
vironnement, St. Martin-d'H/•res, France.
Copyright 1994 by the American Geophysical Union. Paper number 94JD00412.
0148-0227/94/94JD-00412505.00
introduced into general circulation models (GCMs), that consider this dynamical complexity [Joussaume et al., 1984; Jouzel et al., 1987]. Besides those two approaches, an intermediate two-dimensional isotopic model has been de- veloped by Fisher [Fisher and Alt, 1985; Fisher, 1990]. Both simple models and GCMs are very complementary and are now being developed in parallel.
One of the advantages of simple models is their ability to account for the complexity of cloud microphysics and its
interplay with the various fractionation processes occurring
at each phase change of the water in the atmosphere, while those processes can only be parameterized in dynamically complex models. As reviewed by Jouzel [1986], this com- plexity is due to the following reasons: Two types of isotopic fractionations are involved. An equilibrium fractionation, arising from lower saturation vapor pressure of heavy spe-
cies HDO and H2•80 compared
to the main component
H2•60, and a kinetic
effect
resulting
from differences
in the
molecular diffusivities in air of these molecules. Liquid and solid phases have to be treated separately, because, unlike liquid droplets, the cloud solid (ice crystals, large ice parti- cles, or hailstones) is not isotopically homogeneous. Ice crystals are out of isotopic equilibrium due to low diffusion of molecules in solid and the variable history of the air mass producing the solid. Liquid droplets whose radius is less than 30 /xm can be considered at any time in isotopic
equilibrium with the surrounding water vapor [Jouzel et al.,
1975]. Raindrops of radius larger than 30 /xm are out of isotopic equilibrium because of their large isotopic relax- ation times.
With this in mind, Jouzel et al. [1980] and Federer et al. [1982] have incorporated into a cloud model the equations describing the isotopic fluxes among vapor, droplets (cloud water), raindrops (rainwater), ice crystals (cloud ice), grau- pels, and hailstones. This model represents a very elaborate
description of isotopic processes occurring in clouds, but its
use is limited to the study of isolated convective clouds and 16,793
16,794 CIAIS AND JOUZEL: DEUTERIUM AND OXYGEN 18 IN PRECIPITATION
it would not be appropriate for describing the isotopic history of an air mass from its oceanic source to, for example, the polar ice caps. Also, it does not adequately account for the two important following points: First, one has to consider a drop size spectrum rather than a fixed radius drop population, as partially addressed by Federer et al. [1982]. However, this point is important only for convec- tive clouds and will not be further discussed here. Second, if both liquid droplets and ice crystals are to coexist for a given range of temperatures, then neither the droplets nor the crystals will be in isotopic equilibrium [Jouzel and Merlivat,
1984].
This is due to the so-called Bergeron-Findesein process which plays a key role in the formation of ice crystals [Rogers, 1979]. This physical mechanism discussed by Berg- eron [1935] had been formulated as early as 1911 by Wegener (quoted by Mason [1971]): "The vapor tension will adjust
itself to a value in between the saturation values over ice and
water. The effect of this must then be that condensation will
take place continually until the liquid phase is entirely consumed." In mixed clouds, i.e., clouds containing both liquid water and ice, the environment should thus be under- saturated with respect to the liquid phase while supersatu- rated with respect to the solid phase. If so, the liquid droplets tend to evaporate, while two phase transitions can lead to ice formation: direct deposition of vapor onto the existing crystals by inverse sublimation and freezing of supercooled droplets. Ice crystals usually begin to appear in clouds when the temperature drops below -15øC, while supercooled droplets end at temperatures as low as -40øC, the homogeneous freezing threshold [Rogers, 1979].
From an isotopic point of view, the Bergeron-Findesein process may be neglected in convective clouds, as noted by Federer et al. [1982], but probably not in stratiform clouds where the formation of polar precipitation takes place [Jouzel and Merlivat, 1984]. The fact that the vapor pressure is likely above the saturation pressure over ice had already been accounted for by Jouzel and Merlivat [1984] through the formulation of a kinetic fractionation during ice forma- tion. We will adopt their description of the isotopic effects at the vapor-ice phase transition. Besides, during the Bergeron- Findesein process in mixed clouds the vapor pressure is also below the saturation pressure over liquid water. Therefore droplets will not be in isotopic equilibrium with respect to the vapor, which requires to account for a kinetic fraction- ation associated to the vapor-liquid transition.
Hereinafter, we present an isotopic cloud model which fully includes such nonequilibrium processes. This so-called mixed cloud isotopic model (MCIM) is directly in the line of those developed by Jouzel and Merlivat [1984] for the solid phase (referred hereinafter as RMK model) and by Merlivat and Jouzel [1979] for the liquid phase. These models are now currently used in interpreting the isotopic content of polar snow concerning the isotope-temperature relationship. Com- bined with these two models, the MCIM will provide a full description of isotopic processes occurring in an air mass from its oceanic origin up to the cold ice sheet regions. The deuterium excess (a linear combination of both isotopes
defined
as d = •D - 8 •80) will also
be examined
with the
MCIM. The study of d makes it possible to infer climatic information about the conditions of temperature and humid- ity prevailing at the evaporative ocean source of the vapor [Jouzel et al., 1982; Johnsen et al., 1989; Dansgaard et al.,
1989; Petit et al., 1991; Fisher, 1991]. Kinetic fractionation effects are slightly greater in proportion for oxygen 18 than for deuterium. As d couples both isotopes, it is a very relevant parameter to examine in the MCIM which deals specifically with kinetic fractionations. We will explore the properties of d in the MCIM as in the work of Petit et al.
[1991].
2. Description of the Model
Vapor, Liquid, and Ice in the Mixed Cloud Isotopic Model
(MCIM)
The variable T refers to the cloud temperature (or conden- sation temperature), the natural working variable of one- dimensional isotopic models. For model-data comparison we converted the observations from ground to cloud tempera- ture using the empirical linear function derived by Jouzel
and Merlivat [1984] over the Antarctic ice sheet (Tcloud =
0.67 x Tgroun
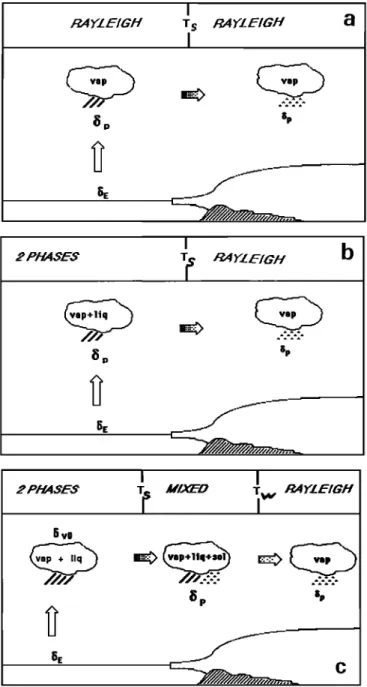
d - 1.2). Figure 1 describes
the condensation
history of an air mass according to three hypotheses. Figure 1 a is a Rayleigh distillation for which the condensed phase is removed as soon as it forms in the cloud. Figure lb is the model of Jouzel and Merlivat [1984] (RMK model) where some liquid remains in the cloud above T,. Figure l c is the MCIM model of this paper. From the ocean evaporation to the apparition of the first ice crystal at Ts the MCIM is strictly identical to the model of Jouzel and Merlivat. Spe- cifically, the moist air is lifted up till its dew point is reached, then starts the condensation process; a certain amount of liquid is kept into the cloud and the vapor is saturated with the liquid (the liquid is in isotopic equilibrium). In the interval (T,, T•) the Bergeron-Findesein process occurs. Ice appears in the system at Ts, but in contrast to the RMK model, supercooled droplets are still present down to T•. Below T• the liquid has entirely disappeared and the cloud is only composed of ice and vapor. At that point, due to successive removal by precipitation, the amount of airborne ice in the cloud is very low. The system is then fairly close to the Rayleigh distillation conditions.
Supersaturation Function
The water vapor partial pressure in the cloud (ew) drives the amount of the different airborne phases. According to the
Bergeron-Findesein hypothesis, the value of e w lies between
the saturation over liquid water (e [) and the saturation over
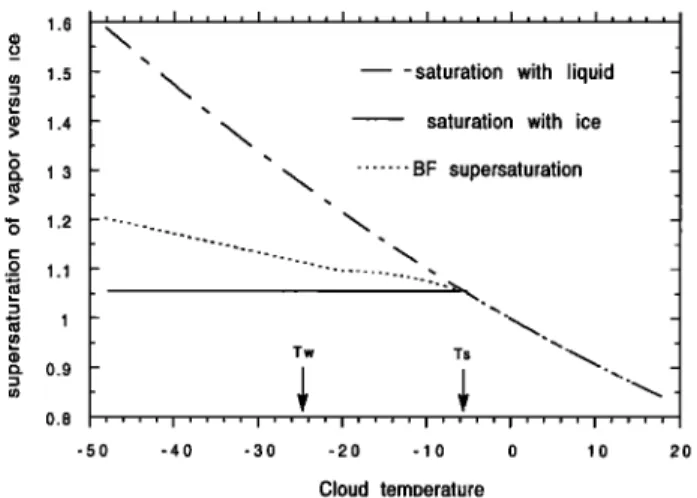
ice (e?). This is shown in Figure 2. Instead of the water vapor partial pressures, we prefer to speak in terms of supersaturation, a commonly used variable in this type of studies. The supersaturation of the vapor with respect to the ice (Si) is defined as
e w
Si = '• -
(1)
ei
There are only very few measurements of S i in polar clouds
[Miller and $chverdtferger, 1972; Miller, 1973]. The exact temperature dependence of S i over the Antarctic cannot be constrained by observations. Therefore the function S i(T) was prescribed in the model for three separate temperature domains. For T > T s, we assume that the vapor is exactly saturated with respect to the liquid droplets in the cloud. This is expressed by
CIAIS AND JOUZEL: DEUTERIUM AND OXYGEN 18 IN PRECIPITATION 16,795
el
Si=el
(2)
For T < Tw, dealing with the vapor-ice transition only, S i is taken to be a linear function of the cloud temperature. This choice is somewhat arbitrary but has proven robust enough to describe correctly the variability of the observed & in snow, including the behavior of the deuterium excess
I
RA
•'L
EIGft
1 $ t34
Y•L
EIGft
a
I
6œ 2 PHASES I t• 7'L E!GHb
2 PHAi
I
MIXED RA
YL
EIGH
cFigure 1. Three generations of one-dimensional isotopic models' (a) classical Rayleigh distillation with a switch between formation of liquid and formation of snow at T -
Ts. (b) RMK model of Jouzel and Merlivat [1984]. Above
T s , some liquid is kept in the cloud, but below Ts the model is a Rayleigh distillation. (c) MCIM model. Above T = Ts, the model is identical to the RMK. Between T = T s and T =Tw, both ice crystals and supercooled droplets coexist in the
system, according to the Bergeron-Findesein process. Be- low T - Tw, there is no more liquid in the cloud and the model approaches a Rayleigh distillation with ice and vapor.
4 , • • , I t , , , I , , , , I , , [ [ I I • I I
•, 3.5
saturation
with
liquid
(eLs)
!'
•E
3saturation
with
ice
(eiS)
•
- BFpartial
pressure
(ew)
(n 2.5 - • 2 -• . ". 1: 1.5 C:). > 0.5 ...C....•. -"' Tw Ts 0 .... I .... I .... I .... I .... -50 -40 -30 -20 -10 0 Cloud temperature
Figure 2. Short-dashed curve, partial pressure of water vapor in the MCIM model as a function of cloud tempera- ture. The partial pressure plotted here corresponds to a
supersaturation of Si = 1.02 - 0.0038 x T below T = Tw.
In between (T s, Tw) the partial pressure obeys the Berg- eron-Findesein hypothesis. Solid curve, saturation pressure for the vapor-ice transition. Long-dashed curve, saturation pressure for the vapor-liquid transition.
[Johnsen et al., 1989; Fisher, 1991; Petit et al., 1991]. In the
standard run of the MCIM model, S i corresponds to the
"preferred case" of Petit et al. [1991].
Si=p + q x T (3)
p = 1.02, q--0.0038
In a recent paper, Fisher [1991] outlined that the function Si probably takes very different values from one storm to the other, or even within the same cloud. Expression (3) should be seen as an average supersaturation relative to several precipitation events, from which we simulate the mean values of/5 and d in snow. Finally, in the interval (Ts, Tw) which defines the limits of the Bergeron-Findesein process, we impose continuity both for S i and its derivative. Gradu- ally, S i becomes lower than the curve describing the satu- ration over liquid water at Ts and reaches the curve (equa-
tion (3)) of supersaturation over ice at Tw. Figure 3 shows
the shape of the S i function of temperature. One cannot entirely dismiss the possibility that as far as liquid water is available to evaporate, the vapor pressure is maintained exactly at its saturation value over the liquid. Such a possibility can be accounted for by adjusting the value of p and q (Figure 3). In any case, the discontinuity in the supersaturation function that occurred in previous works when switching from equation (1) to equation (3) at the onset of the formation of snow does not exist any longer. One of the principal advantages of the MCIM is to fill the modeling
gap of intermediate temperatures (Ts, Tw) by accounting for
mixed cloud processes.
Cloud Model
In this section we describe how the mass transfers among vapor, liquid water, and ice are formulated in the MCIM for the Bergeron-Findesein process. Figure 4 summarizes the microphysical mechanisms interplaying among the different phases. The liquid droplets disappear because of evapora- tion and freezing, whereas the vapor condenses into ice. At
16,796 CIAIS AND JOUZEL: DEUTERIUM AND OXYGEN 18 IN PRECIPITATION 1.6 u) 1.5
>• 1.4
o •. 1.3 • 4.2 .o 1.1 0.8, , I , I , I I , I I I I , , , , i , , , , i , , , , i ,
\•
-- - saturation
with
liquid
-
•
saturation
with
ice
•,•
... BF supersaturation
Tw Ts .... I ' ' ' ' I .... I ' ' ' ' I ' ' ' ' I ' ' ' ' I ' ' ' -40 -30 -20 -10 0 10 -50 20 Cloud temDerature= Ts (mto is the amount of liquid present in the cloud when
the Bergeron-Findesein process begins) to rn t = 0 at T =
Tw. For each condensation step, the variation in the liquid mixing ratio is expressed by
dm I =-Plv -- Pli -- fl (6)
Ice crystals. Ice is formed in the cloud by the freezing of liquid droplets and by the condensation of vapor. It is removed according to the precipitation flux (fi). The evolu- tion of the ice mixing ratio (mi) obeys to
dmi = P vi q- Pli- fi (7)
The solid precipitation (f i) is left adjustable in our model, which serves to control the amount of cloud ice. Specifically,
we used Figure 3. Supersaturation function (S i) of the vapor with
respect to cloud ice in the MCIM model. Vertical arrows are
the boundaries of the Bergeron-Findesein domain (Ts, Tw).
Solid curve, S i for the vapor-ice
transition
at equilibrium.
Long-dashed curve, S i for the liquid-vapor transition atequilibrium. Short-dashed curve, intermediate S i, character-
istic of the Bergeron-Findesein process. Such an intermedi- ate S i function is assumed to be linear below T = Tw (Si -- 1.02 - 0.0038 x T).
each step, the precipitation processes remove a fraction of the cloud liquid water and of the cloud ice. We assume that the condensation history of the moist air mass follows three assumptions: (1) no mixing with the outside air, (2) no large raindrops, (3) no isotopic fractionation when freezing a droplet into an ice particle (the freezing characteristic time of droplets must be short compared to their evaporative char- acteristic time). The mixing ratios of the vapor, the cloud liquid droplets, and the cloud ice are denoted as m v, mr, and m i . The removal of liquid (ice) by precipitation is noted
fl(fi), the evaporative flux of droplets Ply, the freezing of
liquid droplets Pli, the condensation of vapor into ice P vi. Note that the term "liquid precipitation" refers only to the fact that they are derived from the cloud liquid. In a real cloud, especially above an ice sheet, droplets falling to the surface are likely to collide on ice crystals and freeze immediately, hence reaching the ground under solid state [Pruppacher and Klett, 1978; Rogers, 1979; Johnsen et al., 1989]. This freezing nevertheless will not affect their isotopic ratio, as long as the surface temperature is low enough to prevent secondary evaporation during the fall of the drop- lets. The mass balance of the system is expressed by
dmv + dmt + dmi + fl + fi = 0 (4) Water vapor. The mixing ratio of the vapor (mv) is controlled by the air pressure (P) and the water vapor partial pressure (ew) which is a function of temperature. This is expressed by
18Xew
mv = (5)
29xP-18Xew
Liquid water. The liquid mixing ratio (m l) is controlled by the evaporation, the freezing and the precipitation of the cloud droplets. The formulation of P lv and P li is detailed below. The liquid precipitation (fl) is adjusted in such a manner that ml decreases continuously from ml = mr0 at T
fi = C1 prec(mi) if fi < dmi
(8)
fi -- C2 prec(dmi) if fi >- dmi
(9)
The global sensitivity of the model to fi is examined below. The formulation of equations (8) and (9) has no physical
basis.
Both precipitation
coefficients
C lpre
c and C2 prec
are
just a convenient way to fix the amount of cloud ice in a plausible manner (see Figure 5). Typically, the precipitation
coefficient
C• prec
goes
from 0.2 in a mixed cloud
up to 1 in
a Rayleigh
distillation.
The precipitation
coefficient
C2 prec
is
chosen at around 1.01 in a standard run of the MCIM. For
the mass balance equation of the system to be entirely determined, we now have to provide an estimate for the fluxes describing the transfers that occur among the three phases.
Evaporation of liquid water. Cloud droplets evaporate because of the undersaturated conditions during the Berg- eron-Findesein process. The evaporation flux (Ply) is as- sumed to be proportional, first to the departure from satura- tion over liquid water and second to the liquid mixing ratio. As a consequence the more the distance from the saturation increases, the greater the evaporative flux will be. This is
ze V o• "' I z (o I CLOUD LIQUID (DROPLETS) VAPOR CLOUD ICE
PRECIPITATION
Figure 4. Mass transfers between the different constitu- ents in the cloud. Dashed lines point out fluxes which are associated with an isotopic fractionation. Such fluxes in- volve mass transfer due to diffusion processes. The precip- itation (removed from the cloud) and the freezing of liquid droplets are rapid processes and they do not yield any isotopic fractionation.
CIAIS AND JOUZEL: DEUTERIUM AND OXYGEN 18 IN PRECIPITATION 16,797
expressed by equation (10) below, in which the evaporation
coefficient
C e is left adjustable.
In the standard
run, C e is set
to 10-4.Plv= Ce(1 - Sl)ml (10)
St, supersaturation
of the vapor with respect
to the cloud
liquid, is defined bye w
Sl=e[
(11)
Freezing of liquid water. The freezing of a fraction of the
droplets occurs as the temperature decreases [Bigg, 1953].
The corresponding
flux (Pli) relates
to the liquid mixing ratio
according
to equation
(12). The freezing
coefficient
Cf has to
be adjusted by trial and error. In the standard run of themodel,
we used
Cf = 10-4. The
isotopic
model
is not
very
sensitive
to the value of Cf when Cf varies
between
0 and
•10 -3.
P li = Cf(m l)
(12)
Condensation of vapor. The condensation of vapor mol-
ecules on ice crystals (Pvi) is deduced from the decrease in
the vapor mixing ratio at each condensation. This is ex- pressed by
Omv
Pvi = dr (13)
OT
Isotopic Cloud Model
We now examine the isotopic implications of equations (4) to (13). The Bergeron-Findesein process consists of two phase transitions, both out of equilibrium (evaporation of droplets, condensation of vapor into ice). The isotopic effects associated with each transition are different, although they all yield an isotopic depletion of the vapor.
Isotopic fractionation during the Bergeron-Findesein pro-
cess. For the vapor-ice transition in an environment where
the vapor is supersaturated over ice, an extra kinetic effect is
superimposed to the classical equilibrium fractionation co-
efficient a i [Jouzel and Merlivat, 1984]. We used their
formulation of the total fractionation coefficient (aki).Si
oi ki = oi ioi k with oi k = (14)
ai(D/D')(S i - 1) + 1
The value of a• depends on the supersaturation function
$i(T). In a recent work, Fisher [1991] improved the formu- lation of ak by considering the dependence of all the variables on the ambient air temperature. This improvement
produces virtually no changes in the model results for either
isotope and only a small change in the predicted deuterium excess. Hence for the sake of comparison with previous studies, we chose to keep the original formulation of Jouzel and Merlivat [1984] in the MCIM. Using the convention
R SMOW
= 1, we expressed
the condensation
of isotopic
species in the vapor onto ice crystals'
P•i = oiki(1 + /3v)Pvi (15)
As the liquid-vapor transition occurs when the vapor is undersaturated with respect to the liquid, the pertaining
fractionation coefficient also includes additional kinetic ef-
07 06 05 04 03 02 01 o -5o ,, , , I .... I , , , ! I , , ,, I,,,, I,,, ,
---:i:-.-i
/....'_
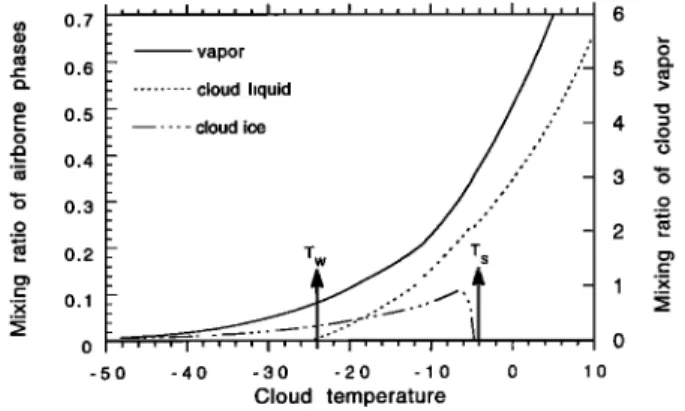
-40 -30 -20 -10 0 10 Cloud temperature 4 _9.0 ._o 2 ._•Figure 5. Mixing ratios of the different constituents in the
cloud for the standard run of the MCIM model. Vertical
arrows mark the boundaries of the Bergeron-Findesein do-
main (T s, Tw). The cloud already contains some liquid at
high temperatures (T > T s). Ice starts forming at T - T s, but it is subsequently removed by precipitation. Liquid droplets disappear completely at T - Tw as the result of successive freezing and evaporation.fects. As far as the liquid phase of the system is composed of
small droplets with a mean radius that does not exceed 30 tam [Jouzel et al., 1975], the liquid and vapor phases may be considered to be in pseudoequilibrium and it suffices to replace the equilibrium fractionation coefficient (al) by its
pseudoequilibrium value (a•l). The general derivation of
for a droplet either growing in a supersaturated environment
or evaporating in an undersaturated environment (our case of interest) is detailed in the Appendix:
oi kl = S l(D'f ') S l
q- ADf
oi I
AD'f'
Df
1-1
+ A (16)
oil
Using (16), the liquid isotopic composition is given by
( 1 + /3 l) = oi kl( 1 + /3 v) (17)
Finally, no isotopic change is associated with the freezing of
liquid because the freezing is rapid (the time needed to freeze
a droplet is much lower than its e-folding isotopic relaxation time). This is expressed by
P'li-(1 + /31)Pli (18)
Complementary equations (19) to (23) consist of those di-
rectly derived from the definition of isotopic ratios. Equation
(24) describes the mass balance of isotopic species. Equa- tions (25) and (26) for isotopes are related to (6) and (7) for the dominant species.
m•, = (1 (19)
m;= (1 + /3i)mi (21)
f'l = (1 + /31)fl (22)
f;= (1 + /3i)fi (23)
16,798 CIAIS AND JOUZEL: DEUTERIUM AND OXYGEN 18 IN PRECIPITATION -100 ._ m -200 E '•i -300 • -4oo E .-• -600 -600 - - vapor
... cloud liquid
.... cloud
ice
.•-
precipitation
. .-..••-'
. ./
-
-
T w
Ts
.
I I , I i ! I I ! I ! I I I ' I , , , I , , , I , , , -5;0 -40 -30 -20 -10 0 10 20 Cloud temperature b lOO •- o -•. -100 .--. c•. -200 -300 -4oo -500 -600 -5;0 -40 -30 -20 -10 . ' ' ' I ' ' ' I ' ' ' I ' ' ' I ' ' ' I' 1. Bergeron-Findeseln intermediate supersaturation
.- •=1.02-0.038.T
' 2. vapor at saturation with liquid
'- 3.
vapor
at
saturation
with
lee
.:
. , , , I , . . I , , , I , , , I , , , I o lO 20 Cloud temperature C 80 60 -•.. 4 o .--. c•. 20 .--. x1. Bergeron-Flndeseln Intermediate supersaturation '
',
•=1.02-0.038.T
-
3 -
., 2. vapor at saturation with liquid -
",, 3. vapor at saturation with Ice '
. . AAA A A A & ,.. -' - _ -•,:.•, •. _. _. _._., ... . . -20 . o , - 2 ' . , , . , I , . , . I , , . , I , . , , I , , , . I , , , , I , . , , -40 -5;00 -45;0 -400 -35;0 -300 -250 -200 -1 50 Deuterium In precipitation
CIAIS AND JOUZEL: DEUTERIUM AND OXYGEN 18 IN PRECIPITATION 16,799
dm•, + dm• + dm'i= -f •- f'i d tn 'l = - P 'l v - P 'l i - f 'l
(24)
(25)
ture source on the MCIM deuterium excess is discussed in
section 4.
dm' = P' + P' - f' i vi !i i (26)
The mean isotopic composition of the total precipitation is a composite term which includes the precipitation derived from airborne liquid and from airborne ice. This is expressed by
f'l + f'i
(1 + /5)- (27)
f+fi
The system
of equations
is solved
by differentiating
equa-
tions (19) to (21), combining them into the isotopic mass balance equation (24) to obtain the infinitesimal variation in 8 of the vapor and in 8 of the ice between two successive condensation steps. This leads to (26) and (27).
dSv -1
• = (mtd a •:! - P tv a
(1 + • v) (me + o•
i•trn
t)
+ Pvi a ki q- dmv) (28)
1
da i = m [-(1 + ai)(Pli + Pvi) + (1 + av)OtkiPvi
mi
+ ( 1 + a v) a •:tP li] (29) Equations (28) and (29), together with (17), determine com-
pletely the isotopic composition
of each airborne phase in
the cloud. The composition of the precipitation derives from (27). The results of the MCIM are discussed in section 3. The sensitivity of the model is discussed with respect to the supersaturation and to the specificities of mixed cloud pro- cesses. The influence of evaporative conditions at the mois-Figure 6. •(Opposite) (a) Deuterium content (SD) in the
different constituents of the cloud as a function of cloud
temperature. The curves correspond to the standard run of
the MCIM model where the supersaturation below T = Tw
is given by Si = 1.02 - 0.0038 x T. The 8D of the vapor is lower by approximately 100%o than 8D of any airborne
condensed
phase. The 8D of the liquid is lower than 8D of
the ice, mostly because the cloud ice keeps an isotopic memory of ice formed at previous condensation steps. The 8D in precipitation lies in between 8D of solid and 8D of liquid as the precipitation removed from the system is derived from both condensed phases. (b) Deuterium in precipitation versus cloud temperature for different satura- tion conditions (S i) in the MCIM model. 1. Bergeron- Findesein hypothesis where S i takes intermediate values between saturation over ice and saturation over liquid. Curve 1 plots the standard run of the MCIM model (Si = 1.02 - 0.0038 x T). Curve 2: the vapor is at saturation with respect to cloud liquid. Curve 3: the vapor is at saturation with respect to cloud ice. Triangles are observations made by Lorius and Merlivat [1977] in East Antarctica (ground temperatures have been turned into cloud temperaturesusing
Tclou
d = 0.67 x Tgroun
d - 1.2). (c) Excess
in precip-
itation versus 8D in precipitation for different saturation conditions (S i) in the MCIM model. Curves 1, 2, and 3 correspond to Figure 6a. Triangles are observations com- piled by Petit et al. [1991].
3. Results and Sensitivity Study of the MCIM
ModelResults
Mixing ratios. Figure 5 shows the mixing ratios of the vapor, the cloud liquid, and the cloud ice. The vapor is progressively converted into ice and its mixing ratio rn v decreases during the air parcel history. The liquid mixing is equal to ml0 at the onset of the Bergeron-Findesein process (T•), but droplets are partly frozen and partly evaporated so that rni is equal to zero at T•. Ice forms in the cloud starting at T• as a result of droplets freezing and vapor condensation. If no precipitation occurred, ice crystals would accumulate in the cloud and eventually represent the whole airborne condensed phase. This is not the case because the precipi- tation (fi) causes m i to decrease at low temperatures. At the
lower end of the Bergeron-Findesein domain (T•), the
amount of ice in the cloud is already so reduced that the system practically follows the conditions of a Rayleigh
distillation.
Simulated Bs. Figure 6a shows • of all airborne phases in the MCIM, as a function of temperature. Because the fractionation pertaining to the vapor-liquid transition is lower than for the vapor-ice transition, the newly formed liquid has a lower • than the newly formed ice. Moreover,
the airborne ice sequestered in the cloud keeps a memory of
previous condensation steps (with a higher •), whereas the liquid is fully equilibrated with the vapor at each step. This
drives the • value of airborne ice above the 8 of airborne
liquid (Figure 6a). Generally, • in precipitation lies between • of the liquid and • of the ice. The MCIM • in precipitation agrees well with observations in Antarctica, both at low temperatures (between -20øC and 40øC) and intermediate temperatures (between 0øC and 20øC). Realistic, very nega- tive, 8D values close to -400%o are obtained when the cloud temperature reaches -40øC. Such an agreement of one- dimensional isotopic models with observations at low tem-
peratures
is not a speci•c
performance
of the MCIM (the
model of Jouzel and Merlivat, for instance, is also quite satisfying from this point of view). However, for intermedi- ate temperatures, the agreement with observations is slightly improved in the MCIM compared to previous models. This is because there is no discontinuity in • at T• in the MCIM.
Sensitivity of the MCIM model to the saturation conditions of the vapor in the cloud. Figure 6b displays •D in precip- itation versus temperature simulated by the MCIM for three different assumptions on the saturation conditions of the vapor. Specifically, we tested three possibilities for the vapor in the cloud (1) in between saturation with ice and saturation with respect to liquid (Bergeron-Findesein hy- pothesis), (2) saturated with respect to liquid, and (3) satu- rated with respect to ice. Between T s and T• the simulated •D values do not differ by more than 20%o between extreme cases (2) and (3). For temperatures below T• this discrep- ancy increases up to 60%o. Figure 6b suggests a better agreement of the simulated •D with the observations when the supersaturation takes its values between cases 1 and 3. Figure 6c shows the behavior of the deuterium excess in the MCIM for cases (1), (2), and (3). The d values increase
16,800 CIAIS AND JOUZEL: DEUTERIUM AND OXYGEN 18 IN PRECIPITATION
inland, as effectively observed in Antarctica, except when the vapor is kept at saturation with the liquid as in case (2).
This suggests that the vapor is probably never at saturation
with the liquid in polar clouds. Also, when the vapor is kept at saturation with the solid, the MCIM overestimates d values (d = + 40 to +50%o). Figure 6c suggests that only an intermediate supersaturation analogous to case (1) yields a correct agreement with the data. We made several runs of the MCIM using various slopes for $i(T) as in the work of Fisher [1991]. These runs showed that d in the MCIM is very sensitive to S i. The sensitivity of the MCIM to the super- saturation was similar in magnitude, although slightly lower, than in the works of Jouzel and Merlivat [1984] or Fisher [1991]. For instance, an increase in $i from 1.2 to 1.5 at -40øC has the effect to increase the value of d in the MCIM by + 10%o. The best agreement with the observations was
found in the supersaturation range 1.15 to 1.25. Such a range
appears plausible in view of the few existing observations [Miller and Schwerdtfeger, 1972; International Atomic En- ergy Agency (IAEA), 1969-1986].
Sensitivity of the Model
We have shown that the sensitivity of the MCIM to the supersaturation was similar to previous one-dimensional isotopic models. We now examine features that are specifi- cally new in the MCIM. First, droplets and ice crystals coexist between Ts and Tw. Second, a nonzero amount of condensed phase is kept within the cloud. The first point is addressed by varying the nature (liquid or solid) of the airborne condensed phase. The second point is examined by testing different amounts of condensate in the cloud, which is equivalent in comparing the MCIM with the model of Jouzel and Merlivat (Rayleigh distillation).
Coexistence of liquid and ice. We define the nature of the airborne condensed phase as the relative proportion of liquid droplets versus ice crystals during the Bergeron-Findesein process. The variable p is constructed as the ratio of the droplets to the total airborne condensed phase in between (Ts, Tw). Provided that the precipitation intensity is main- tained constant, p depends only on the evaporation and on
the freezing
of the droplets
(coefficients
C e and Cœ).
In the
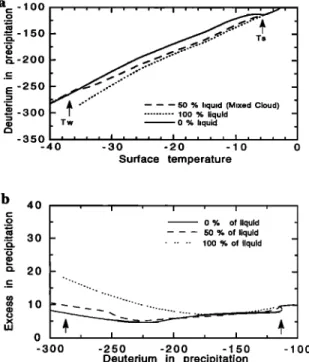
real world, p certainly differs among clouds and may possi- bly take any value between 0 and 1. We limited ourselves to three test cases. We considered a typical mixed cloud (p = 0.5), a cloud made only with ice (p = 0), and a cloud made only with liquid (p = 1). In all three cases the total amount of condensed phase is the same.The •-T relations: Figure 7a shows &D versus T, re-
spectively,
for p = 0, p = 0.5, and p = 1 (considering/5]80
instead of &D does not change the conclusions). The gradient
&D - T changes
by no more
than 1%oC-]
between
extreme
cases p = 0 and p = 1. This translates into a difference of 25%o in/SD of precipitation at -40øC. The existing datasets of /5 in surface snow do not allow to sort out this effect. Also, due to a less efficient fractionation for the liquid-vapor transition than for the vapor-ice transition, & of the con- densed phase decreases more rapidly with T when the cloud contains a higher amount of liquid. Below Tw, we deal with ice crystals only and the system approaches a Rayleigh distillation. In this range of temperature the MCIM gives a
&D - T gradient
of 6.5%oC
-• , a value close
to Rayleigh-
type models which is in fair agreement with the empirical
gradient
of 6.04%oC
-] proposed
by Lorius and Merlivat
• -15o •.-200 .•_ •) -300 -- •- I ... 100% liquid
(t)
t T w
- - - 0 % liquid
-350 ' .... ' .... I , , , • -40 -30 -20 -10 Surface temperatureb 4o
• 30 ._o. o. 20 .c_ • 10 x 0 ' I ' I • I 0 % of liquid 50 % of liquid ... 100 % of liquid -300 -250 -200 -150 -100 Deuterium in precipitationFigure 7. Sensitivity of the MCIM isotopic model to dif- ferent compositions (liquid/solid) for the total airborne con- densed phase (parameter p in section 3). The total amount of the airborne phase is the same in all experiments. (a) /SD in precipitation versus temperature. (b) Excess in precipitation versus/SD in precipitation. Vertical arrows are boundaries of
the Bergeron-Findesein domain (Ts, Tw).
[1977] in East Antarctica. Our conclusion is that the nature of the condensed phase formed under the Bergeron- Findesein conditions does not strongly influence the/5 - T relationship.
The fiD-fil$o relationship:
Although
the gradients
&D -
/5
]80 obtained
in the MCIM for the three
cases
of p were
all
fairly similar (not shown), d proved to be more sensitive (Figure 7b). It is observed that between cases p = 0 and p = 1, d differs by several per mils. However, an "all liquid" configuration (p = 1) must be improbable, considering that supercooled droplets are far from the equilibrium with the vapor. Besides, d obtained in the model for a mixed cloud (p = 0.5) and for an "all ice" cloud (p = 0), was not very different, even at low temperatures.
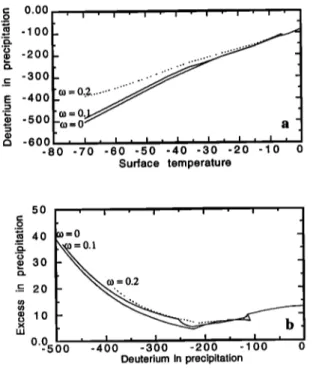
Amount of condensed phase kept in the cloud. We exam- ine now the consequences of keeping in the cloud various quantities of a condensed phase during the Bergeron- Findesein process. In the MCIM the total airborne con- densed phase is entirely controlled by the precipitation intensity. A systematic removal of the condensed phase formed at each condensation represents the extreme case of Rayleigh distillation conditions, whereas no removal would correspond to a hypothetical closed system [Jouzel, 1986].
We constructed the variable to in such a manner that to = 0
in a Rayleigh distillation and to - 1 for a closed system where all the condensed phase is kept in the cloud. By setting the values offi and ft, to can be varied within the interval [0, 1]. The •-T relations: The gradients &D - T obtained for various amounts of condensed phase are shown in Figure 8a. It is clear that the gradient &D - T is sensitive to to (a higher to drives a smaller gradient &D - T). This can be
CIAIS AND JOUZEL' DEUTERIUM AND OXYGEN 18 IN PRECIPITATION 16,801
understood as a "memory" of the airborne phase formed at
previous steps which progressively
accumulates
into the
cloud. If more airborne phase is kept (to is higher), theprecipitation
has a higher/5.
Within the interval (Ts, Tw) the
gradient/JD - T changes
by a factor 3 when passing
from
Rayleigh to closed system conditions.
However, a closed
system cloud type is only approached
in the inner core of
very strong
convective
clouds, and the most frequent values
of water content found in all types of stratiform clouds arewithin
the narrow
range
of 0.05-0.25
gm
-3 generally
less
for
stratiform clouds in polar regions [Mason, 1971]. As an
example, Miller [1973] infers from crystal growth calcula-
tions
that a crystal
mass
density
of 5.10
-9 gm
-3 can be
expected
at the top of the inversion
layer over the Antarctic
plateau. Multiplying this estimate
by a factor as large as 1000
would still leave to very low. In Antarctica as well as in Greenland [Johnsen et al., 1989], & measured in snow isconsistent only with low values of to in isotopic models. This
may explain the overall good performances
of previously
used Rayleigh-type
isotopic models, despite their simplistic
characteristics.The 6D-6180 relationships:
The gradients
&D - &•80
simulated by the MCIM for different values of to do not deviate significantly from the meteoric water line, which
suggests
an observational
gradient
/JD - /j•80 close
to 8
[Craig and Gordon, 1965]. Regarding the deuterium excess,
as long as to does not exceed 10 to 15%, the MCIM is able to match correctly the observations, including the deuterium excess of inland Antarctica that can be as large as +20%ø
[Petit et al., 1991]. Again, a reasonable agreement with the d
o -200
•-
•"
-
'•- •:0
=
0.
• -500 (o=0 a • -600/ , I , I , • , I , I , I , I , -80 -70 -60 -50 -40 -30 -20 -10 0 Surface temperature 50 ' I ' I ' I ' I .o • 40 =o i• :0.1 .e 30.c_
20
'...
• 10
"' ..
00 , I , , I , '-500 -400 -300 -200 - 100 0 Deuterium in precipitationFigure 8. Sensitivity of the MCIM isotopic model to dif-
ferent amounts of total airborne condensed phase (total is equal to liquid plus ice). The amount of total condensedphase is varied by changing the value of to in section 3 (to =
0 means Rayleigh distillation, to -- 1 means closed system without precipitation). (a) &D in precipitation versus temper- ature. (b) Excess in precipitation versus &D in precipitation.
2O o15 'F, ._
•10
._c u• 5 o 0 ' ' ' I ' ' ' I ' ' ' I ' ' ' I ' ' ' I ' ' '- Rayleigh
model
•
T
c
=-40
-UOlU
model
•
•
TC---35•
•'•'""•-
• "'"' ----
'"'5• To--'20
, , , I , , , I , , , I , , , I , , , I , , , -5 14 16 18 20 22 24 26Source temperature (Te)
Figure 9. Response
of d in precipitation
to the evaporative
source
temperature
(Te). The response
is plotted at different
condensation temperatures going from T½ = -20øC to T½ =
-40øC. Note that d is more sensitive to T e when going inland. The results obtained using the MCIM isotopic model (solid curves) are compared to those obtained using the RMK model of Jouzel and Merlivat (dashed curves).
observations can be reached only when the system is close to the Rayleigh conditions at low temperature.
4. Influence of the Evaporative Source
Conditions on d Values
in Precipitation
Previous works have outlined the fact that d in polar precip-
itation is largely
determined
by the source
conditions,
specifi-
cally by the following three parameters: sea surface tempera-
ture (Te), relative
humidity
(H), and wind speed
(W). This has
motivated attempts to use d as a proxy of ocean surface
conditions [Jouzel et al., 1982; Johnsen et al., 1989; Petit et al.,1991]. In this section we examine the sensitivity of the MCIM
model to the source conditions and compare it with previous
one-dimensional isotopic models (RMK model).
Sea surface temperatures. Petit et al. [1991] pointed out
that the sea surface temperature (SST) largely determines d
values in Antarctic snow. They also demonstrated that warmer SST result in higher d in snow, especially at inland
sites (mean surface temperatures lower than -30øC). The
question is how the implementation of the Bergeron-
Findesein
process
modifies
these conclusions.
For both the
MCIM and the RMK models, Figure 9 shows d versus T e at different in situ condensation temperatures. Globally, thesensitivity
of the MCIM model to T e is similar to that of the
RMK. Whatever the in situ temperature the maximumdiscrepancy
between both models indeed does not exceed
2%0 for the excess. Using the partial derivative o' t = Od/O T e ,which measures the response of d in precipitation to changes
in SST, we found that T e is about 3 times more important
in
governing
the excess
in snow at -40øC than at -20øC. The
difference
in O'
t obtained
in the RMK and MCIM models,
respectively, at a given temperature is small.Relative humidity and wind speed. In agreement with
Petit et al., the MCIM model produces lower deuteriumexcesses
in response to increased source humidity. The
sensitivity
of d to changes
in H being assessed
by the value
16,802 CIAIS AND JOUZEL: DEUTERIUM AND OXYGEN 18 IN PRECIPITATION
of trH = Od/OH at a given condensation temperature, we found that trH in the MCIM decreases by a factor 2 between coastal (-20øC) and inland locations (-40øC). In other terms the memory kept by d of changes in H at the source is larger on the coast than over the central ice sheet regions. When it comes to the comparison of the MCIM to the RMK model,
the response of d to H is very similar. The wind speed above
the ocean surface triggers the initial fractionation coefficient, an effect which is expected to be preserved through the cooling history and seen in d of precipitation. However, the excess is not a monotone function of the wind speed, so that low and high wind speed values can yield identical d values [see Petit e! al., 1991]. In addition, the high-frequency variability of the wind is likely to smooth out its influence on
the deuterium excess. We will not discuss in detail this
problem. In summary, regarding the response of d to the source conditions, the results of the MCIM model fully endorse the conclusions of the detailed sensitivity study presented by Petit et al. [1991].
Conclusion
The main difference between the MCIM isotopic model presented in this study and the previous one-dimensional isotopic models consists in a more refined description of the microphysical processes occurring at low temperatures. Below 0øC and down to -15 ø to -30øC, we allow a certain fraction of the preexisting liquid, formed at higher tempera- tures, to remain in the cloud. Simultaneously, the solid phase that progressively appears is not systematically re- moved. In this case, the water vapor mixing ratio takes an
intermediate value between saturation over ice and satura-
tion over water. Droplets evaporate, whereas the vapor tends to condense on the growing ice crystals. The predicted • - T gradients and d in precipitation compare well with the available data in Antarctic surface snow, but they are not very sensitive to the quantity of liquid or solid kept in the cloud. On the other hand, in accordance with previous models, d in the MCIM remains strongly dependent on changes in the supersaturation function. The impact of climatic changes at the evaporative moisture source on the d values shows quite similar features than those previously obtained using Rayleigh- type models. In summary, taking into account realistically the processes that lead to the formation of the precipitation does not imply reassessing the climatic information previously de-
rived from the deuterium excess.
Nevertheless, the present study concerns a given air parcel and does not simulate the conditions of the wide scale poleward moisture transport. In particular, we did not dis- cuss the nature of the trajectory, nor the eventual mixing of the air during the isotopic history. The fact that the • in snow, at a given location, results from several precipitation events, possibly characterized by different origins [Fisher, 1990], has also not been envisaged. Simulations of the water isotope cycle using GCMs [Joussaume et al., 1984 ; Jouzel et al., 1987] seems a promising approach for solving these problems as their results may help to constrain the moisture
transport of the present one-dimensional model. In addition,
GCMs make it possible to take into consideration the geo- graphical variability of • in the original oceanic vapor, which plays a key role in governing the d values.
Appendix: Pseudoequilibrium Fractionation
Coefficient for Liquid-Vapor Phase Transition
out of Saturation
We infer the pseudoequilibrium fractionation factor
from the isotopic
evolution
of a liquid droplet
growing
from
the surrounding vapor as a result of molecular collisions. Growth by coalescence has not been taken into account
because its contribution
becomes important only if the
droplet radius exceeds 30 tam. The saturation with respect to the liquid-vapor equilibrium is expressed by Sl, defined bye w
S l -- (A1)
el
Values of S l lower than 1 account for liquid droplets placed in undersaturated vapor, which corresponds specifically to the conditions of the Berg•ron-Findesein process and has for consequence the progressive disparition of the droplets by evaporation. The rate of change in the isotopic ratio of a droplet in such an environment is expressed by (A2) [Stew- art, 1975]'
dR•
dt a2p D Sr R
_ 3p
sat ,f,
•
drop A + • (Rr)(Sr - 1) - ADf(Rr)(Sr - 1) (A2) cg L wherea droplet average radius;
Pdrop droplet
average
density;
Psat vapor density at saturation; D diffusivity of water vapor.in the air;
f ventilation coefficient of the water vapor [Kinzer and Gunn, 1951, p. 74];
D', f' same for isotopic species;
A droplet vapor heat transfer coefficient [Jouzel, 1974, p. 38];
ar equilibrium fractionation coefficient [Majoube,
1971].
Equation (A2) depends on the isotope ratios of the droplets
and the surrounding vapor, R r and Rv, respectively, in such
a manner that it can be rewritten under the form
dR•
dt = a 1RL + a2R v (A3)
The expression of the factors a 1 and a 2 is given by
.... St.+ '
a 1 a 2p
drop rg
L
rg
L
ß
(St.
- 1)
- ADf(St.
- 1)]
3 p sat (D'f ')St.a2
= 2p
a dropAssuming a constant isotopic ratio for the vapor (Rv), (A2) has the solution